Earth
ID: 3852
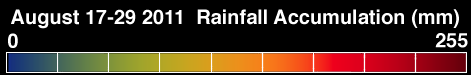
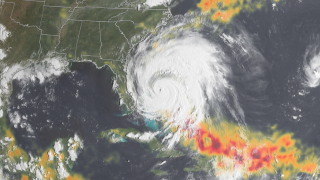
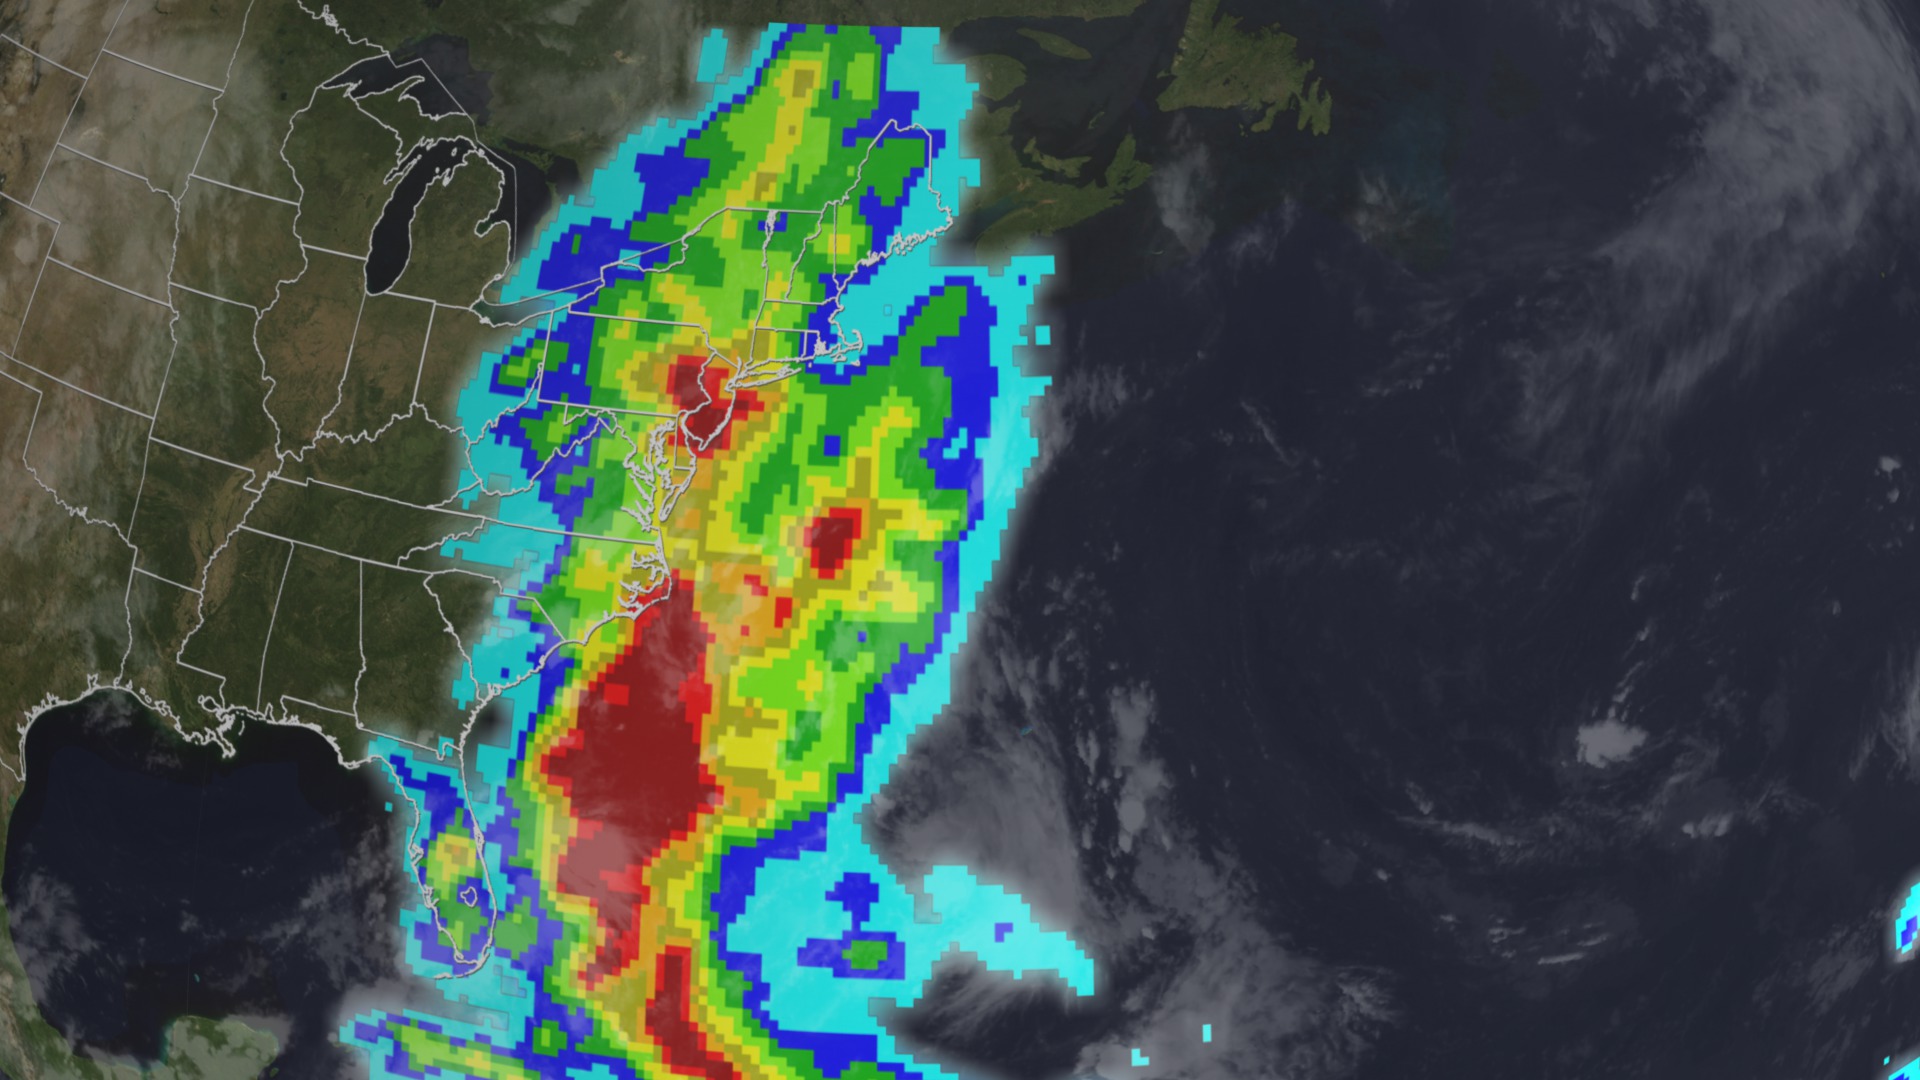
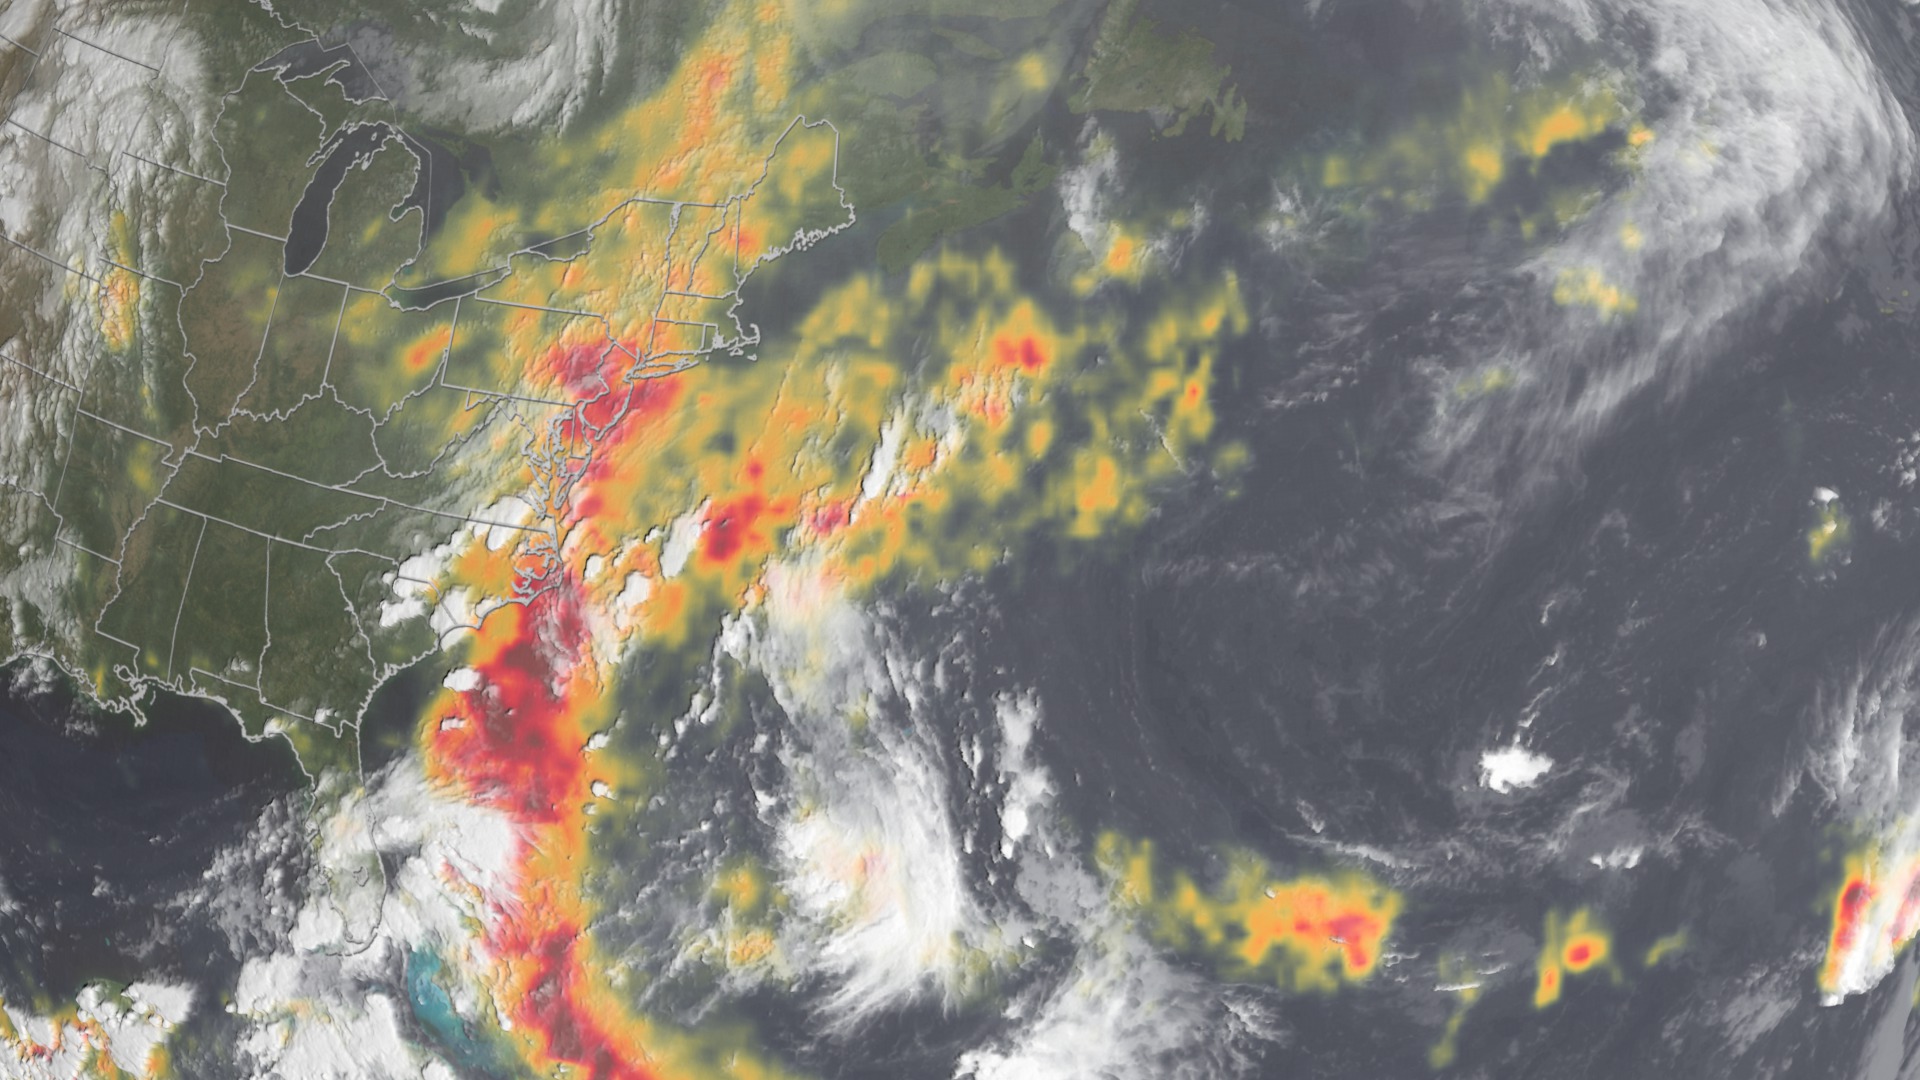
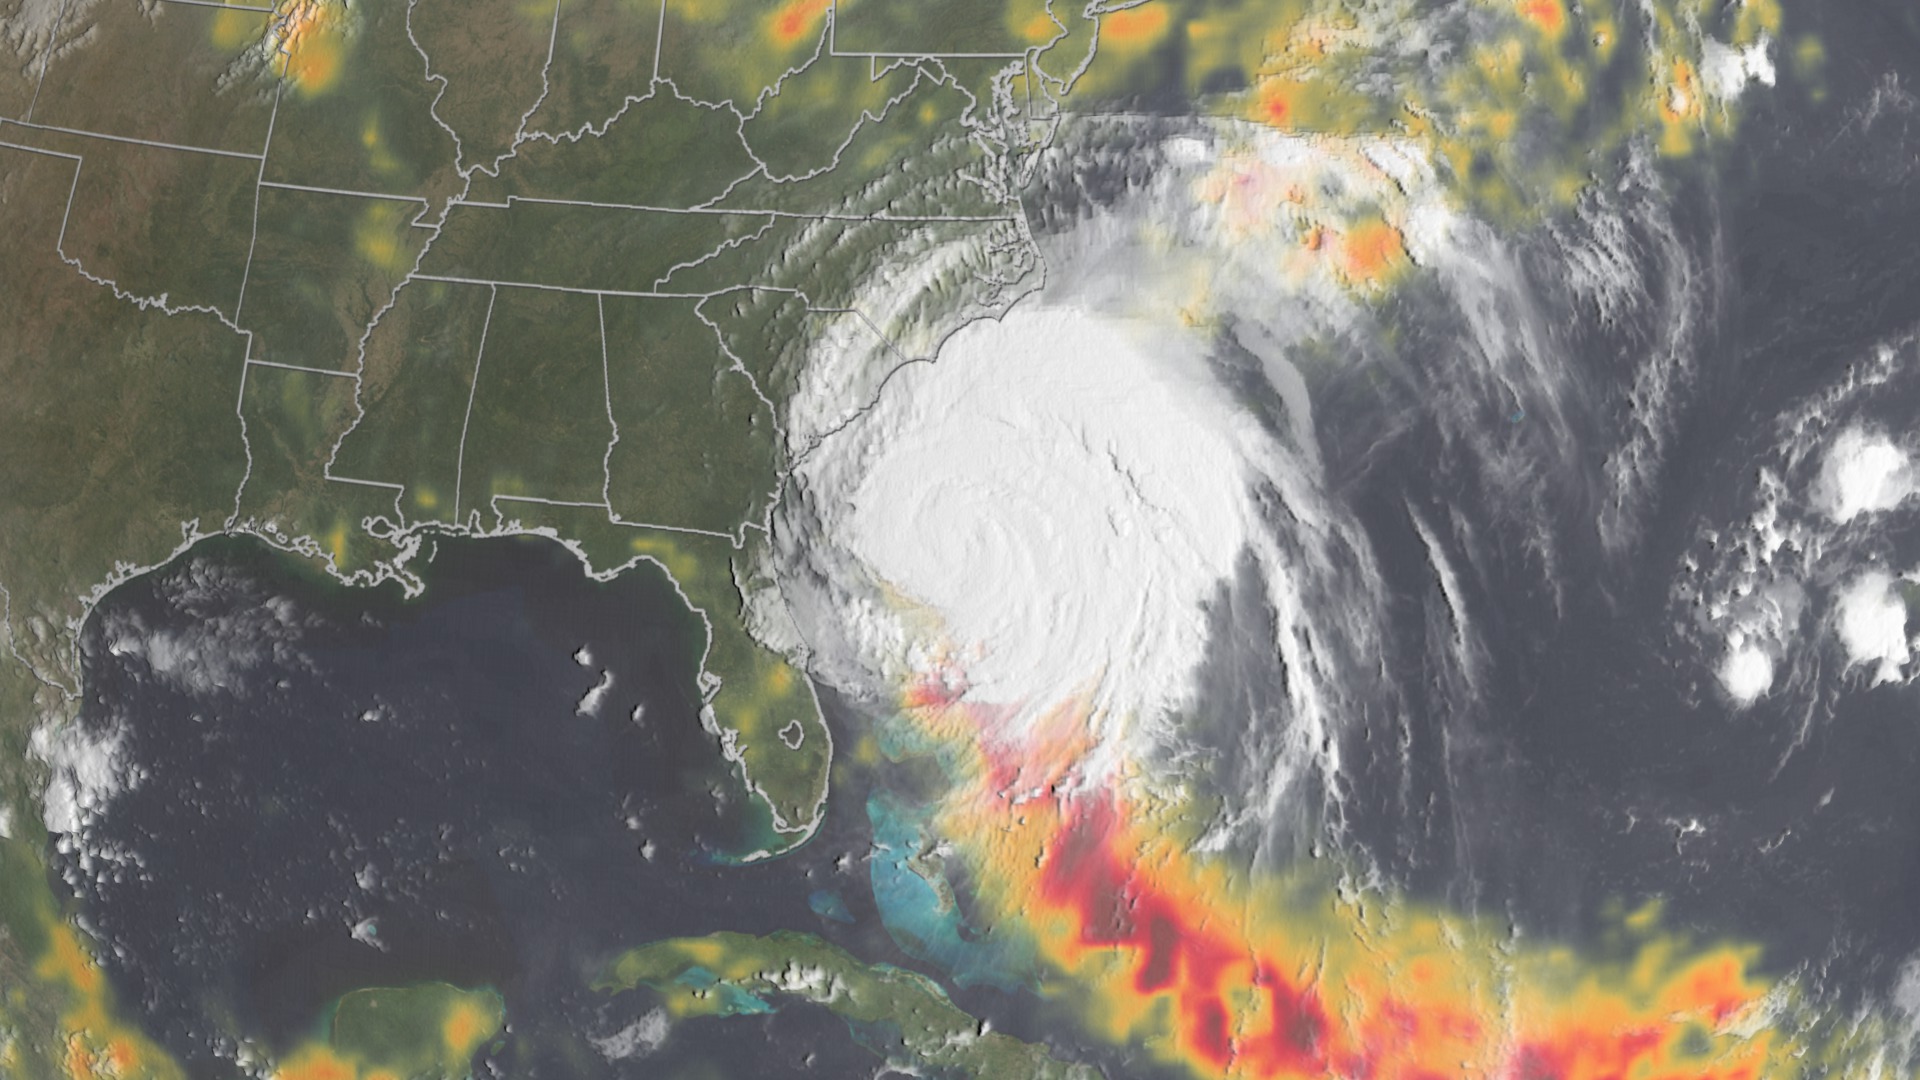
This visualization follows the development of Hurricane Irene as it moves up the East Coast of the United States in August of 2011. There are three versions of this visualization. Two of the versions follow the eye of the storm until it dissipates, then pulls back to reveal the rain fall accumulation track as measured by the Tropcical Rainfall Measuring Mission (TRMM) using two different color tables. The first version only includes rainfall along the storm track. The second and third versions include all rainfall. The third version shows the rainfall accumulating as the storm moves.

Hurricane Irene
These visualizations were created to support presenstations at the National Air and Space Museum (NASM) 2011.
Related
Visualization Credits
Greg Shirah (NASA/GSFC): Lead Animator
Lori Perkins (NASA/GSFC): Animator
Trent L. Schindler (USRA): Animator
Matthew R. Radcliff (USRA): Producer
Arthur Hou Ph.D. (NASA/GSFC): Scientist
Chris Kidd (University of Maryland): Scientist
Lori Perkins (NASA/GSFC): Animator
Trent L. Schindler (USRA): Animator
Matthew R. Radcliff (USRA): Producer
Arthur Hou Ph.D. (NASA/GSFC): Scientist
Chris Kidd (University of Maryland): Scientist
Please give credit for this item to:
NASA/Goddard Space Flight Center Scientific Visualization Studio
NASA/Goddard Space Flight Center Scientific Visualization Studio
Short URL to share this page:
https://svs.gsfc.nasa.gov/3852
Missions:
Terra
Tropical Rainfall Measuring Mission - TRMM
Data Used:
Note: While we identify the data sets used in these visualizations, we do not store any further details nor the data sets themselves on our site.
Keywords:
DLESE >> Atmospheric science
SVS >> HDTV
DLESE >> Natural hazards
SVS >> Rainfall
SVS >> Rainmap
GCMD >> Earth Science >> Atmosphere >> Atmospheric Phenomena >> Hurricanes
GCMD >> Earth Science >> Atmosphere >> Precipitation >> Rain
SVS >> Hyperwall
NASA Science >> Earth
SVS >> Presentation
GCMD keywords can be found on the Internet with the following citation: Olsen, L.M., G. Major, K. Shein, J. Scialdone, S. Ritz, T. Stevens, M. Morahan, A. Aleman, R. Vogel, S. Leicester, H. Weir, M. Meaux, S. Grebas, C.Solomon, M. Holland, T. Northcutt, R. A. Restrepo, R. Bilodeau, 2013. NASA/Global Change Master Directory (GCMD) Earth Science Keywords. Version 8.0.0.0.0
https://svs.gsfc.nasa.gov/3852
Missions:
Terra
Tropical Rainfall Measuring Mission - TRMM
Data Used:
CPC (Climate Prediction Center) Cloud Composite
Data Compilation - Climate Prediction Center (CPC)
Global cloud cover from multiple satellites
TRMM/TMI/Rainfall Accumulation
Terra and Aqua/MODIS/Blue Marble: Next Generation also referred to as: BMNG
Credit:
The Blue Marble data is courtesy of Reto Stockli (NASA/GSFC).
The Blue Marble data is courtesy of Reto Stockli (NASA/GSFC).
Keywords:
DLESE >> Atmospheric science
SVS >> HDTV
DLESE >> Natural hazards
SVS >> Rainfall
SVS >> Rainmap
GCMD >> Earth Science >> Atmosphere >> Atmospheric Phenomena >> Hurricanes
GCMD >> Earth Science >> Atmosphere >> Precipitation >> Rain
SVS >> Hyperwall
NASA Science >> Earth
SVS >> Presentation
GCMD keywords can be found on the Internet with the following citation: Olsen, L.M., G. Major, K. Shein, J. Scialdone, S. Ritz, T. Stevens, M. Morahan, A. Aleman, R. Vogel, S. Leicester, H. Weir, M. Meaux, S. Grebas, C.Solomon, M. Holland, T. Northcutt, R. A. Restrepo, R. Bilodeau, 2013. NASA/Global Change Master Directory (GCMD) Earth Science Keywords. Version 8.0.0.0.0


