Earth
ID: 3333
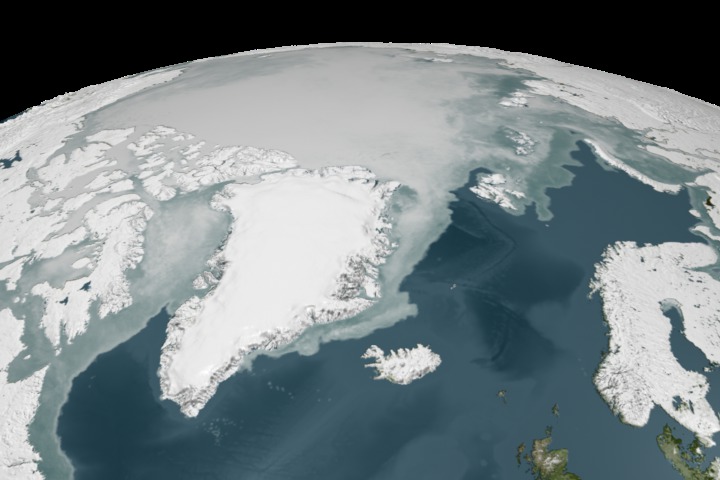
This animation shows the Spring retreat and subsequent Autumn advance of sea ice over the Arctic from 1/1/2005 through 12/31/2005. The false color of the sea ice, derived from the AMSR-E 6.25 km brightness temperature, was designed to highlight the fissures in the sea ice. Moving 3-day minimum brightness temperatures provide a background for smooth ice movement over which the actual daily brightness temperatures were mapped for definition of the ice structures. The sea ice extent was defined by a 3-day moving average of the AMSR-E 12.5 km sea ice concentration, showing as ice all areas having a sea ice concentration greater than 15%.
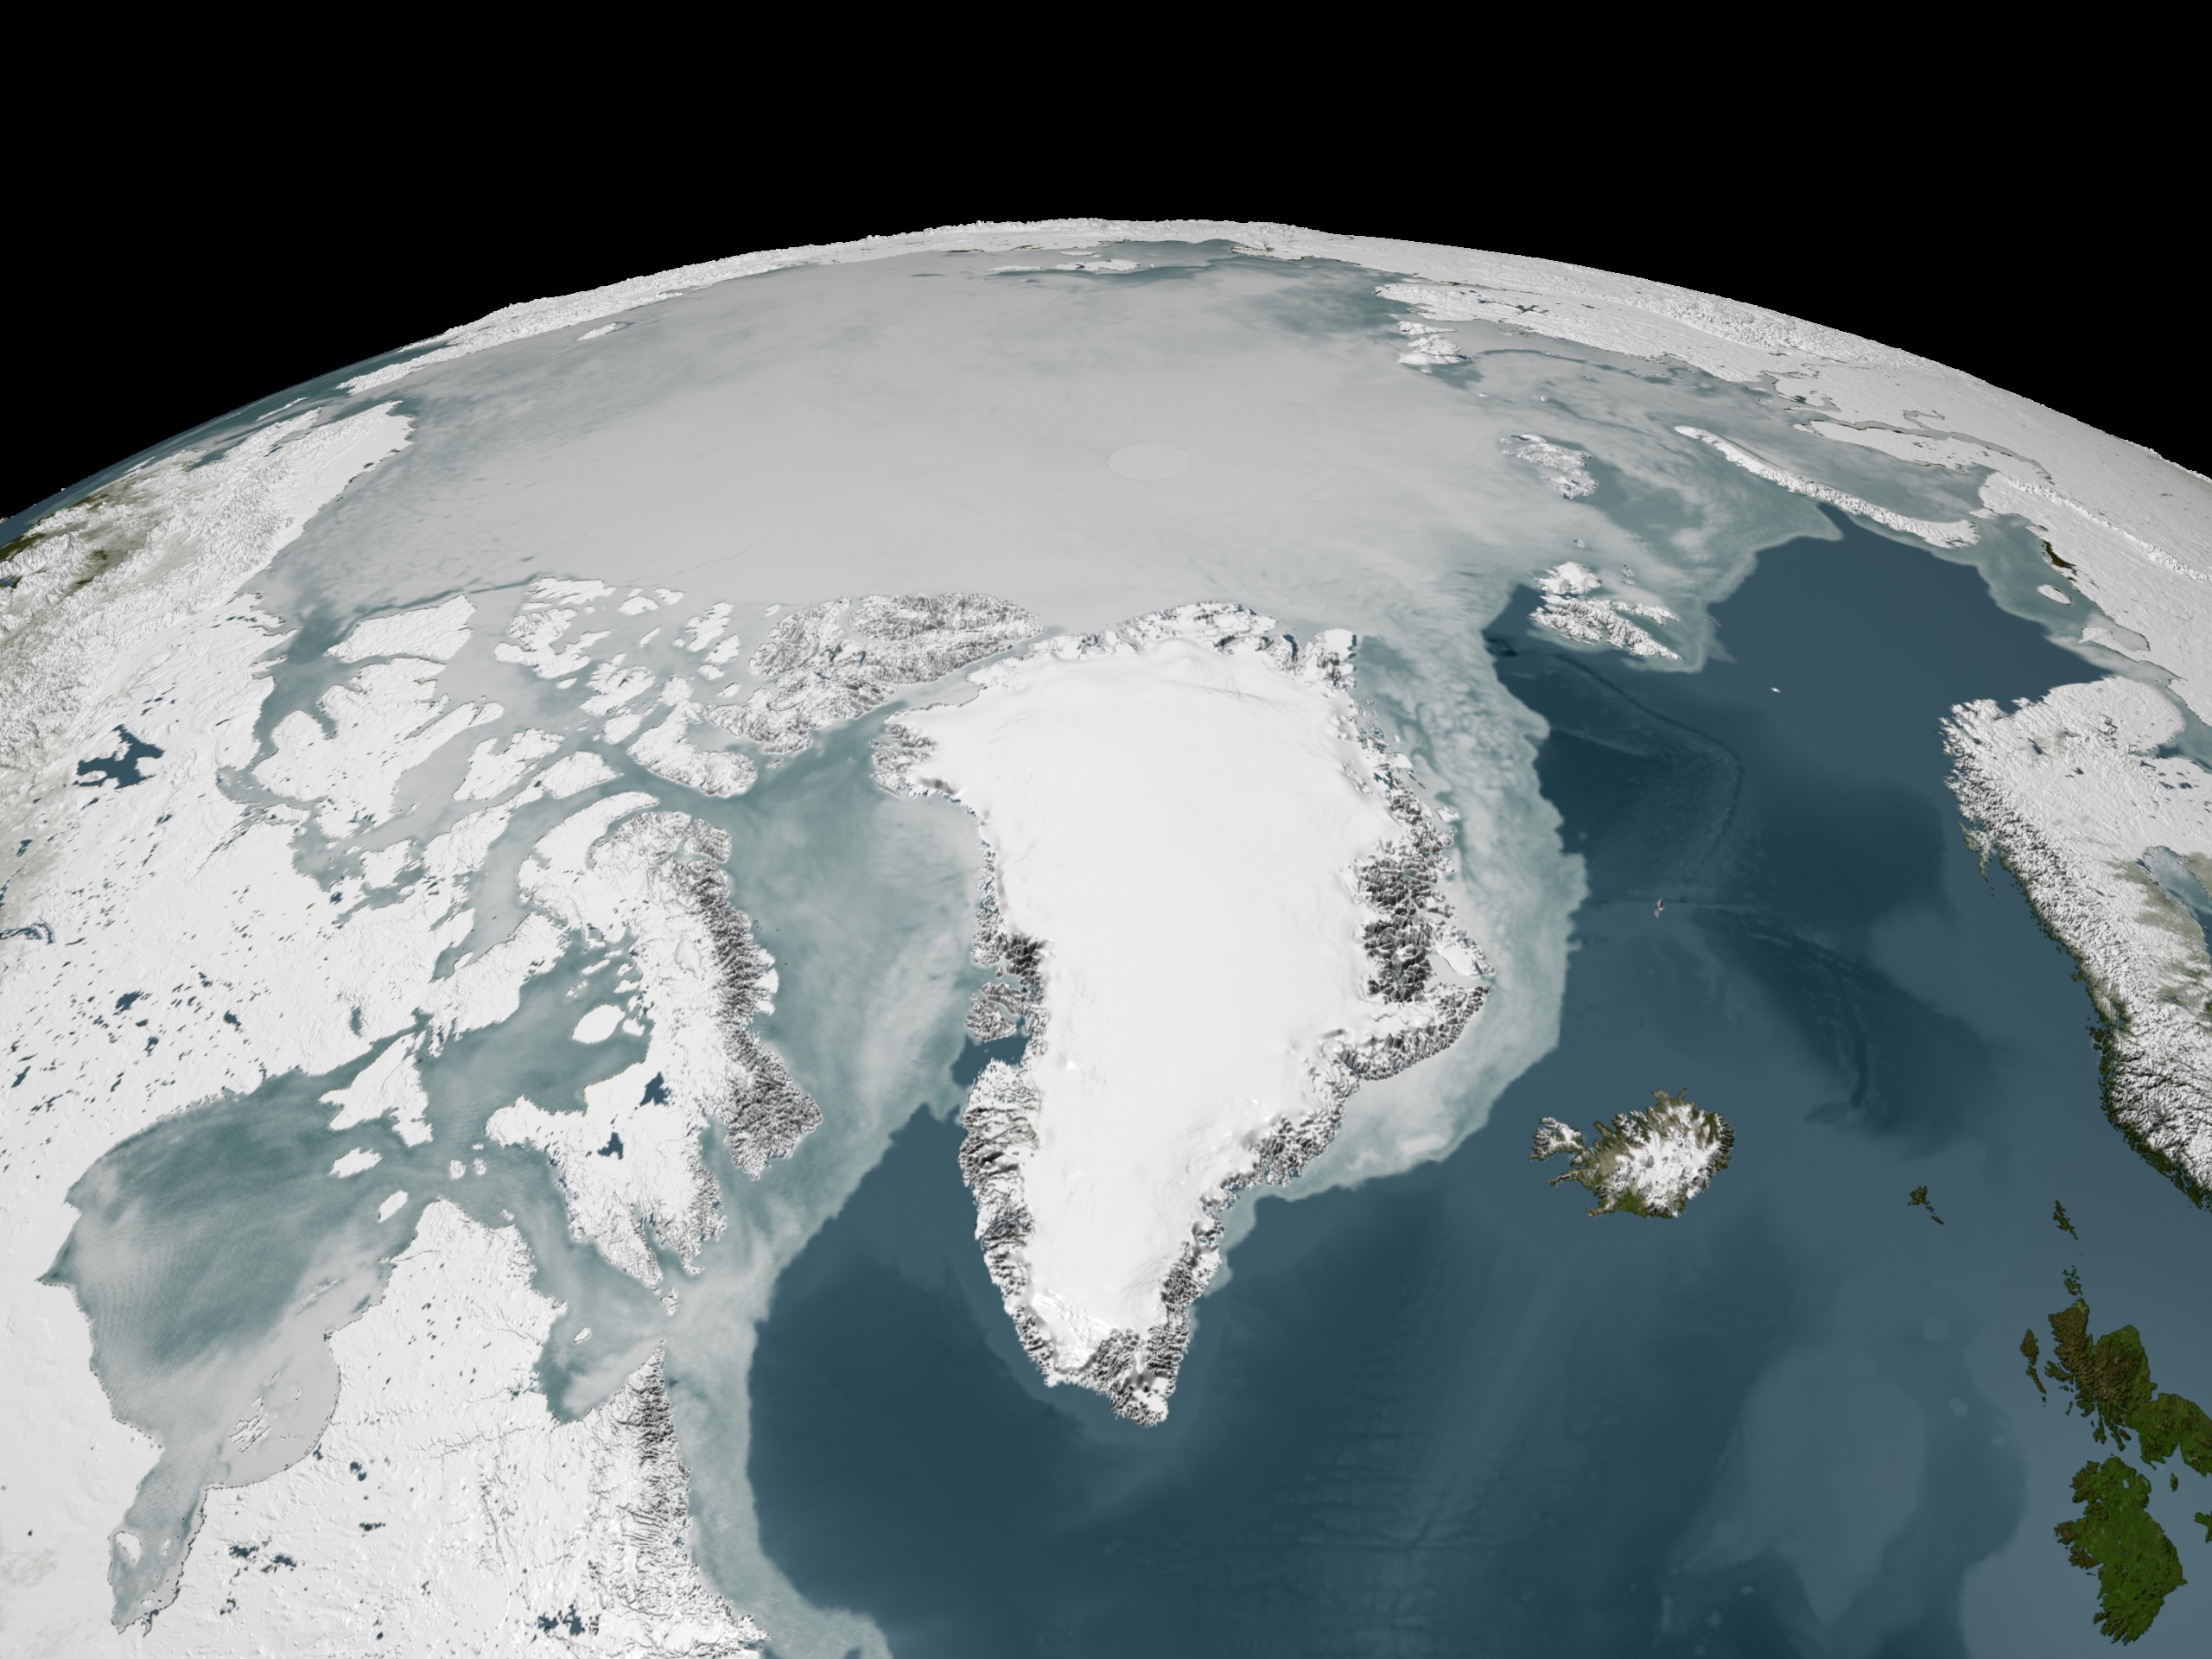
2005 Sea Ice over the Arctic derived from AMSR-E
Related
Visualization Credits
Cindy Starr (Global Science and Technology, Inc.): Lead Visualizer
Waleed Abdalati (NASA/HQ): Scientist
Waleed Abdalati (NASA/HQ): Scientist
Please give credit for this item to:
NASA/Goddard Space Flight Center Scientific Visualization Studio
NASA/Goddard Space Flight Center Scientific Visualization Studio
Short URL to share this page:
https://svs.gsfc.nasa.gov/3333
Data Used:
Note: While we identify the data sets used in these visualizations, we do not store any further details nor the data sets themselves on our site.
Keywords:
DLESE >> Cryology
GCMD >> Earth Science >> Cryosphere >> Sea Ice >> Ice Temperature
GCMD >> Earth Science >> Cryosphere >> Sea Ice >> Sea Ice Concentration
NASA Science >> Earth
GCMD keywords can be found on the Internet with the following citation: Olsen, L.M., G. Major, K. Shein, J. Scialdone, S. Ritz, T. Stevens, M. Morahan, A. Aleman, R. Vogel, S. Leicester, H. Weir, M. Meaux, S. Grebas, C.Solomon, M. Holland, T. Northcutt, R. A. Restrepo, R. Bilodeau, 2013. NASA/Global Change Master Directory (GCMD) Earth Science Keywords. Version 8.0.0.0.0
https://svs.gsfc.nasa.gov/3333
Data Used:
Aqua/AMSR-E/Daily L3 6.25 km 89 GHz Brightness Temperature (Tb)
1/1/2005 through 12/31/2005Aqua/AMSR-E/Daily L3 12.5km Tb, Sea Ice Concentration, and Snow Depth also referred to as: Sea Ice Concentration
1/1/2005 through 12/31/2005Keywords:
DLESE >> Cryology
GCMD >> Earth Science >> Cryosphere >> Sea Ice >> Ice Temperature
GCMD >> Earth Science >> Cryosphere >> Sea Ice >> Sea Ice Concentration
NASA Science >> Earth
GCMD keywords can be found on the Internet with the following citation: Olsen, L.M., G. Major, K. Shein, J. Scialdone, S. Ritz, T. Stevens, M. Morahan, A. Aleman, R. Vogel, S. Leicester, H. Weir, M. Meaux, S. Grebas, C.Solomon, M. Holland, T. Northcutt, R. A. Restrepo, R. Bilodeau, 2013. NASA/Global Change Master Directory (GCMD) Earth Science Keywords. Version 8.0.0.0.0


