A newer version of this visualization is available.
AMSR2 2018 Minimum Arctic Sea Ice Extent
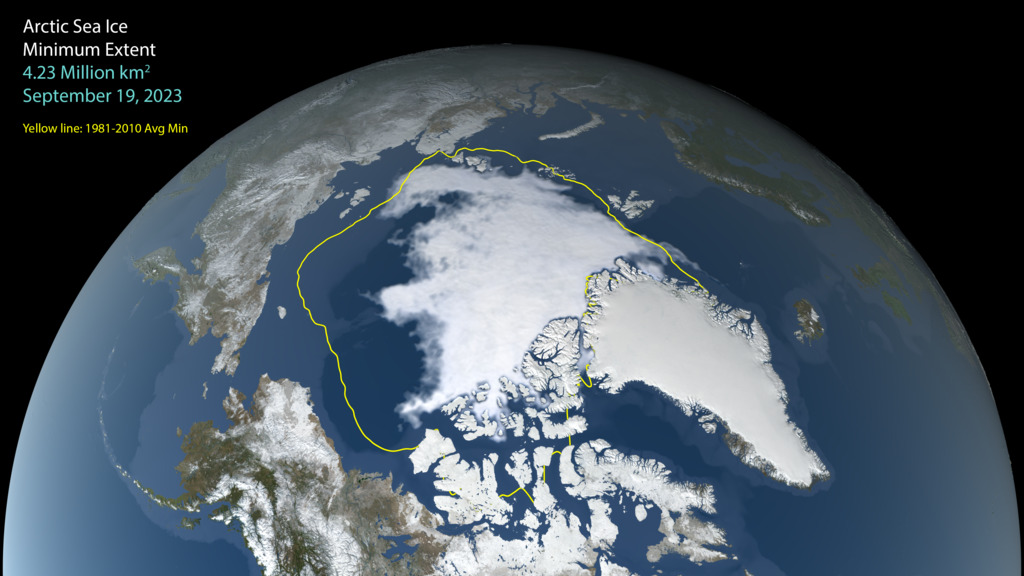
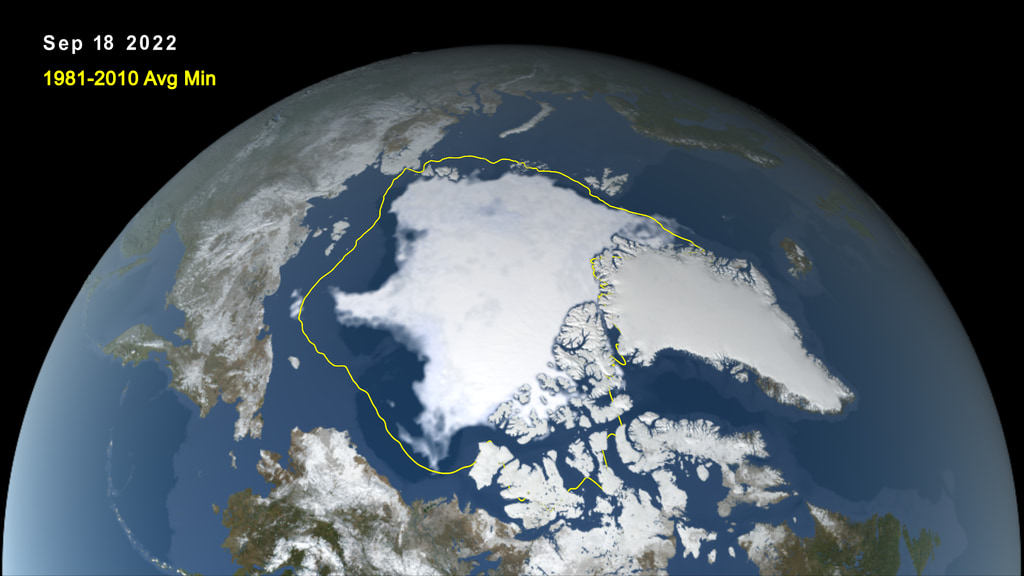
Animation of Maximum to Minimum Arctic Sea Ice Extent, 2018, with 30-Year Average
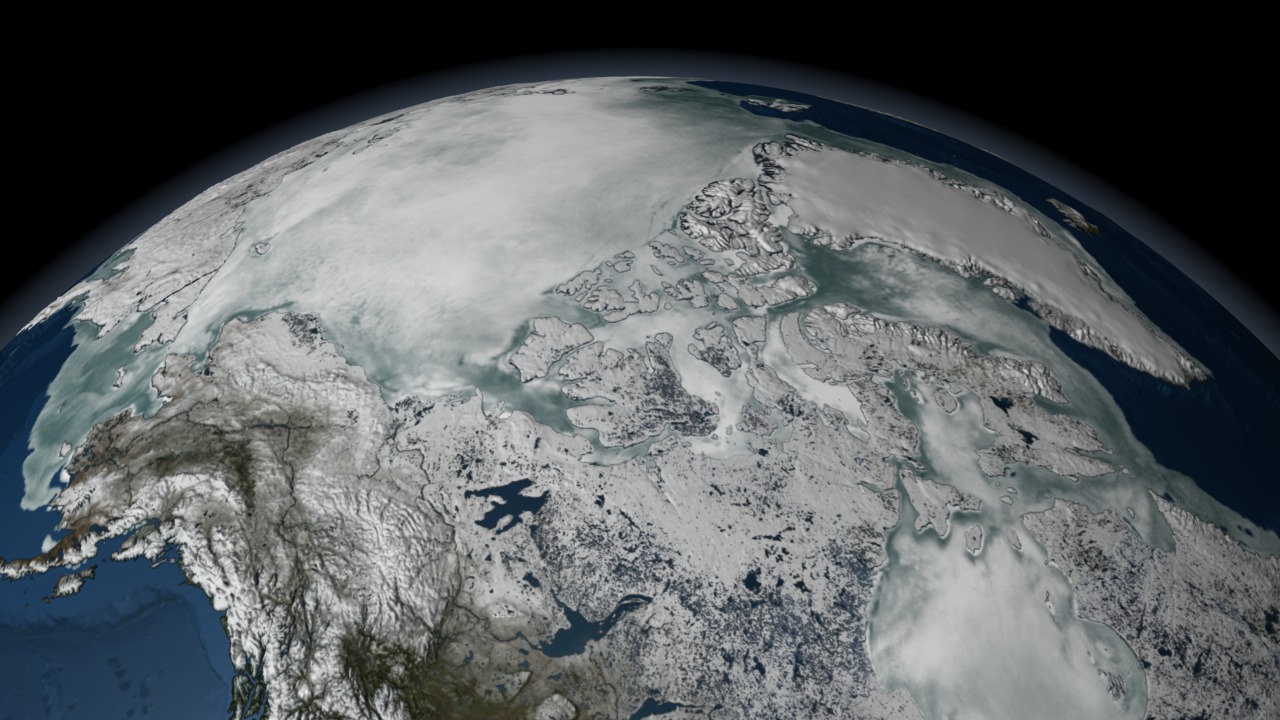
The Japan Aerospace Exploration Agency (JAXA) provides many water-related products derived from data acquired by the Advanced Microwave Scanning Radiometer 2 (AMSR2) instrument aboard the Global Change Observation Mission 1st-Water "SHIZUKU" (GCOM-W1) satellite. Two JAXA datasets used in this animation are the 10-km daily sea ice concentration and the 10 km daily 89 GHz Brightness Temperature.
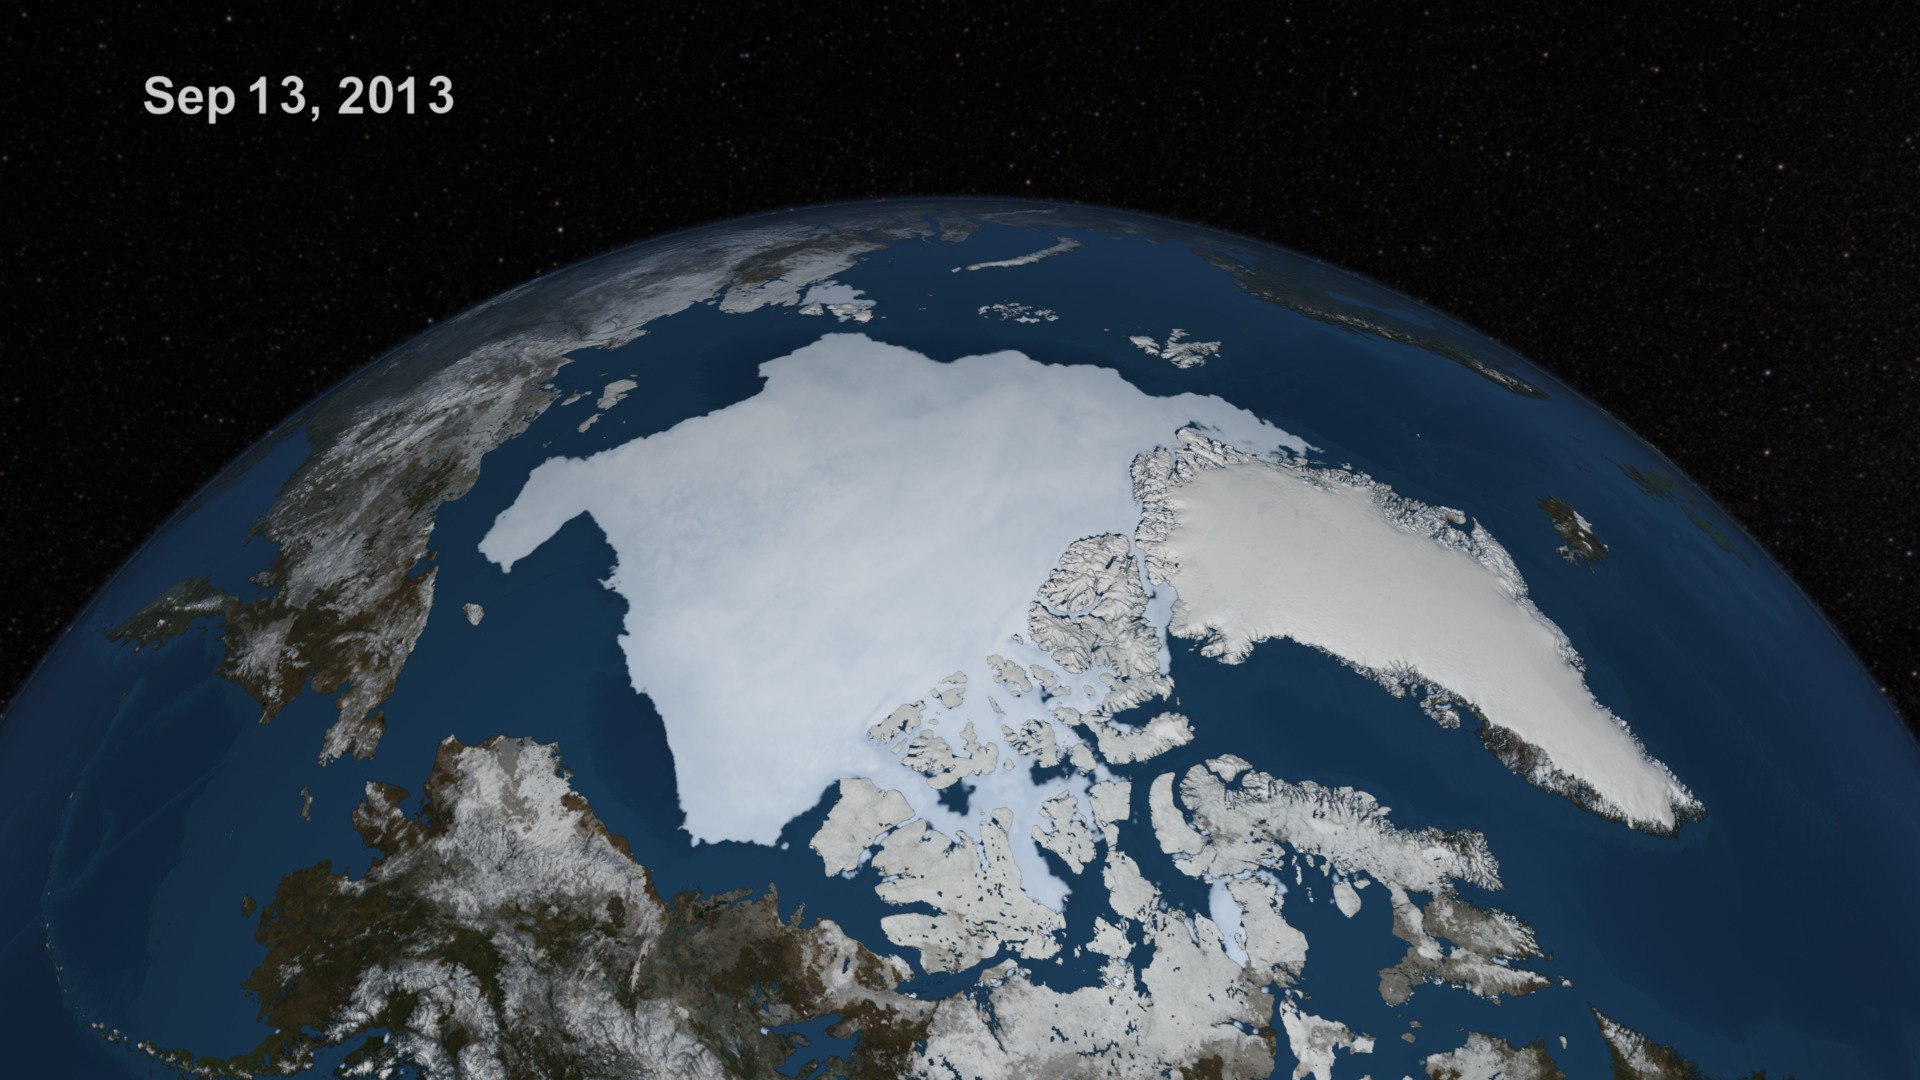
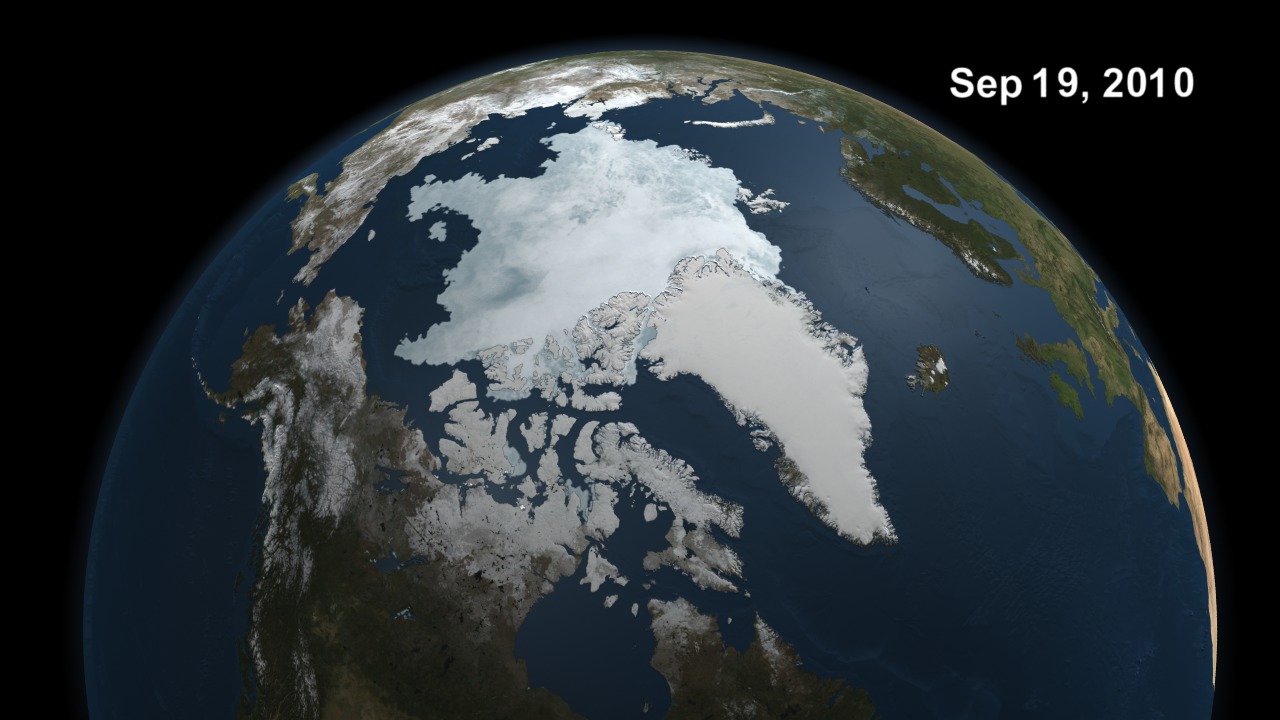
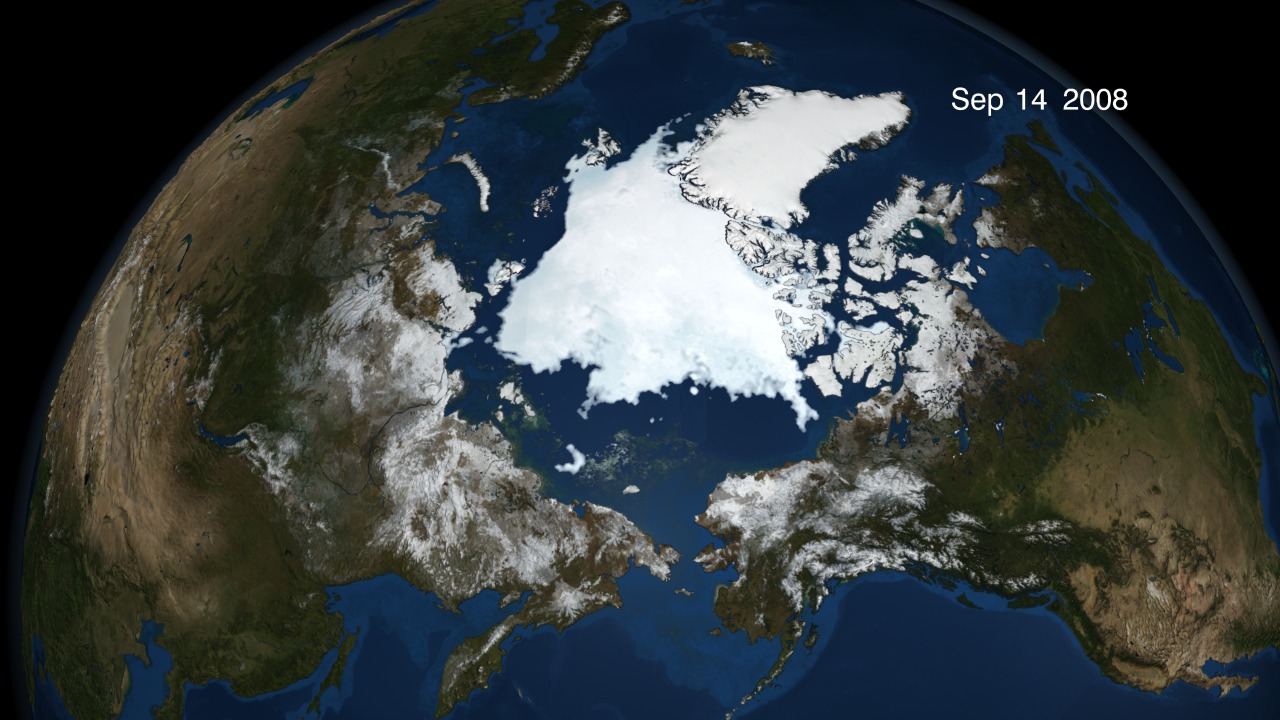
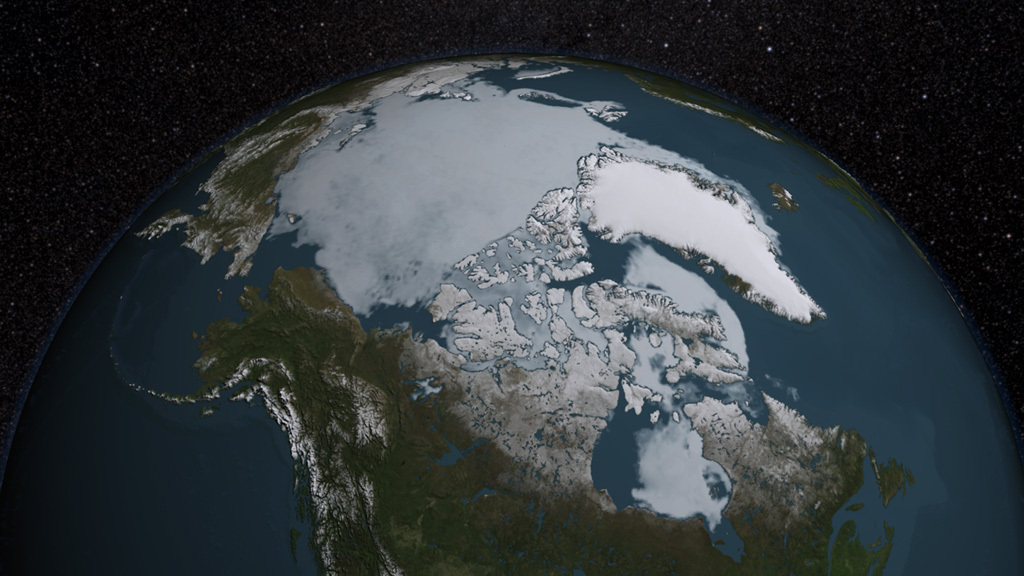
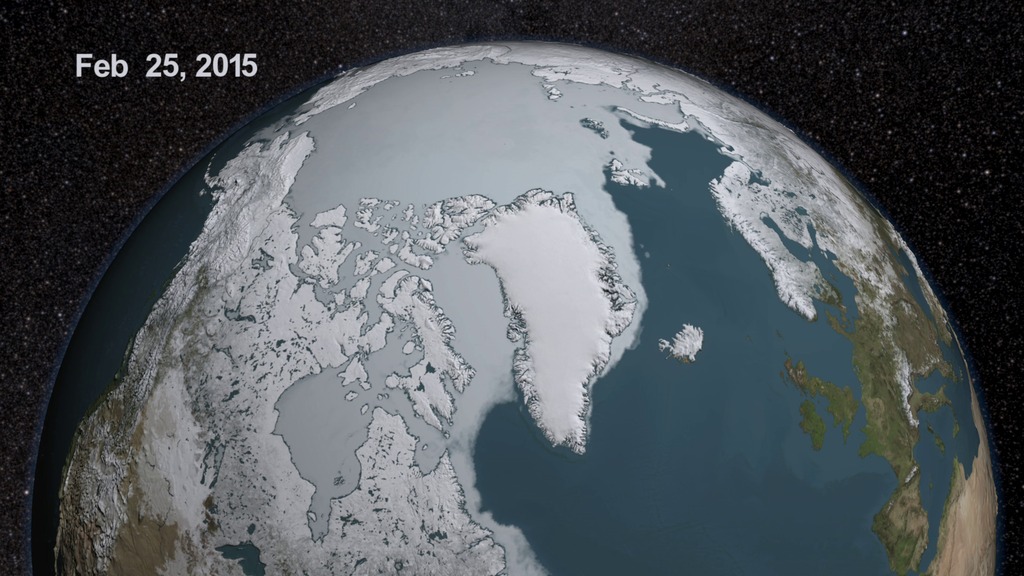
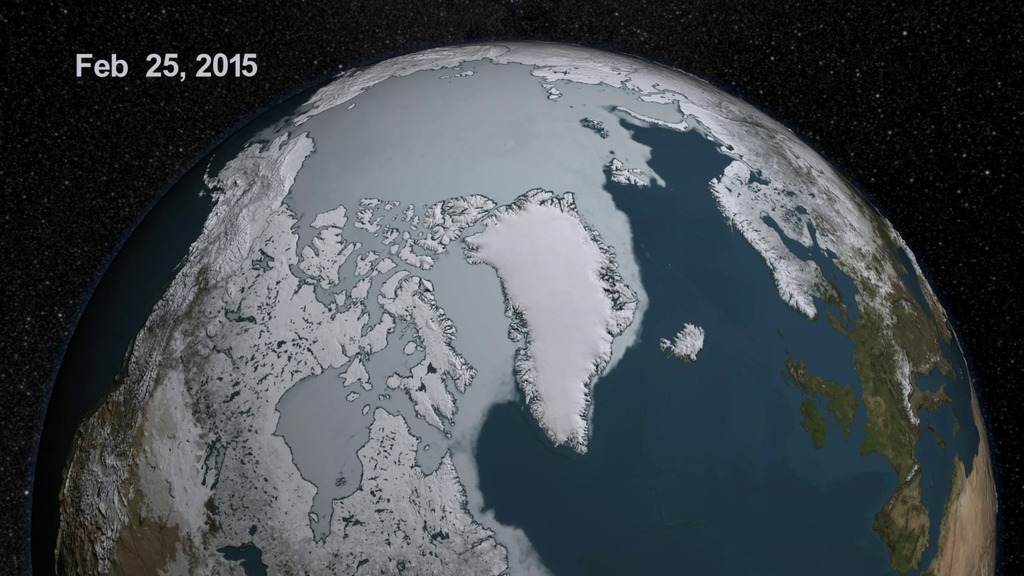
In this animation, the daily Arctic sea ice and seasonal land cover change progress through time, from March 17, 2018 through September 23, 2018, when the ice reaches its annual minimum extent. Over the water, Arctic sea ice changes from day to day showing a running 3-day minimum sea ice concentration in the region where the concentration is greater than 15%. The blueish white colour of the sea ice is derived from a 3-day running minimum of the AMSR2 89 GHz brightness temperature. Over the land, monthly data from the seasonal Blue Marble Next Generation fades slowly from month to month.
Animation of Maximum to Minimum Sea Ice Extent, 2018
Animation of Maximum to Minimum Sea Ice Extent, 2018, No Dates

Dates Only
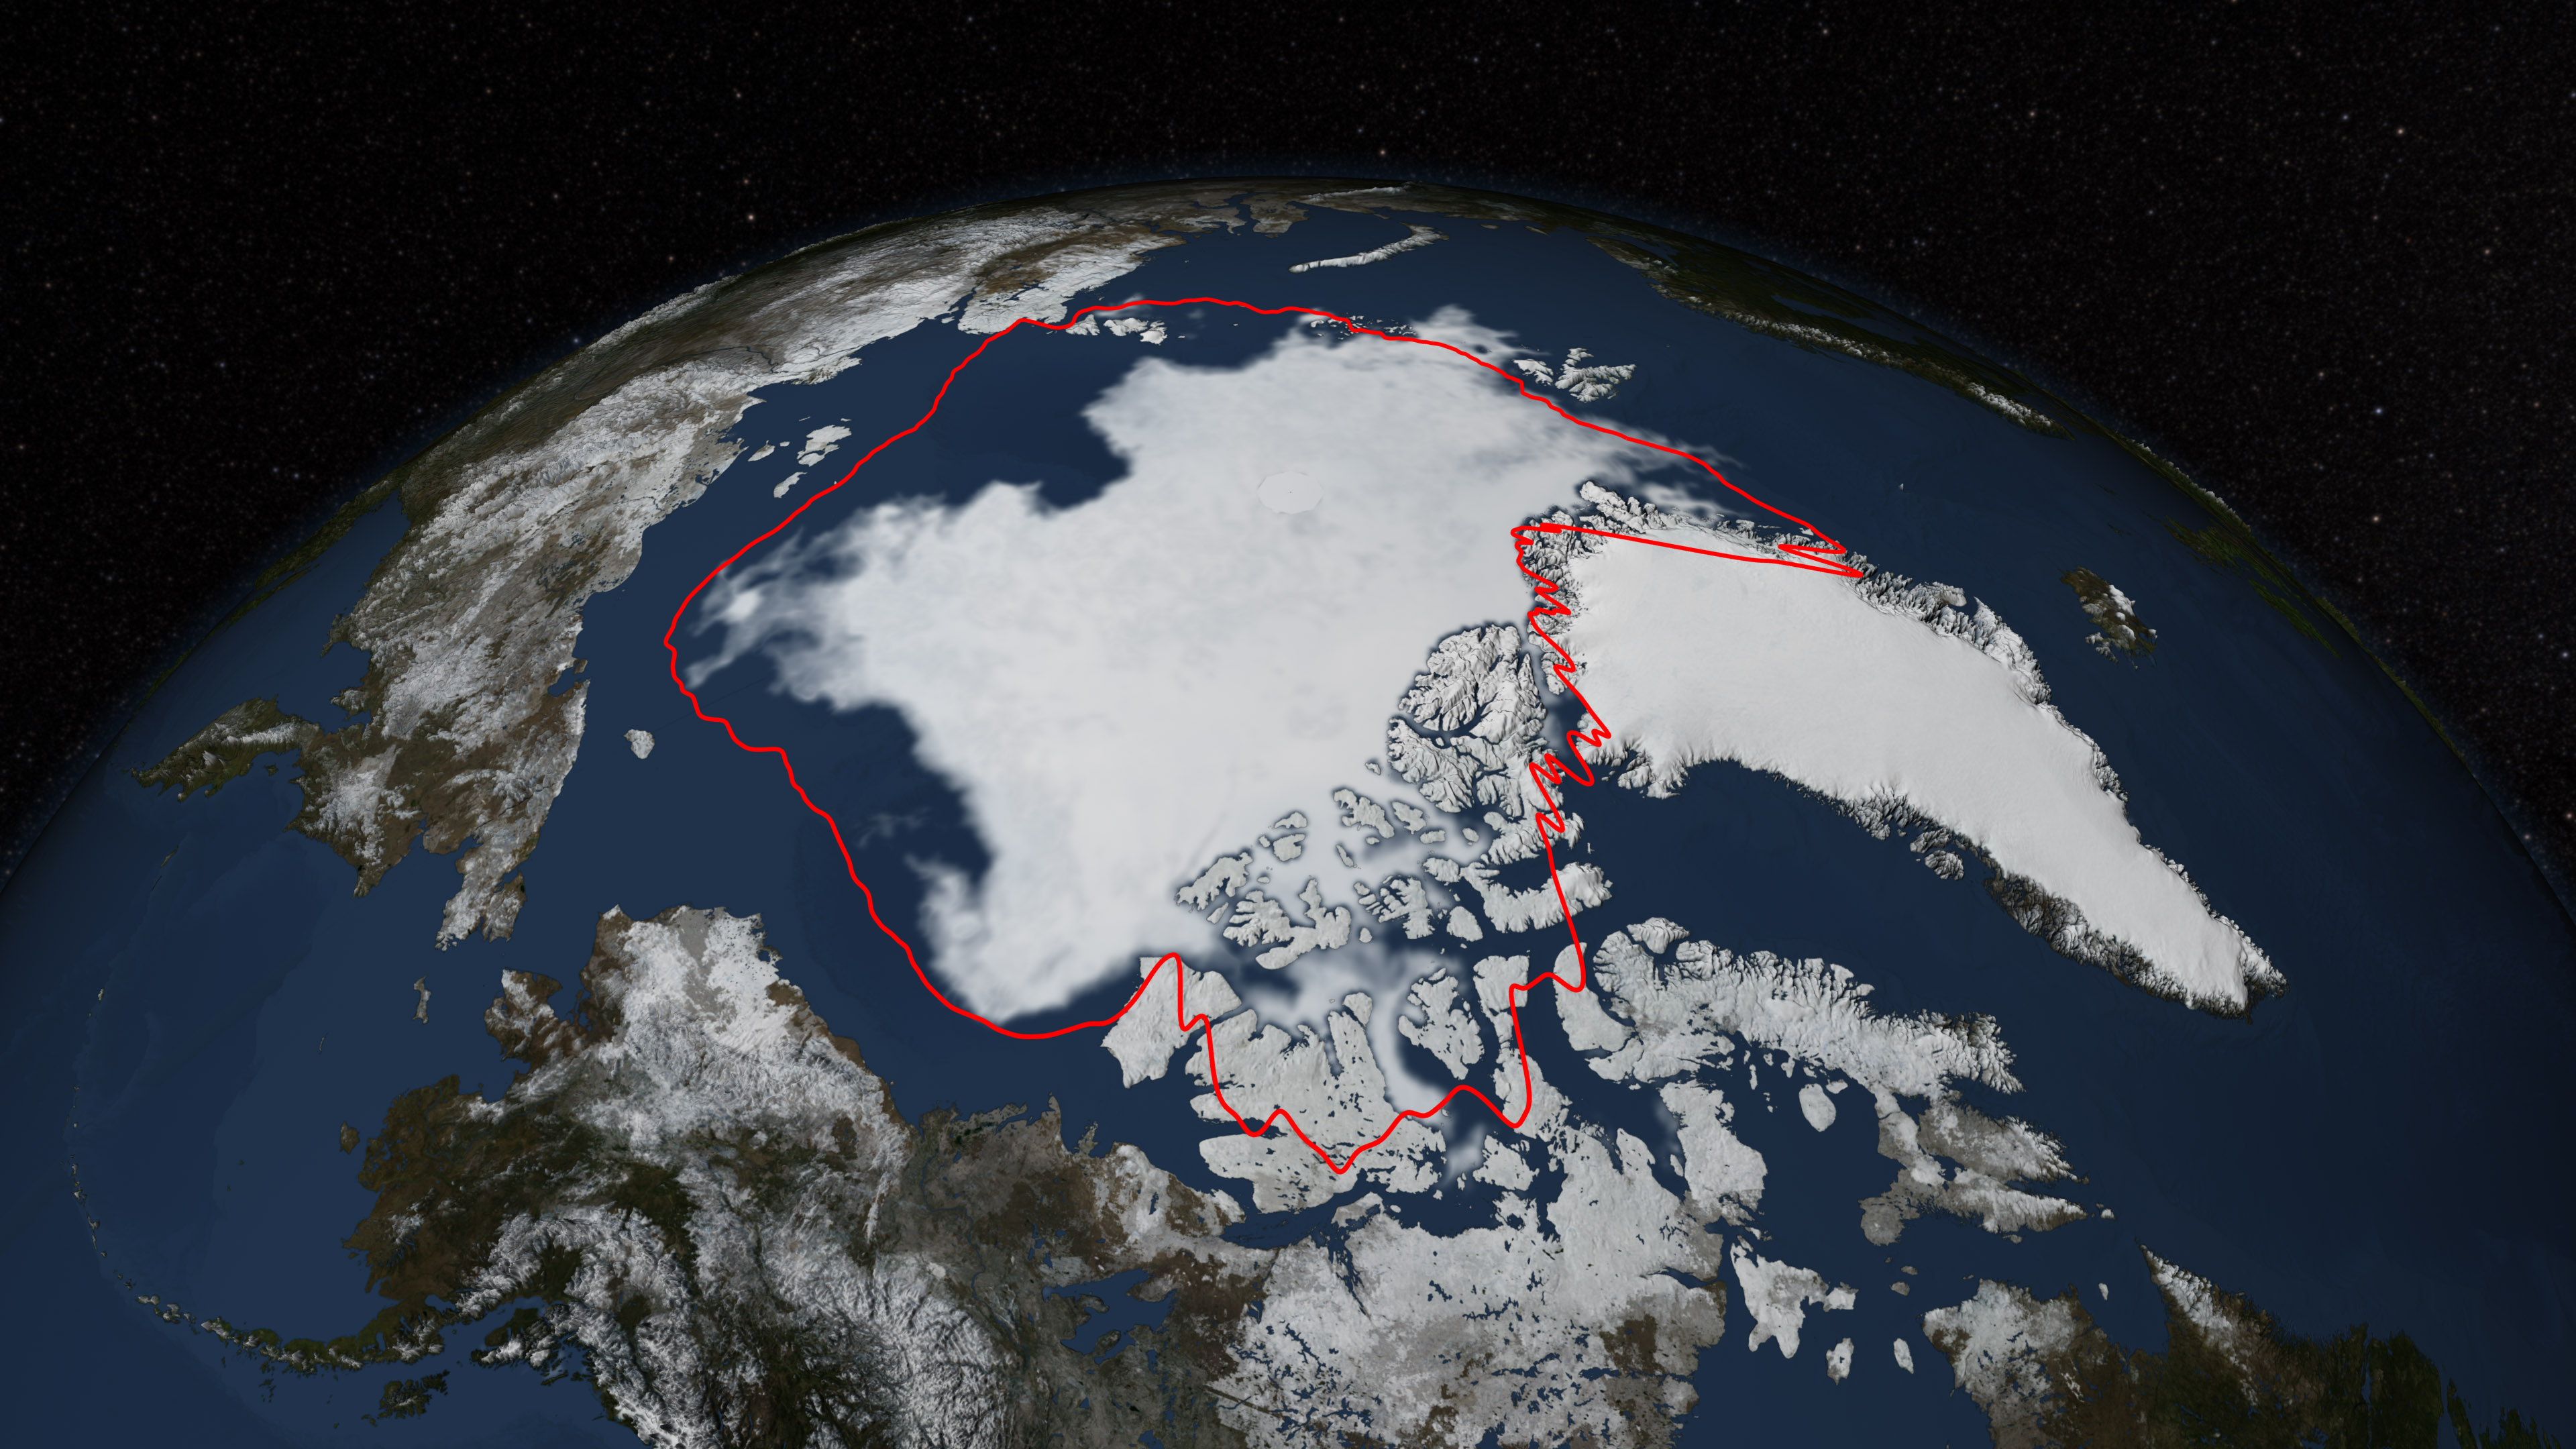
Print-Resolution Still Image of 2018 Arctic Sea Ice Minimum Extent, With 30-Year Average
Print-Resolution Still Image of 2018 Arctic Sea Ice Minimum
Print-Resolution Still Image of 2018 Arctic Sea Ice Minimum Extent, With 30-Year Average, No Labels
Print-Resolution Still Image of 2018 Arctic Sea Ice Minimum, No Labels
Credits
Please give credit for this item to:
NASA's Scientific Visualization Studio
-
Visualizers
- Trent L. Schindler (USRA)
-
Cindy Starr
(Global Science and Technology, Inc.)

-
Helen-Nicole Kostis
(USRA)
-
Producer
- Kathryn Mersmann (USRA)
-
Sr. data analyst
- Robert Gersten (RSIS)
-
Project support
- Laurence Schuler (ADNET Systems, Inc.)
- Ian Jones (ADNET Systems, Inc.)
Missions
This page is related to the following missions:Datasets used
-
BMNG (Blue Marble: Next Generation) [Terra and Aqua: MODIS]
ID: 508Credit: The Blue Marble data is courtesy of Reto Stockli (NASA/GSFC).
This dataset can be found at: http://earthobservatory.nasa.gov/Newsroom/BlueMarble/
See all pages that use this dataset -
10 km Daily Sea Ice Concentration [SHIZUKU (GCOM-W1): AMSR2]
ID: 795Credit: AMSR2 data courtesy of the Japan Aerospace Exploration Agency (JAXA).
See all pages that use this dataset -
10 km Daily 89 GHz Brightness Temperature [SHIZUKU (GCOM-W1): AMSR2]
ID: 796Credit: AMSR2 data courtesy of the Japan Aerospace Exploration Agency (JAXA).
See all pages that use this dataset
Note: While we identify the data sets used on this page, we do not store any further details, nor the data sets themselves on our site.
Related
- ID: 3372
- ID: 3368
 Visualization
 - ID: 3333
 Visualization
Newer Versions
- ID: 5162
 Visualization
 - ID: 5030
 Visualization
Older Versions
- ID: 4215
 Visualization
 - ID: 4104
- ID: 3767
 Visualization
 - ID: 3631
 Visualization
 - ID: 3556
 Visualization
 - ID: 3561
 Visualization
 - ID: 3466
- ID: 3456
Used as a Source In
- ID: 11932
 Produced Video
 - ID: 12001
 Produced Video
 - ID: 11999
 Produced Video
Release date
This page was originally published on Thursday, September 27, 2018.
This page was last updated on Wednesday, May 3, 2023 at 1:46 PM EDT.