A newer version of this visualization is available.
Arctic Sea Ice Maximum - 2016
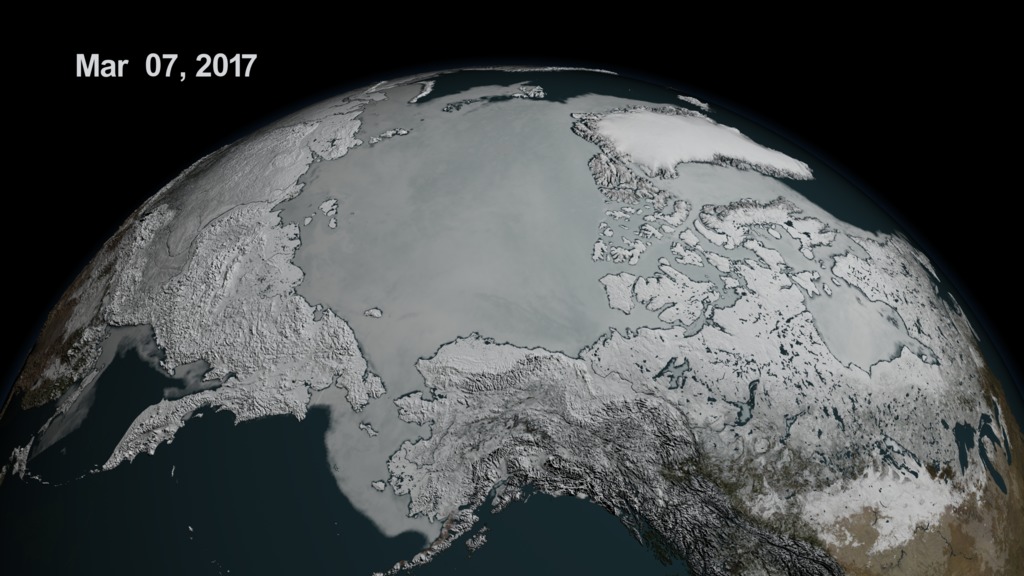
An animation of the Arctic sea ice from September 7th, 2015 through March 24th, 2016 with dates
This video is also available on our YouTube channel.
The maximum Arctic sea ice extent appears to have occurred on March 24, 2016, reaching an extent of 14.52 million square kilometers (5.607 million square miles). This is below the previous lowest maximum recorded in 2015 when it reached 14.54 million square kilometers (5.612 million square miles). Overall, there is a declining trend in the maximum extent of about 2.8 % per decade. This is much smaller than the summer trends, but also reflects the long-term warming trend in the Arctic.
While a low maximum gives the extent a head start heading into summer, it turns out that there is not much relation between the maximum and summer minimum and a record low maximum does not portend a record low minimum. This is because the ice near the edge at the time of the maximum is thin, seasonal ice that will melt out early in the summer. The weather conditions in the Arctic during the summer melt season is the most crucial in determining whether a record low is possible in any given year.
In this animation, the Arctic sea ice area is derived from a running 3-day maximum of the AMSR2 sea ice concentration where the concentration is greater than 15%. The blueish white color of the sea ice is derived from a 3-day running minimum of the AMSR2 89 GHz brightness temperature that is linearly mapped between the high and low values.
An animation of the Arctic sea ice from September 7th, 2015 through March 24th, 2016 without dates

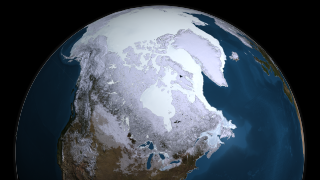
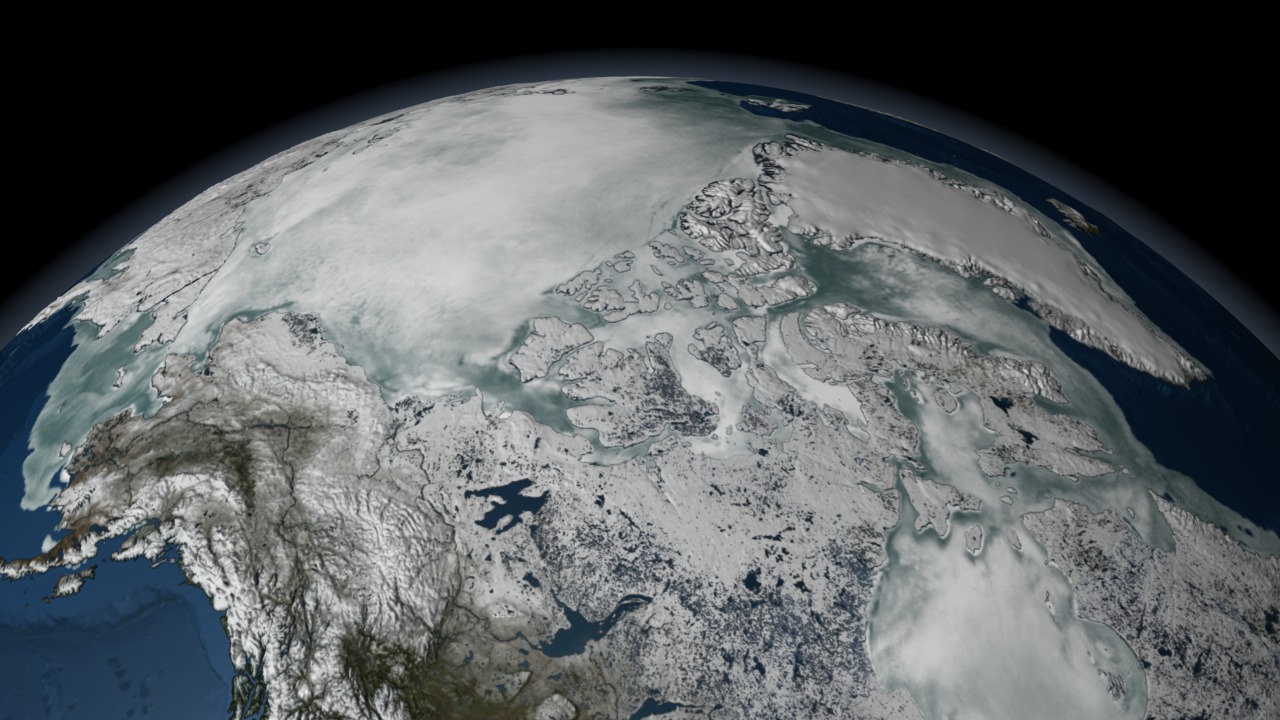
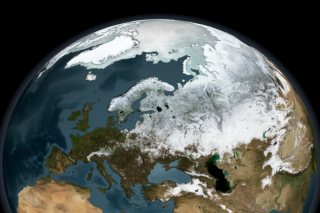
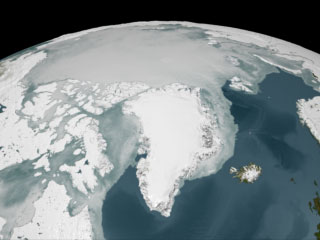
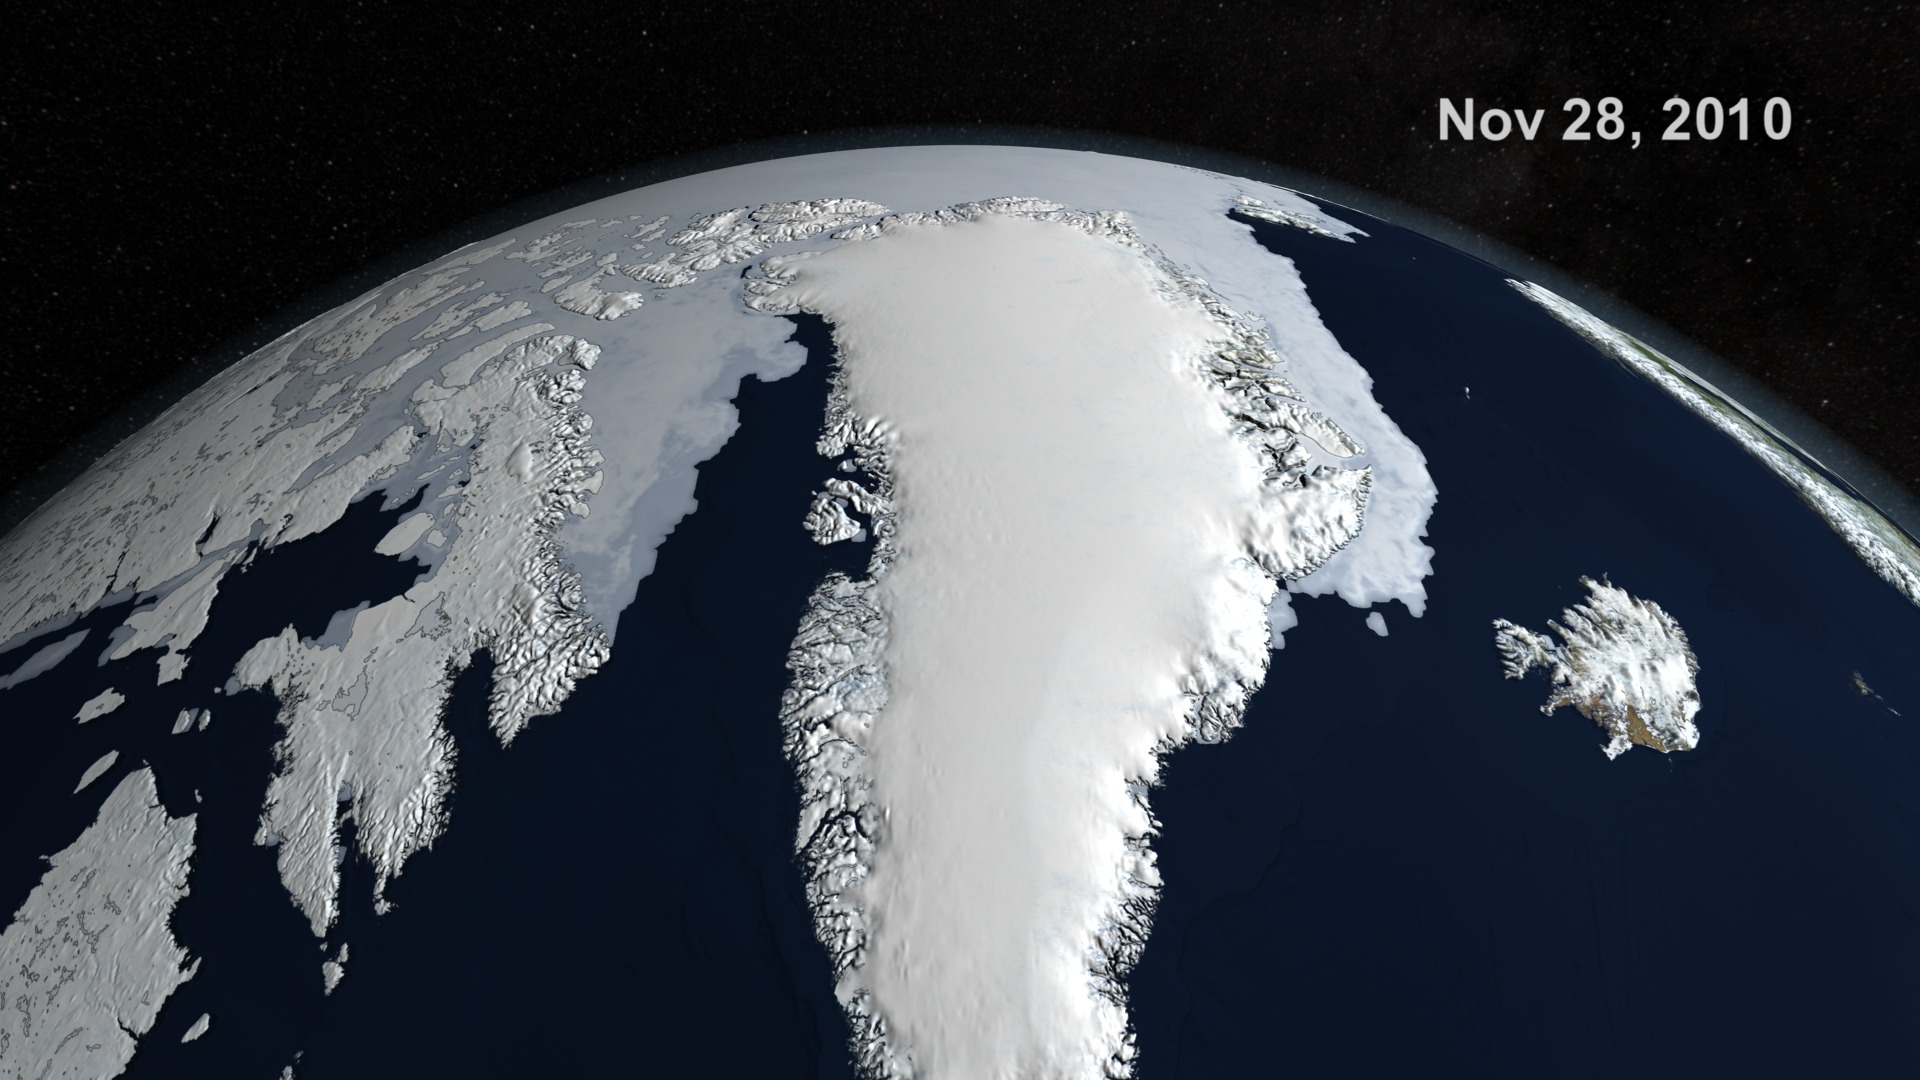
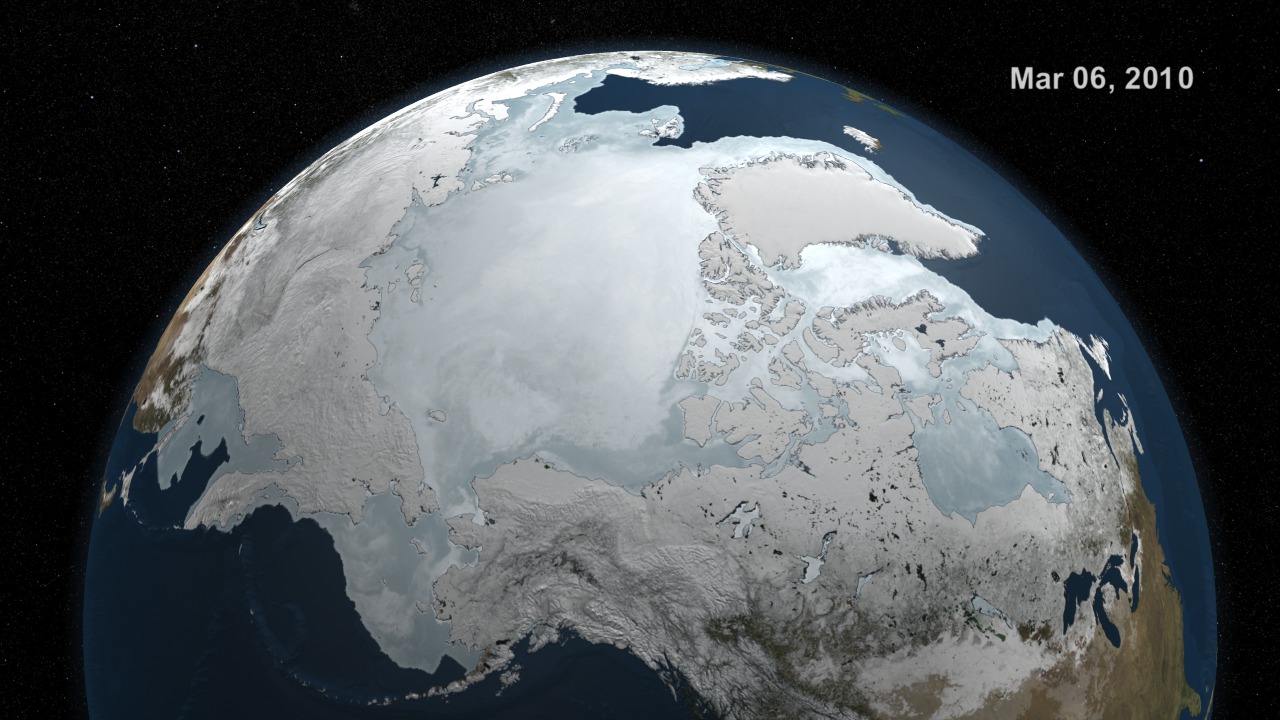
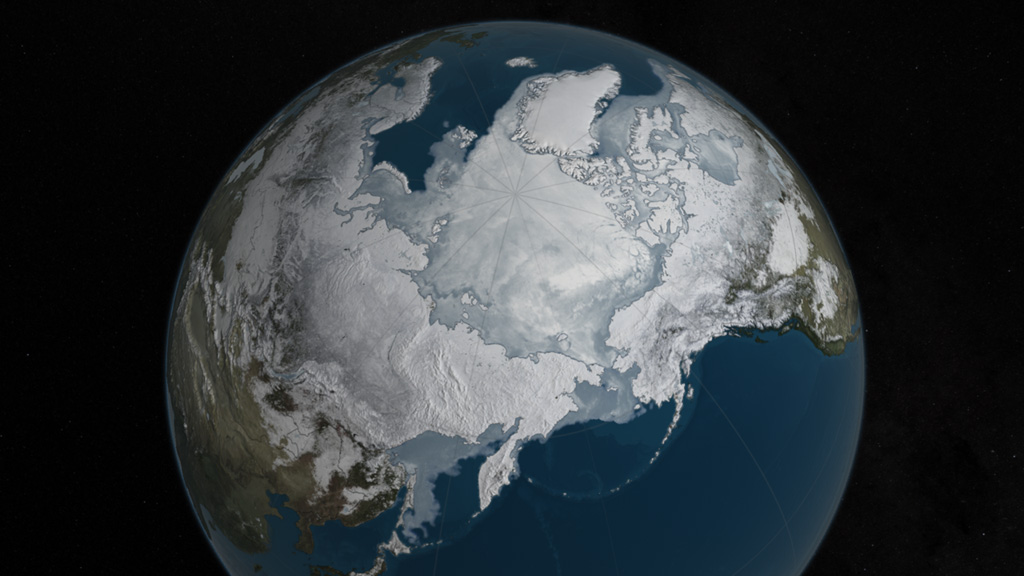
An image of the Arctic sea ice on March 24, 2016.
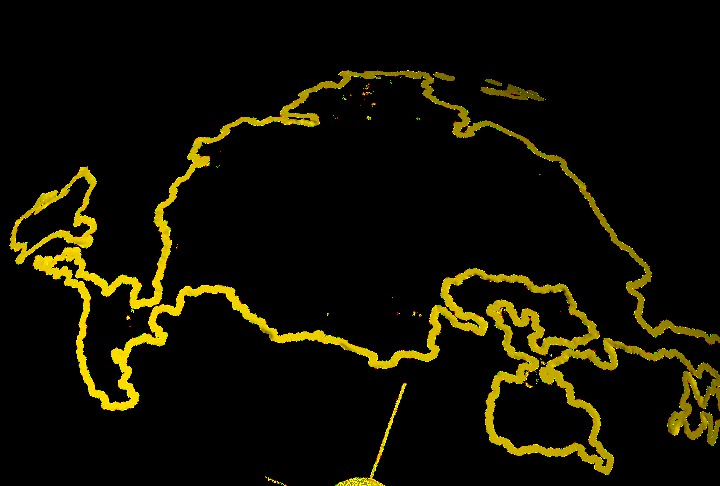
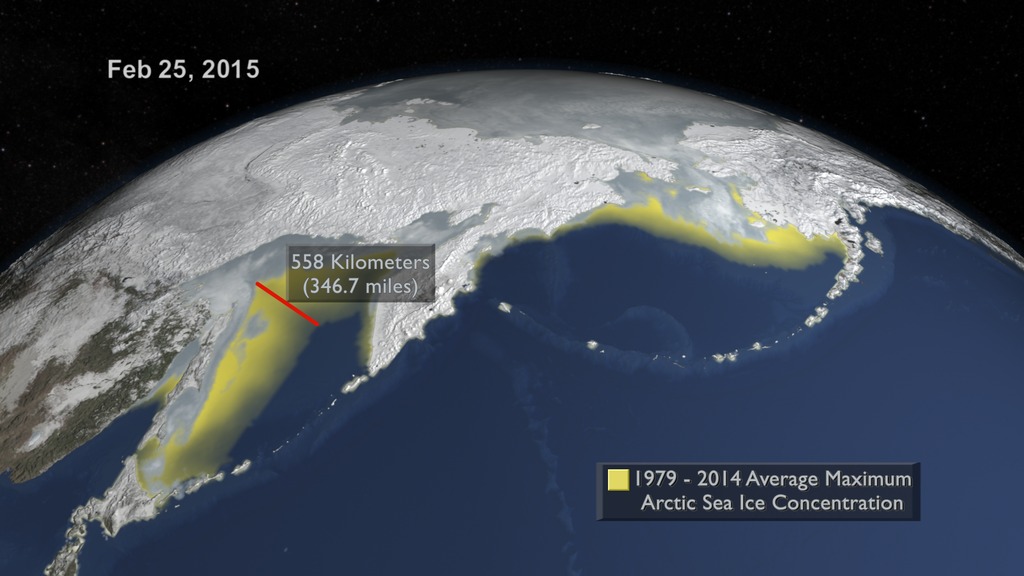
An image of the Arctic sea ice on March 24, 2016 with an orange line showing the 30-year average sea ice extent for the month of March.
An image of the Arctic sea ice on March 24, 2016.
The 30-year average sea ice extent line for the month of March with transparency matching the above view

The date overlay with transparency
Credits
Please give credit for this item to:
NASA's Scientific Visualization Studio
-
Visualizer
-
Cindy Starr
(Global Science and Technology, Inc.)

-
Cindy Starr
(Global Science and Technology, Inc.)
-
Scientists
- Walt Meier (NASA/GSFC)
- Josefino Comiso (NASA/GSFC)
-
Sr. data analyst
- Robert Gersten (Wyle Information Systems)
-
Producers
- Jefferson Beck (USRA)
- Maria-Jose Vinas Garcia (Telophase)
- Michelle Handleman (USRA)
Datasets used
-
BMNG (Blue Marble: Next Generation) [Terra and Aqua: MODIS]
ID: 508Credit: The Blue Marble data is courtesy of Reto Stockli (NASA/GSFC).
This dataset can be found at: http://earthobservatory.nasa.gov/Newsroom/BlueMarble/
See all pages that use this dataset -
10 km Daily Sea Ice Concentration [SHIZUKU (GCOM-W1): AMSR2]
ID: 795Credit: AMSR2 data courtesy of the Japan Aerospace Exploration Agency (JAXA).
See all pages that use this dataset -
10 km Daily 89 GHz Brightness Temperature [SHIZUKU (GCOM-W1): AMSR2]
ID: 796Credit: AMSR2 data courtesy of the Japan Aerospace Exploration Agency (JAXA).
See all pages that use this dataset -
Monthly Sea Ice Index
ID: 918
Note: While we identify the data sets used on this page, we do not store any further details, nor the data sets themselves on our site.
Related
- ID: 3498
- ID: 3372
- ID: 3368
 Visualization
 - ID: 3370
 Visualization
 - ID: 3333
 Visualization
Newer Versions
- ID: 4564
Older Versions
- ID: 4281
 Visualization
 - ID: 3824
 Visualization
 - ID: 3698
 Visualization
Used as a Source In
- ID: 12192
 Produced Video
 - ID: 12178
 Produced Video
Release date
This page was originally published on Monday, March 28, 2016.
This page was last updated on Tuesday, January 7, 2025 at 12:07 AM EST.