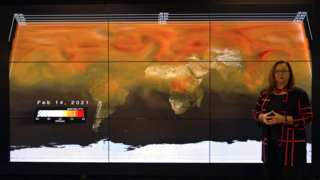
2015 El Niño Disrupts Ocean Chlorophyll
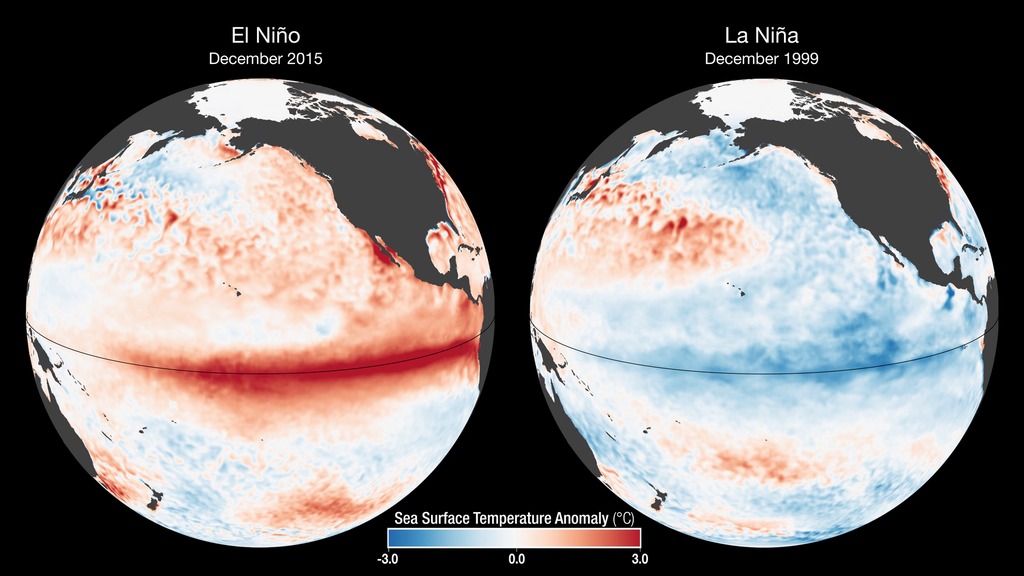
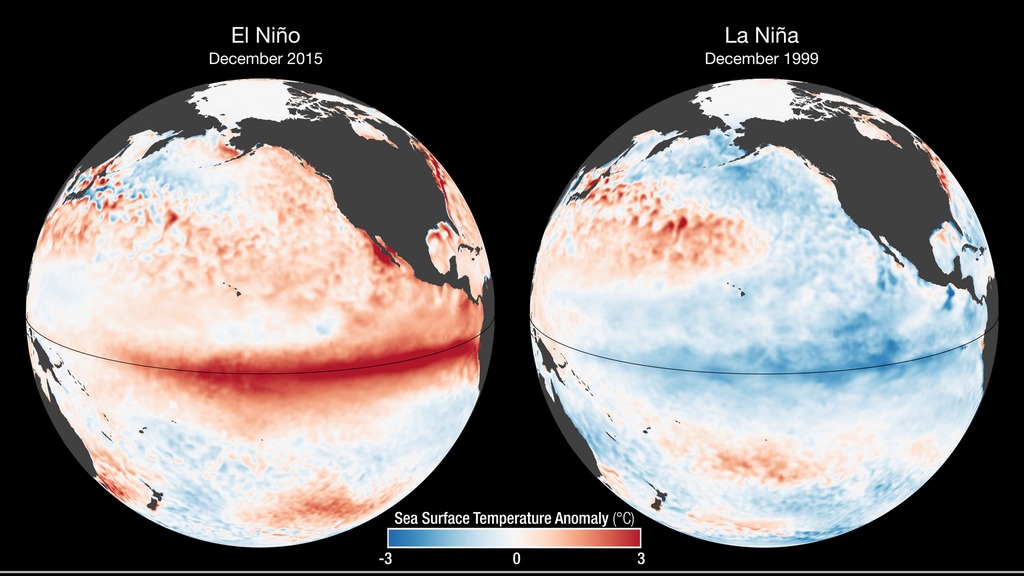
With the onset of El Niño, a drop in air pressure over the equatorial eastern Pacific causes the trade winds to weaken and sometimes even reverse, driving warm water eastward, towards South America. Below the ocean’s surface, the eastward migration of the warm pool deepens the thermocline and curtails the usual upwelling of deep-water nutrients to the surface, causing declining concentrations of surface chlorophyll, the green pigment that indicates the presence of phytoplankton. The opposite phase, La Niña, is characterized by strong trade winds, which causes upwelling to intensify. Cold, upwelled waters have more nutrients than the warmer surface waters; therefore, more intense upwelling coincides with higher chlorophyll and phytoplankton concentrations.
During the 1997-98 El Niño, there were large population declines within the eastern Pacific marine food web. However, the strong La Niña that followed in 1998–99 had the opposite impact: stronger east-to-west trade winds that increased nutrient upwelling and fertilized one of the biggest phytoplankton blooms detected in the satellite record. The bloom ignited a dramatic increase in fish populations.
Related
For More Information
Credits
Heather Hanson (GST): Writer
Stephanie Uz (GST): Scientist
Amy Moran (Global Science and Technology, Inc.): Animator
NASA/Goddard Space Flight Center, The SeaWiFS Project and GeoEye. NOTE: All SeaWiFS images and data presented on this web site are for research and educational use only. All commercial use of SeaWiFS data must be coordinated with GeoEye (NOTE: In January 2013, DigitalGlobe and GeoEye combined to become DigitalGlobe).
https://svs.gsfc.nasa.gov/30747
Mission:
Aqua
Data Used:
Aqua/MODIS
SeaStar/SeaWiFS/Chlorophyll Concentration
NASA/Goddard Space Flight Center, The SeaWiFS Project and GeoEye, Scientific Visualization Studio. NOTE: All SeaWiFS images and data presented on this web site are for research and educational use only. All commercial use of SeaWiFS data must be coordinated with GeoEye (NOTE: In January 2013, DigitalGlobe and GeoEye combined to become one DigitalGlobe.).
NOAA Optimum Interpolation Sea Surface Temperature also referred to as: OISSTv2
NOAAKeywords:
SVS >> Bloom
SVS >> El Nino
SVS >> HDTV
SVS >> Pacific
SVS >> Phytoplankton
SVS >> Sea Surface Temperature Anomaly
GCMD >> Earth Science >> Oceans >> Ocean Circulation >> Upwelling
GCMD >> Location >> Equatorial
SVS >> Hyperwall
NASA Science >> Earth
SVS >> Presentation
SVS >> Food Web
GCMD keywords can be found on the Internet with the following citation: Olsen, L.M., G. Major, K. Shein, J. Scialdone, S. Ritz, T. Stevens, M. Morahan, A. Aleman, R. Vogel, S. Leicester, H. Weir, M. Meaux, S. Grebas, C.Solomon, M. Holland, T. Northcutt, R. A. Restrepo, R. Bilodeau, 2013. NASA/Global Change Master Directory (GCMD) Earth Science Keywords. Version 8.0.0.0.0


