SDO – Solar Dynamics Observatory
Overview
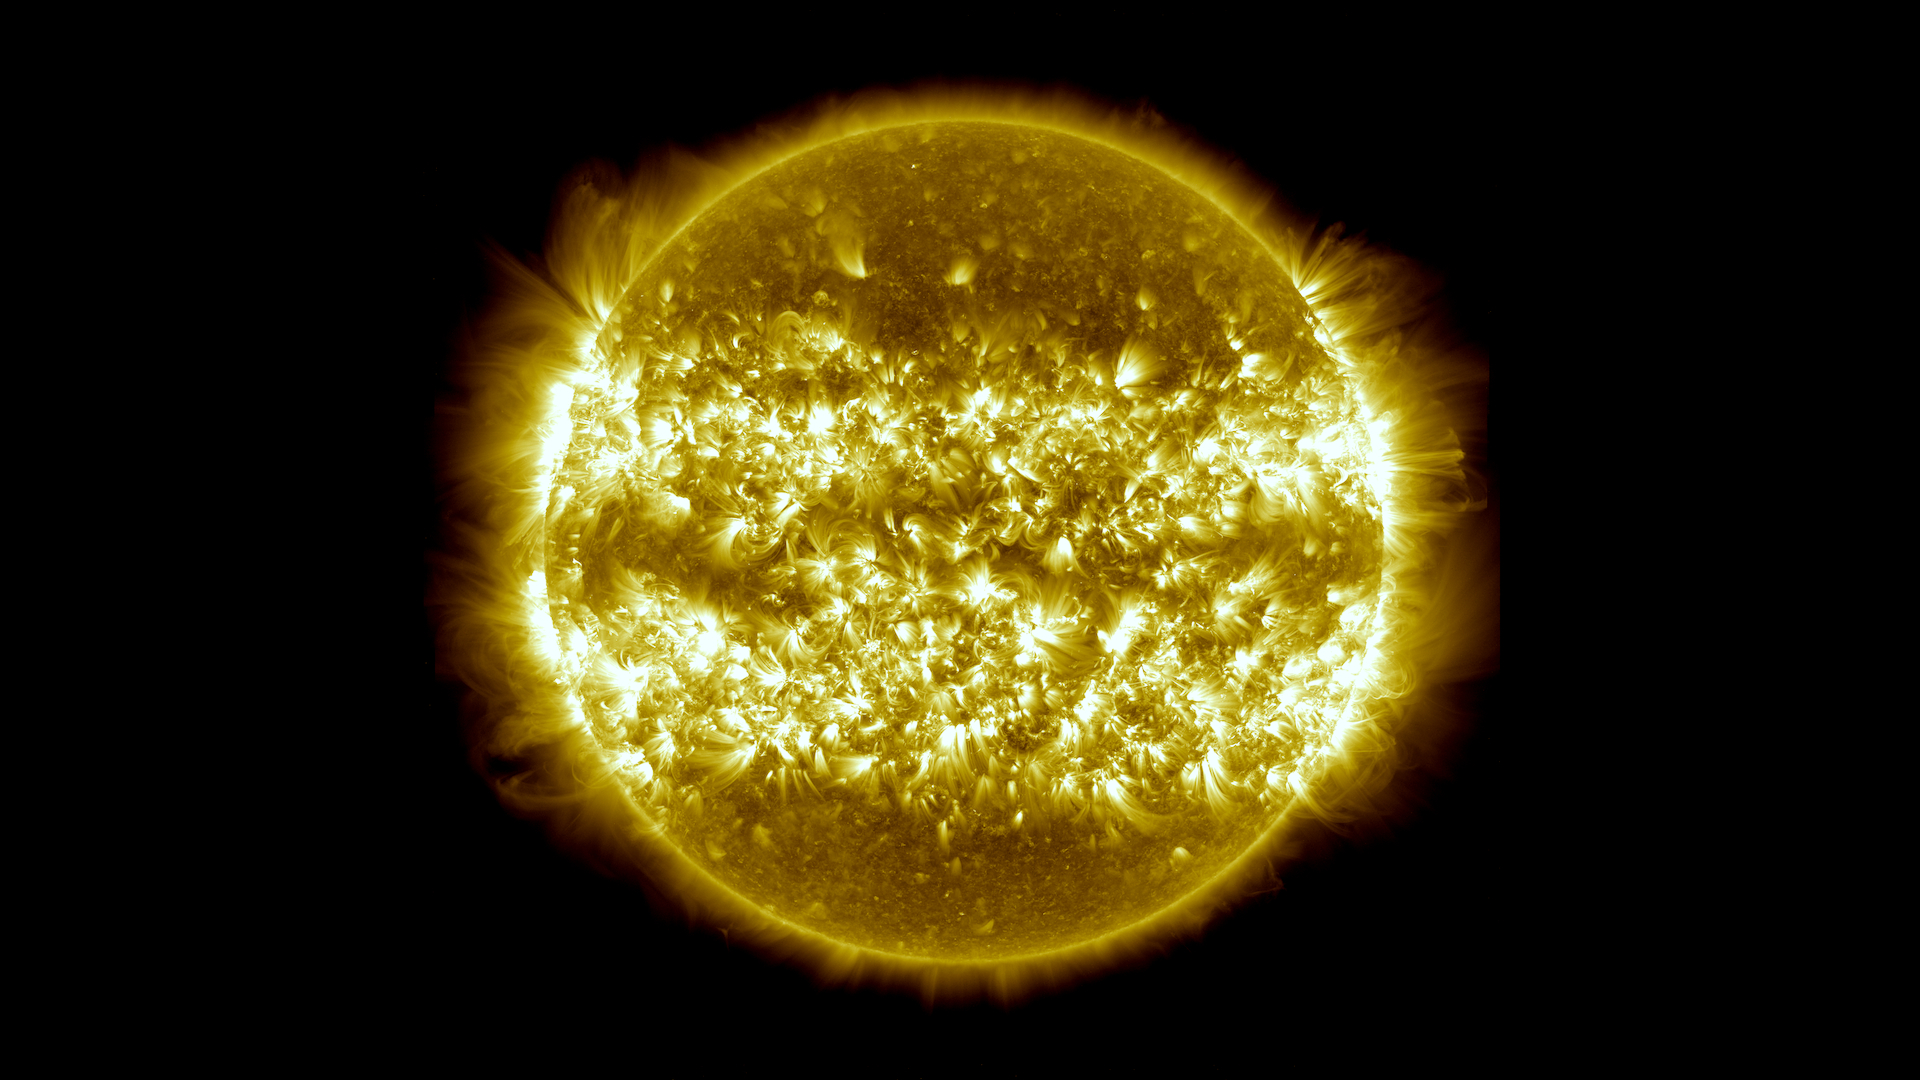
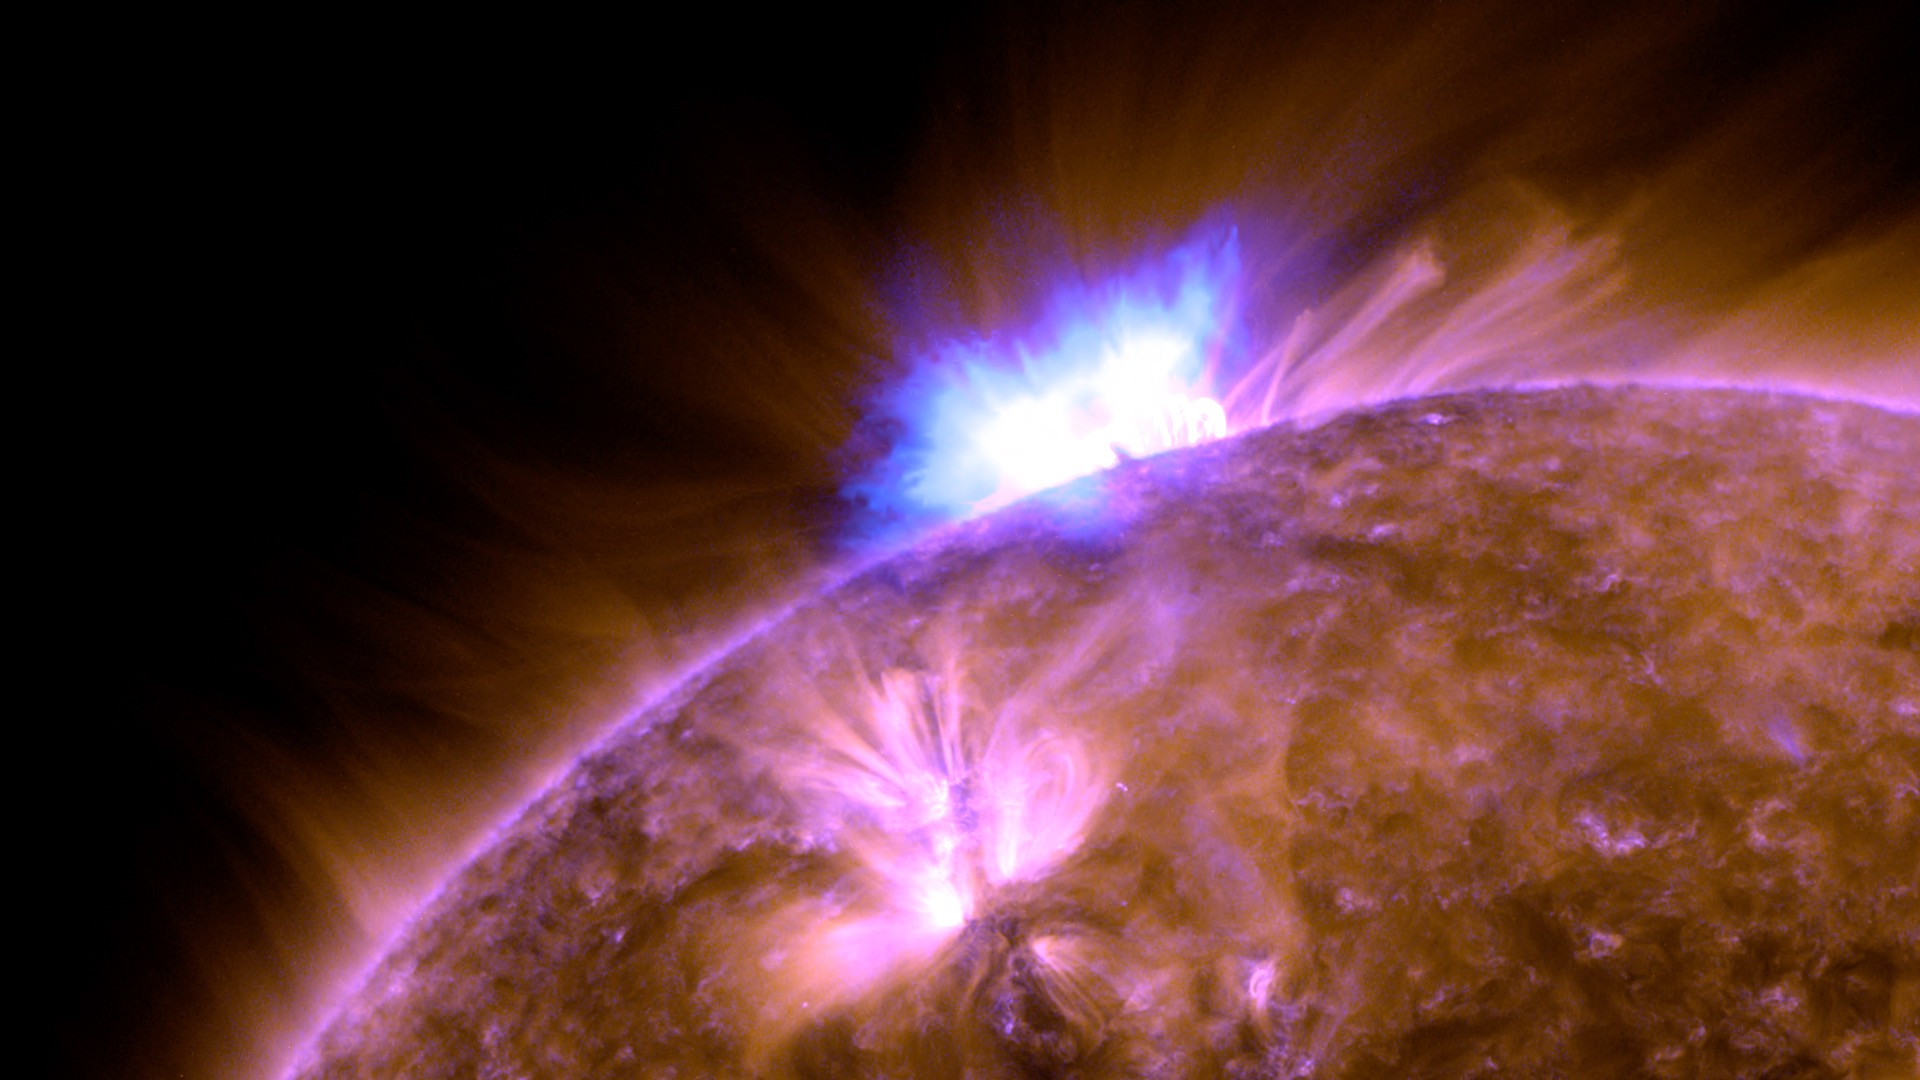
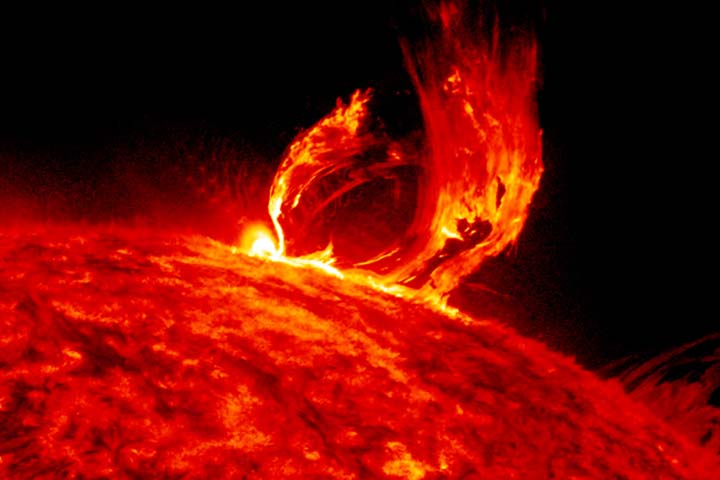
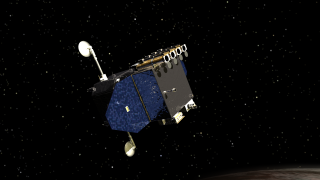
Since its launch on Feb. 11, 2010, the Solar Dynamics Observatory (SDO) has studied the solar atmosphere to help us understand the Sun’s influence on Earth. Every 12 seconds, SDO images the Sun in 10 wavelengths of ultraviolet light, each of which reveals different solar features. These images help us explain where the Sun's energy comes from, how the inside of the Sun works, and how the Sun’s atmosphere stores and releases energy in dramatic eruptions that can influence Earth.
Learn more: https://science.nasa.gov/mission/sdo/
Best Of
- ID: 13641
 Produced Video
 - ID: 11742
 Produced Video
 - ID: 13057
 Produced Video
 - ID: 11460
 Produced Video
 - ID: 11203
 Produced Video
 - ID: 10966
 Produced Video
 - ID: 10748
 Produced Video
 - ID: 12144
 Produced Video
 - ID: 11385
 Produced Video
 - ID: 11255
 Produced Video
 - ID: 11095
 Produced Video
 - ID: 11112
 Produced Video
 - ID: 11168
 Produced Video
 - ID: 11379
 Produced Video
 - ID: 11721
 Produced Video
 - ID: 11762
 Produced Video
 - ID: 11864
 Produced Video
 - ID: 10801
 Produced Video
Produced Videos
- ID: 14592
 Produced Video
 - ID: 14588
 Produced Video
 - ID: 14536
 Produced Video
 - ID: 14263
 Produced Video
 - ID: 13982
 Produced Video
 - ID: 13859
![Music credits: “Swirling Blizzard” and “Endless Swirl” by Laurent Dury [SACEM] from Universal Production Music Watch this video on the NASA Goddard YouTube channel.Complete transcript available.](/vis/a010000/a013800/a013859/13859_SDOColors.00700_print.jpg) Produced Video
Produced Video - ID: 13641Produced Video
- ID: 13524
 Produced Video
 - ID: 13425
 Produced Video
 - ID: 12640
 Produced Video
 - ID: 40361
 Gallery
4k Content
- ID: 12737
 Produced Video
 - ID: 4462
 Visualization
 - ID: 3999
 Visualization
 - ID: 4026
 Visualization
 - ID: 3919
 Visualization
 - ID: 4136
 Visualization
 - ID: 4038
 Visualization
 - ID: 4250
 Visualization
 - ID: 3955
 Visualization
 - ID: 4246
 Visualization
 - ID: 11379Produced Video
- ID: 40357Gallery
Solar Events
- ID: 14592Produced Video
- ID: 14588Produced Video
- ID: 14536Produced Video
- ID: 14202
 Produced Video
 - ID: 14163
 Produced Video
 - ID: 13778
 Produced Video
 - ID: 13425Produced Video
- ID: 12706
 Produced Video
 - ID: 12224
 Produced Video
 - ID: 11993
 Produced Video
 - ID: 11908
 Produced Video
 - ID: 40360Gallery
Still Images and Graphics
- ID: 12973 Infographic
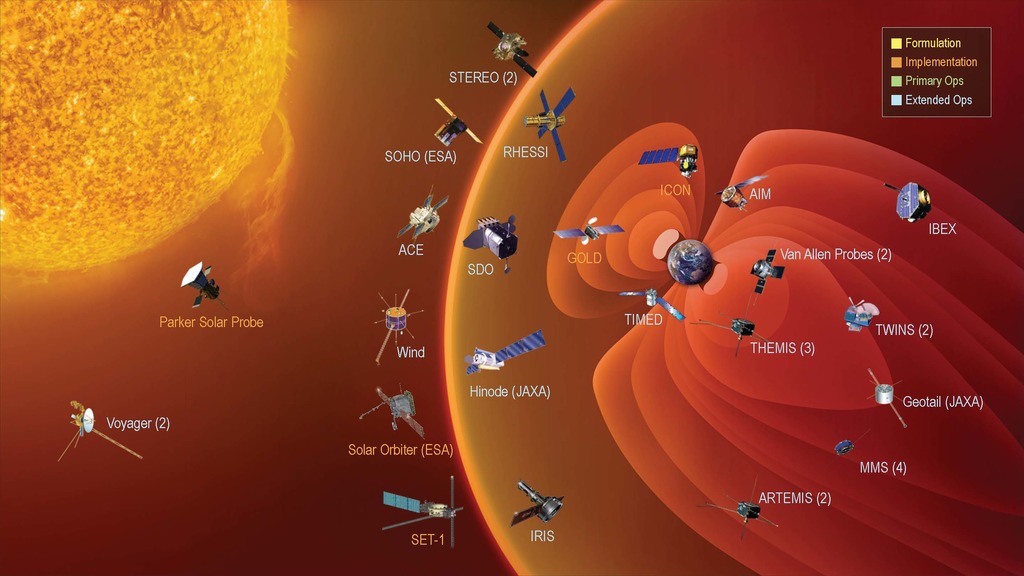
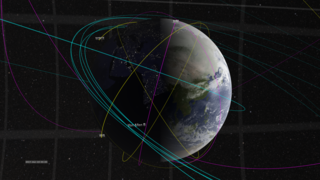
NASA's Heliophysics Fleet
Go to this pageHeliophysics encompasses science that improves our understanding of fundamental physical processes throughout the solar system, and enables us to understand how the Sun, as the major driver of the energy throughout the solar system, impacts our technological society. The scope of heliophysics is vast, spanning from the Sun’s interior to Earth’s upper atmosphere, throughout interplanetary space, to the edges of the heliosphere, where the solar wind interacts with the local interstellar medium. Heliophysics incorporates studies of the interconnected elements in a single system that produces dynamic space weather and that evolves in response to solar, planetary, and interstellar conditions. ||
- ID: 4911 Visualization
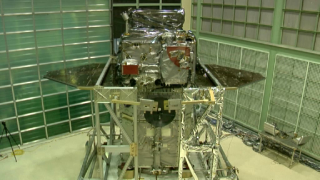
Aging (Instruments) in Space
Go to this pageThe space environment is harsh not only on humans and other living organisms, but instruments also.Damage from solar energetic particles and cosmic rays can slowly degrade performance of an instrument. Fortunately there are ways to characterize and correct for this degradation. The graphics on this page are based on the tutorial AIApy: Modeling Channel Degradation over Time. ||
- ID: 11167 Produced Video
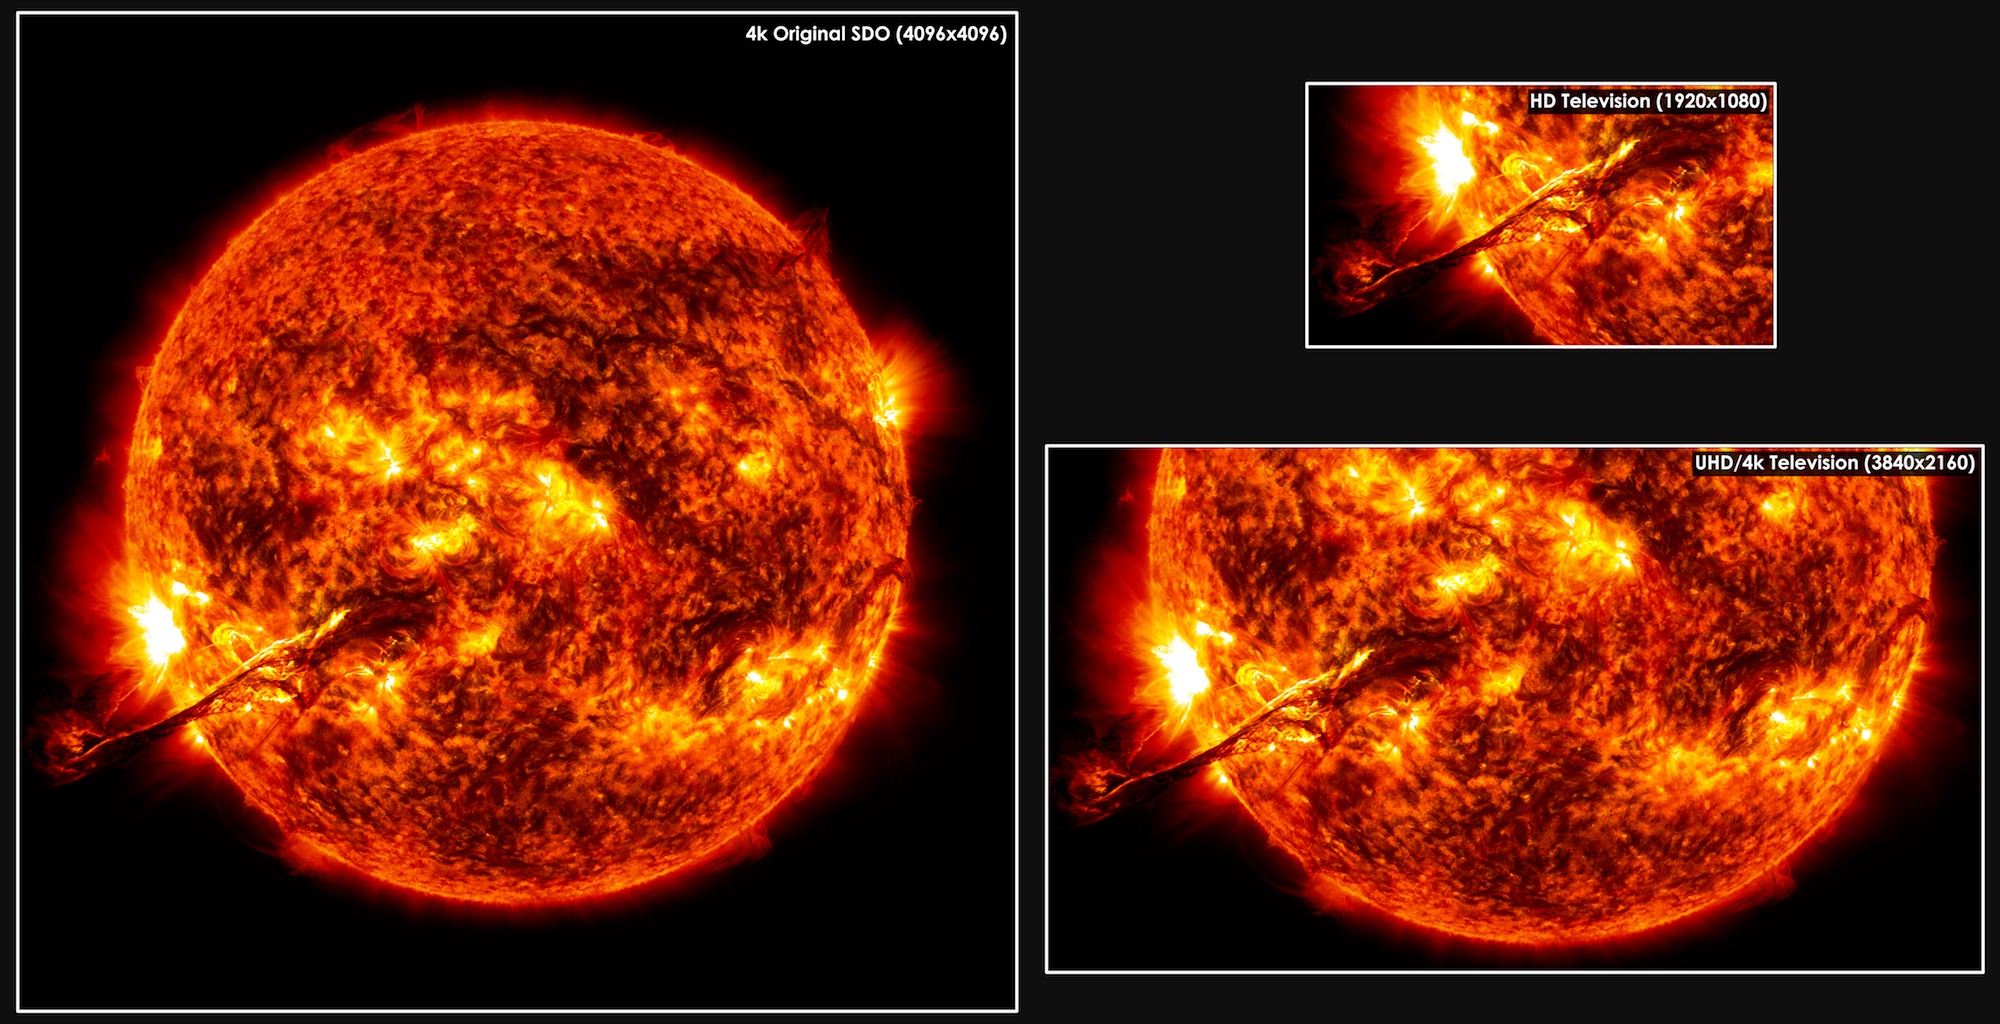
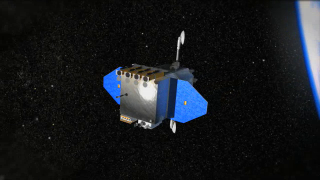
SDO Resolution Comparison Resource Page
Go to this pageUltra High Definition, or 4k, TV has four times as many pixels as a high definition 1080 TV. NASA's Solar Dynamics Observatory (SDO). Its Atmospheric Imaging Assembly (AIA) and Helioseismic Magnetic Imager (HMI) instruments together capture an image almost once a second that is twice again as large as what the ultra high-def screens can display. Such detailed pictures show features on the sun that are as small as 200 miles across, helping researchers observe such things as what causes giant eruptions on the sun known as coronal mass ejections (CME) that can travel toward Earth and interfere with our satellites. ||
- ID: 11739 Produced Video
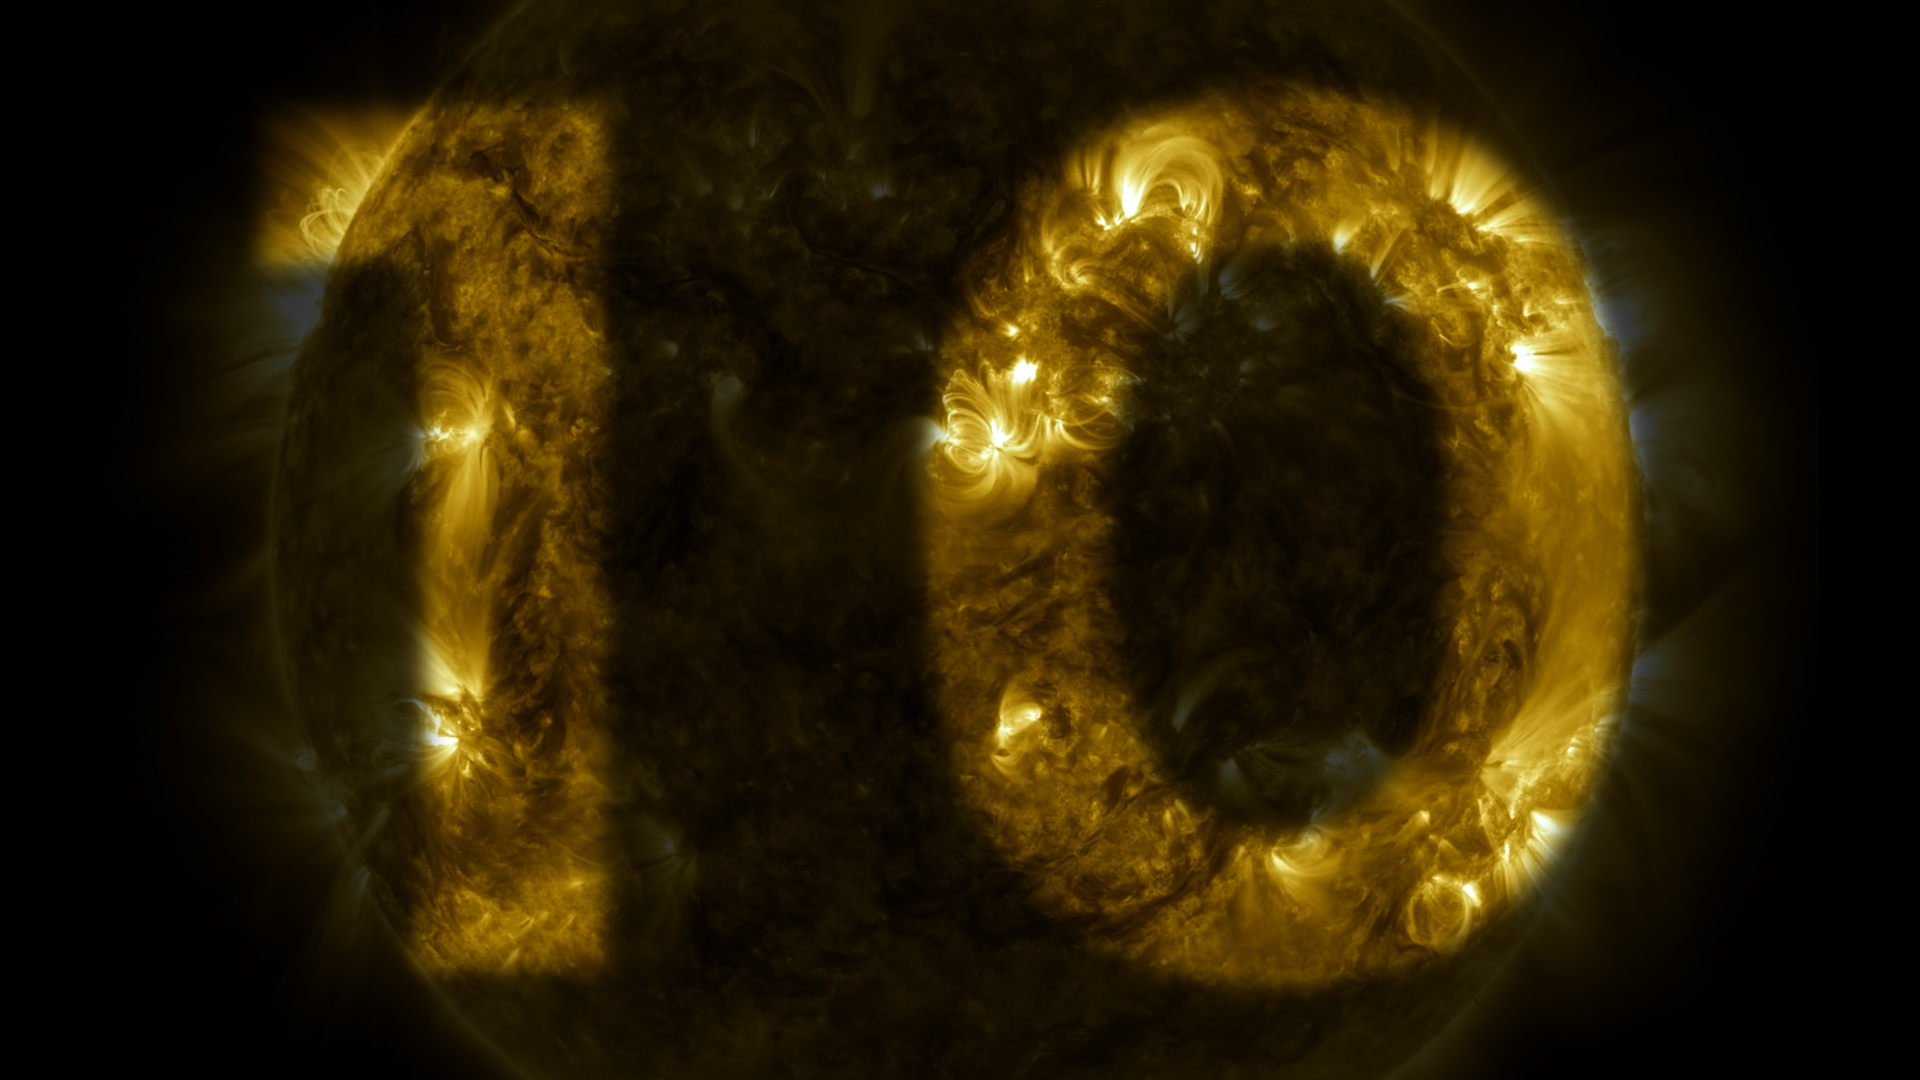
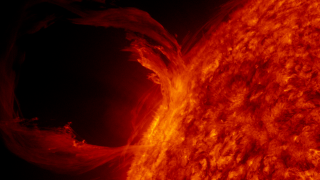
Telescope on NASA's SDO Collects Its 100 Millionth Image
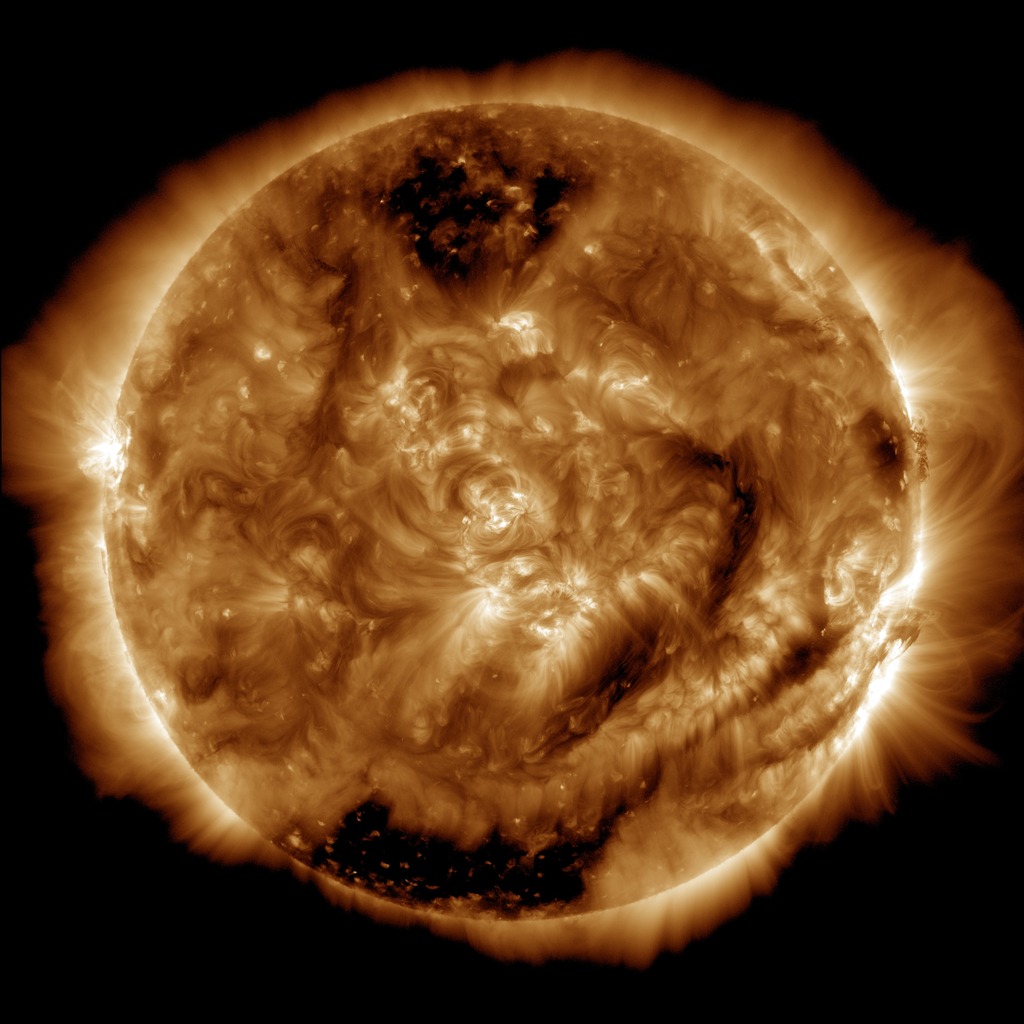
Go to this page100 million images of the sun: The Advanced Imaging Assembly on NASA's Solar Dynamics Observatory captured its 100 millionth image of the sun on Jan. 19, 2015. The image shows the glow in the solar atmosphere of gases at about 1.5 million Kelvin. Credit: NASA/SDO/AIA/LMSAL || SDO_AIA_193_100Millionth_print.jpg (1024x1024) [168.6 KB] || SDO_AIA_193_100Millionth.jpeg (4096x4096) [2.4 MB] || SDO_AIA_193_100Millionth_web.jpg (320x320) [27.3 KB] || SDO_AIA_193_100Millionth_searchweb.png (320x180) [95.6 KB] || SDO_AIA_193_100Millionth_thm.png (80x40) [10.2 KB] ||
- ID: 11071 Produced Video
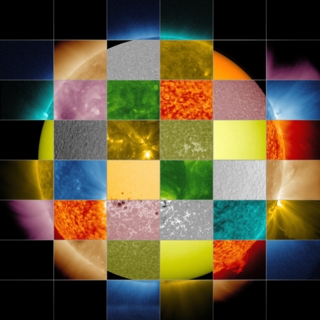
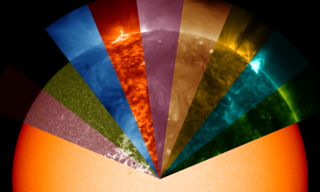
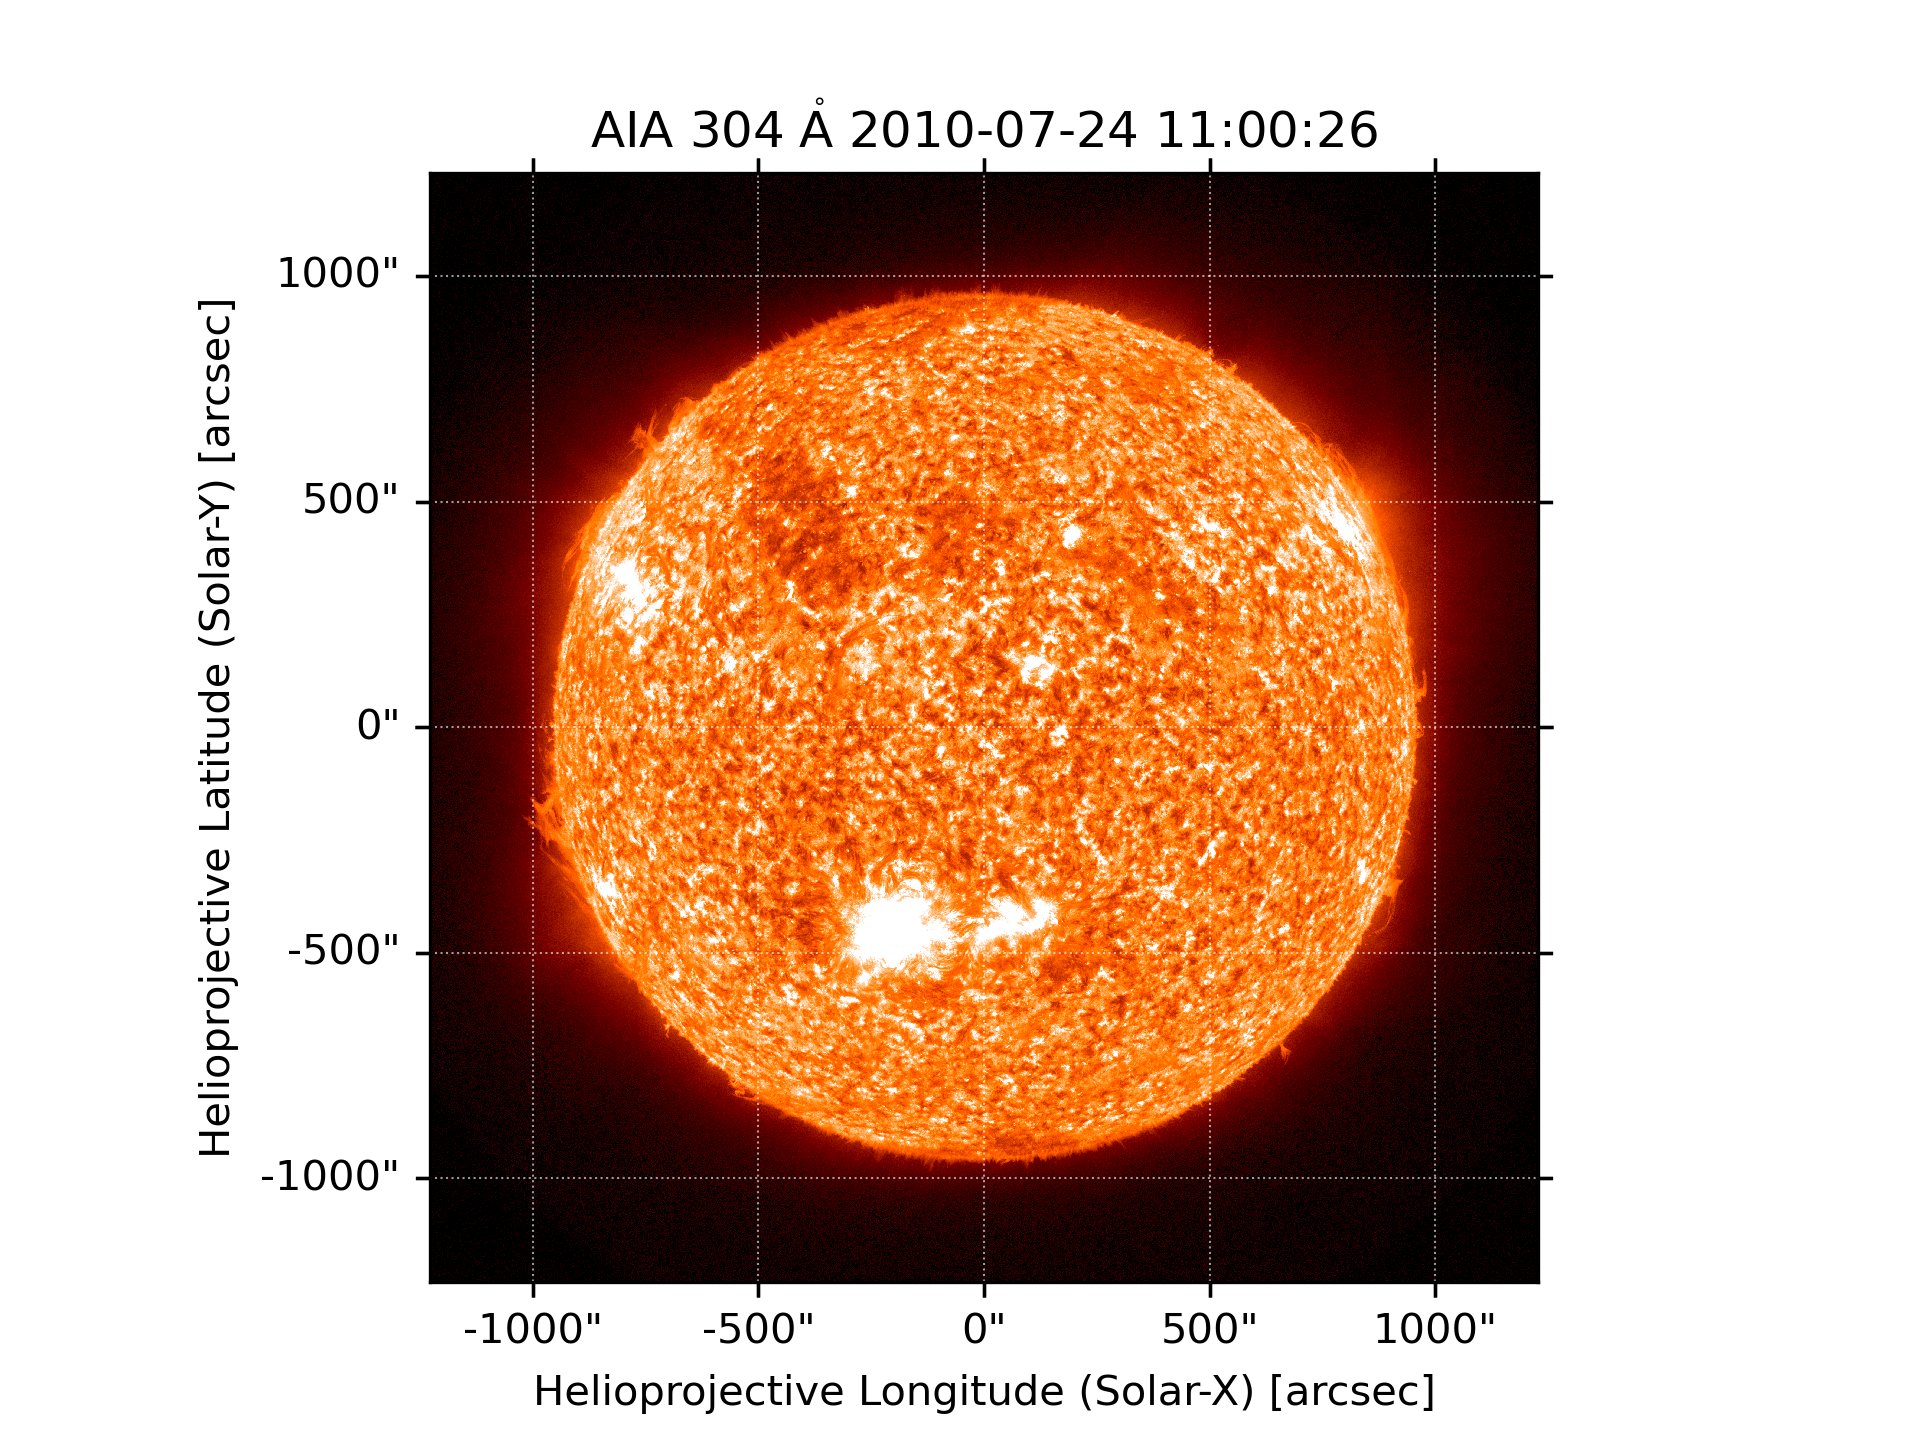
SDO Wavelength Graphics
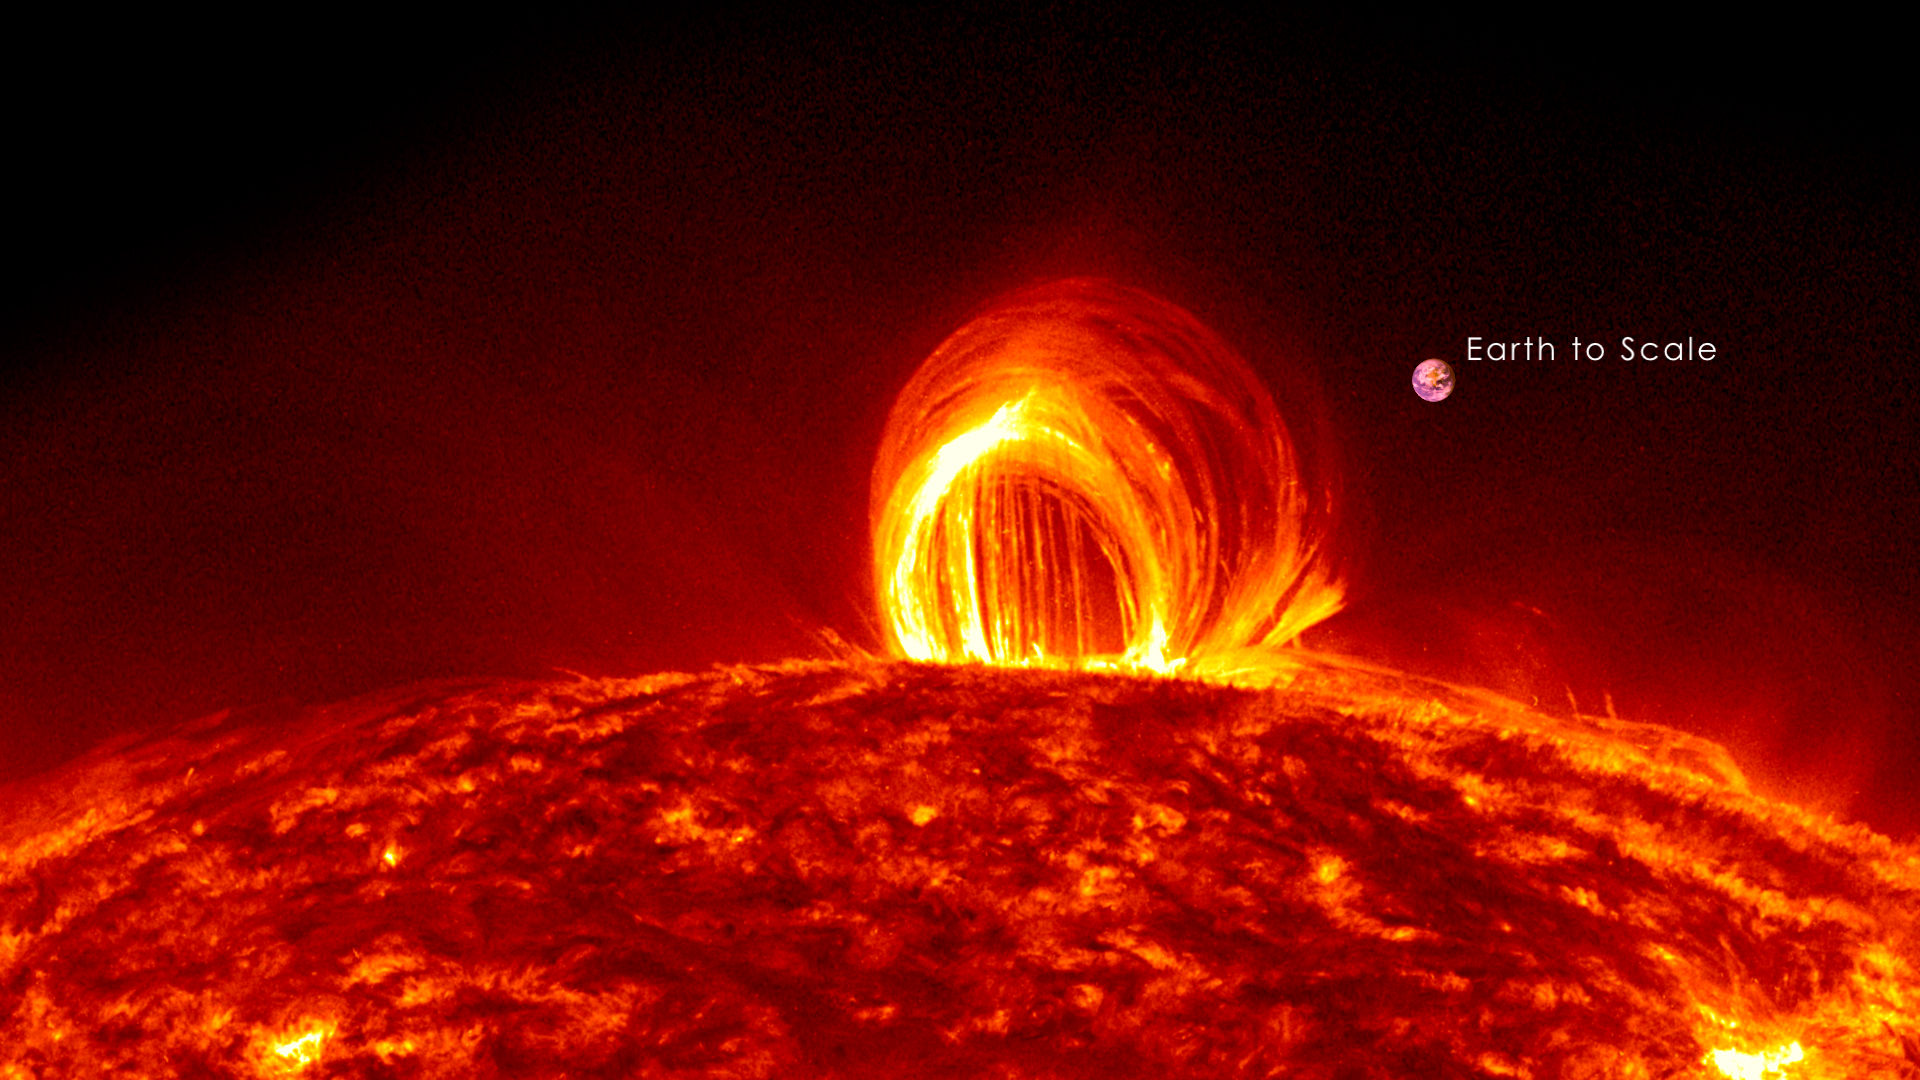
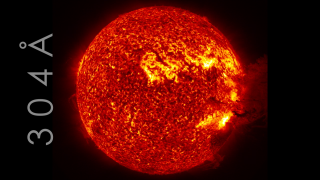
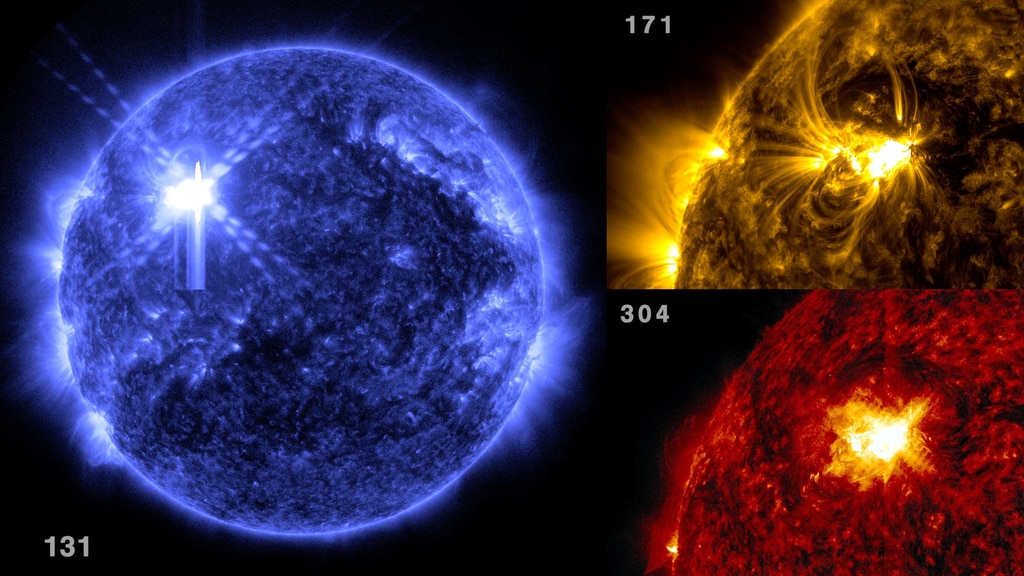
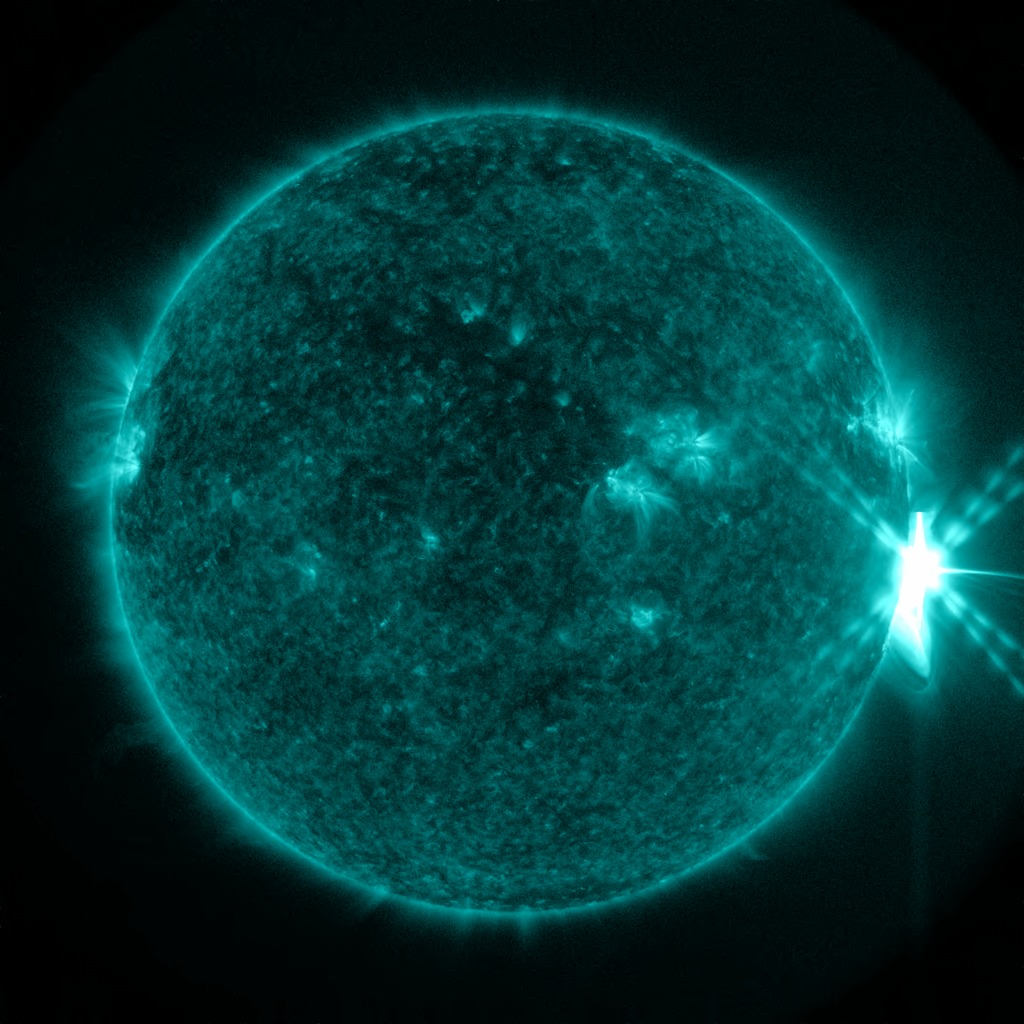
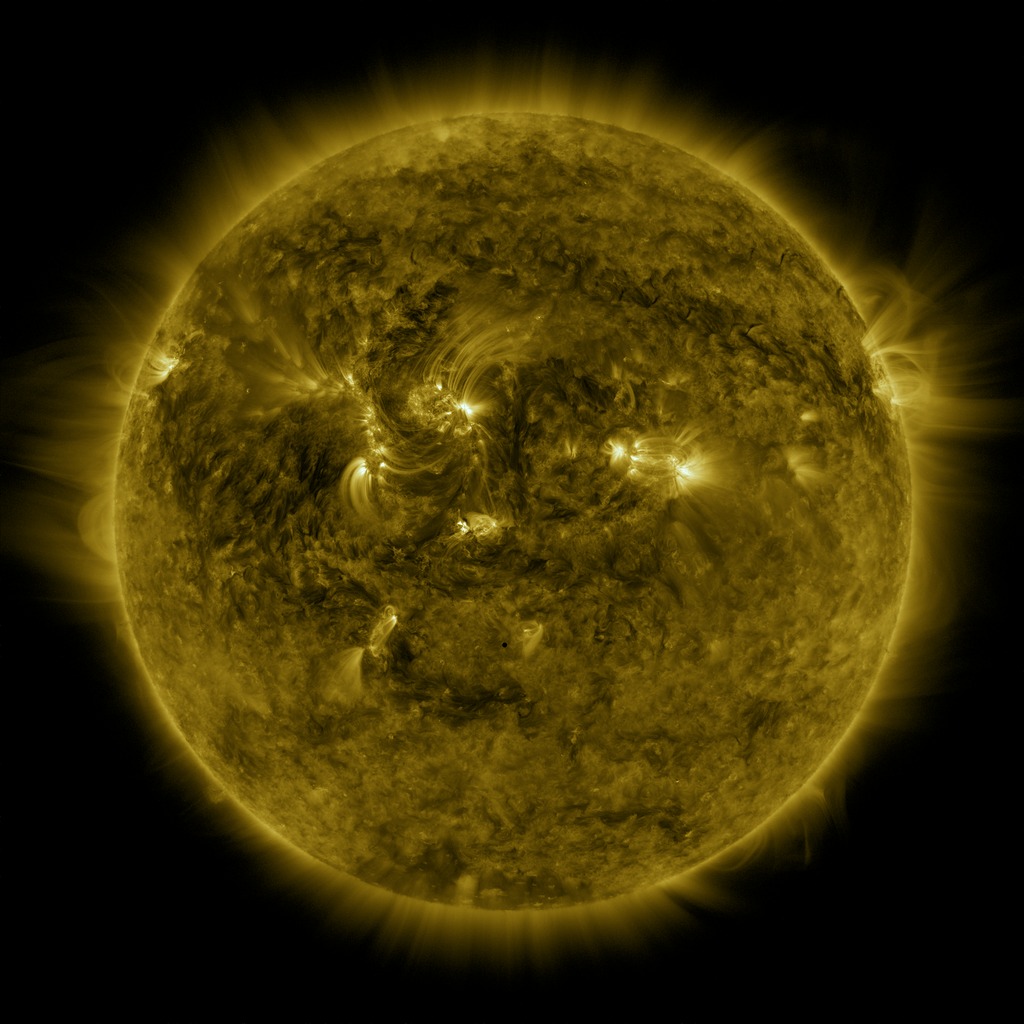
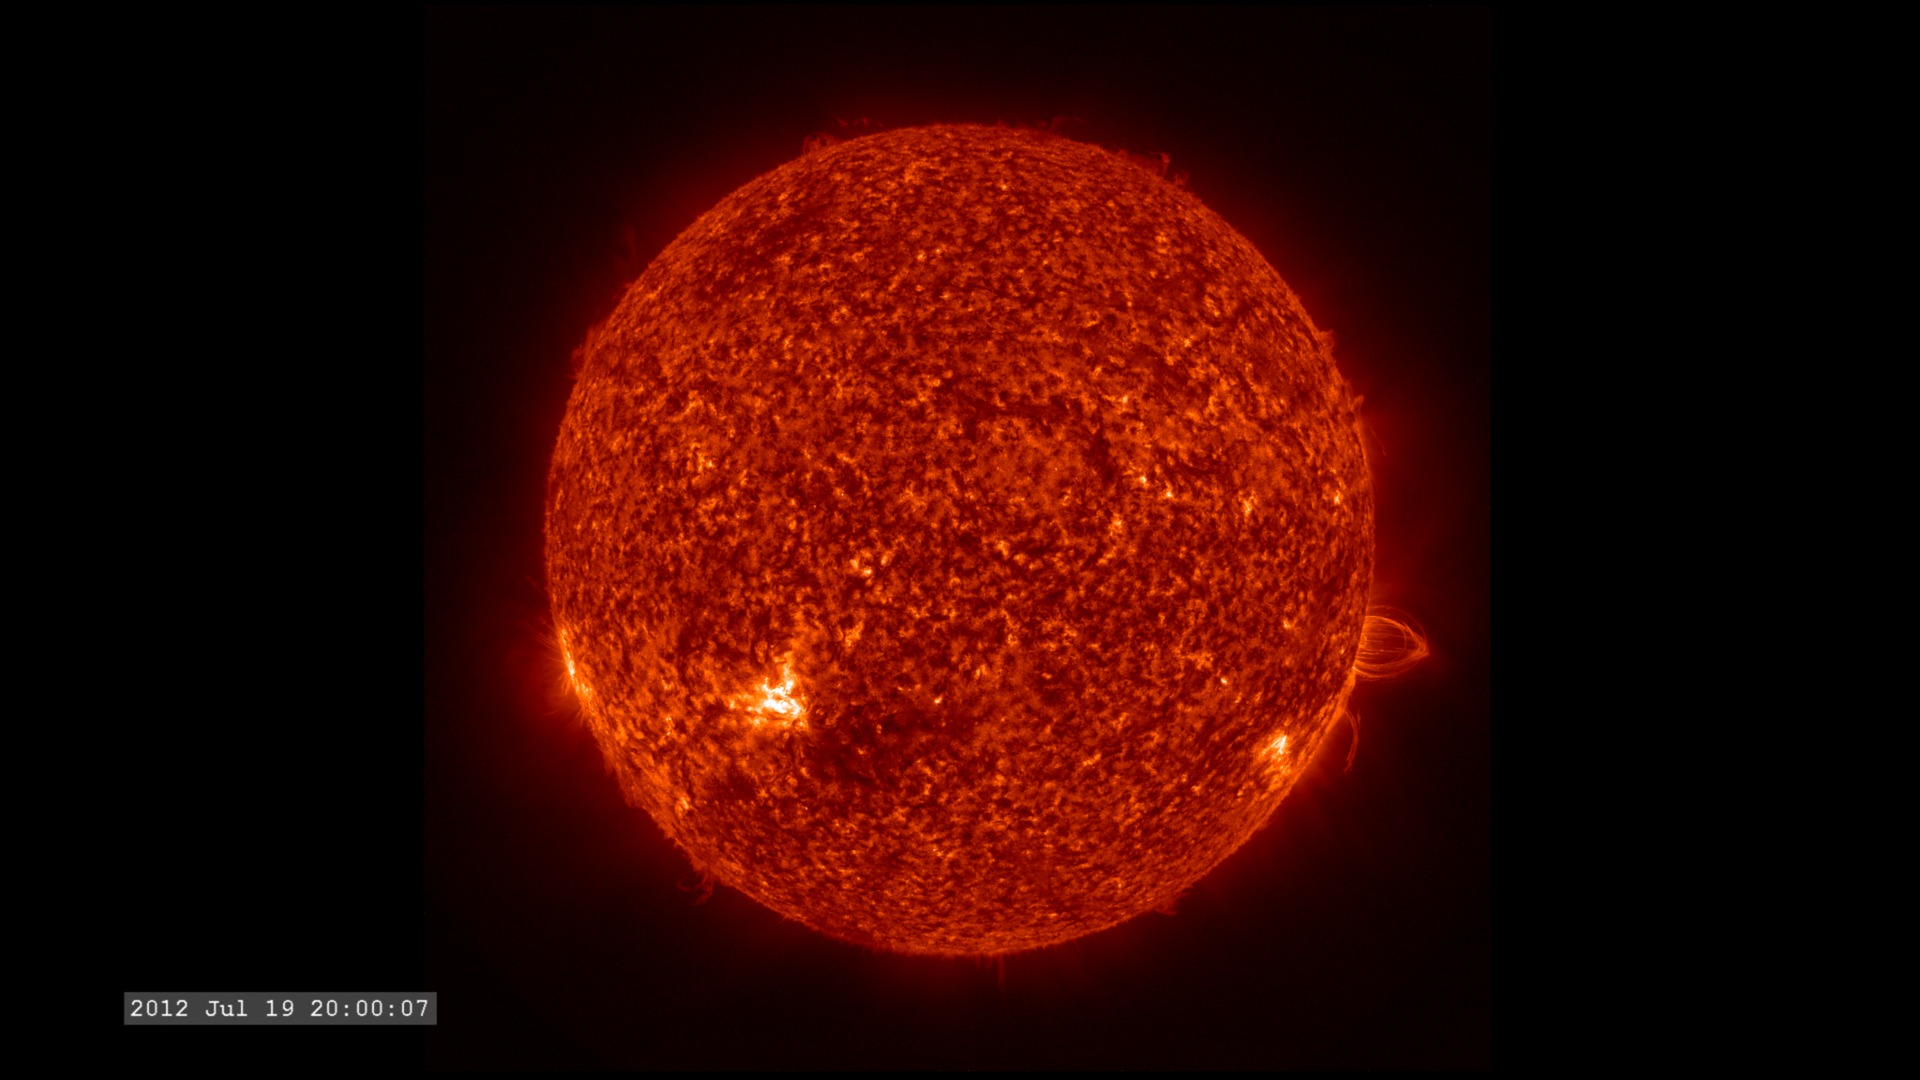
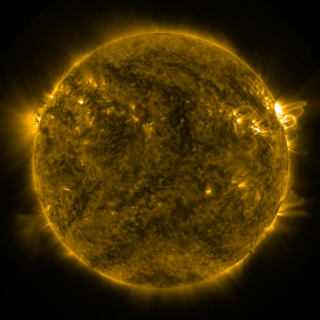
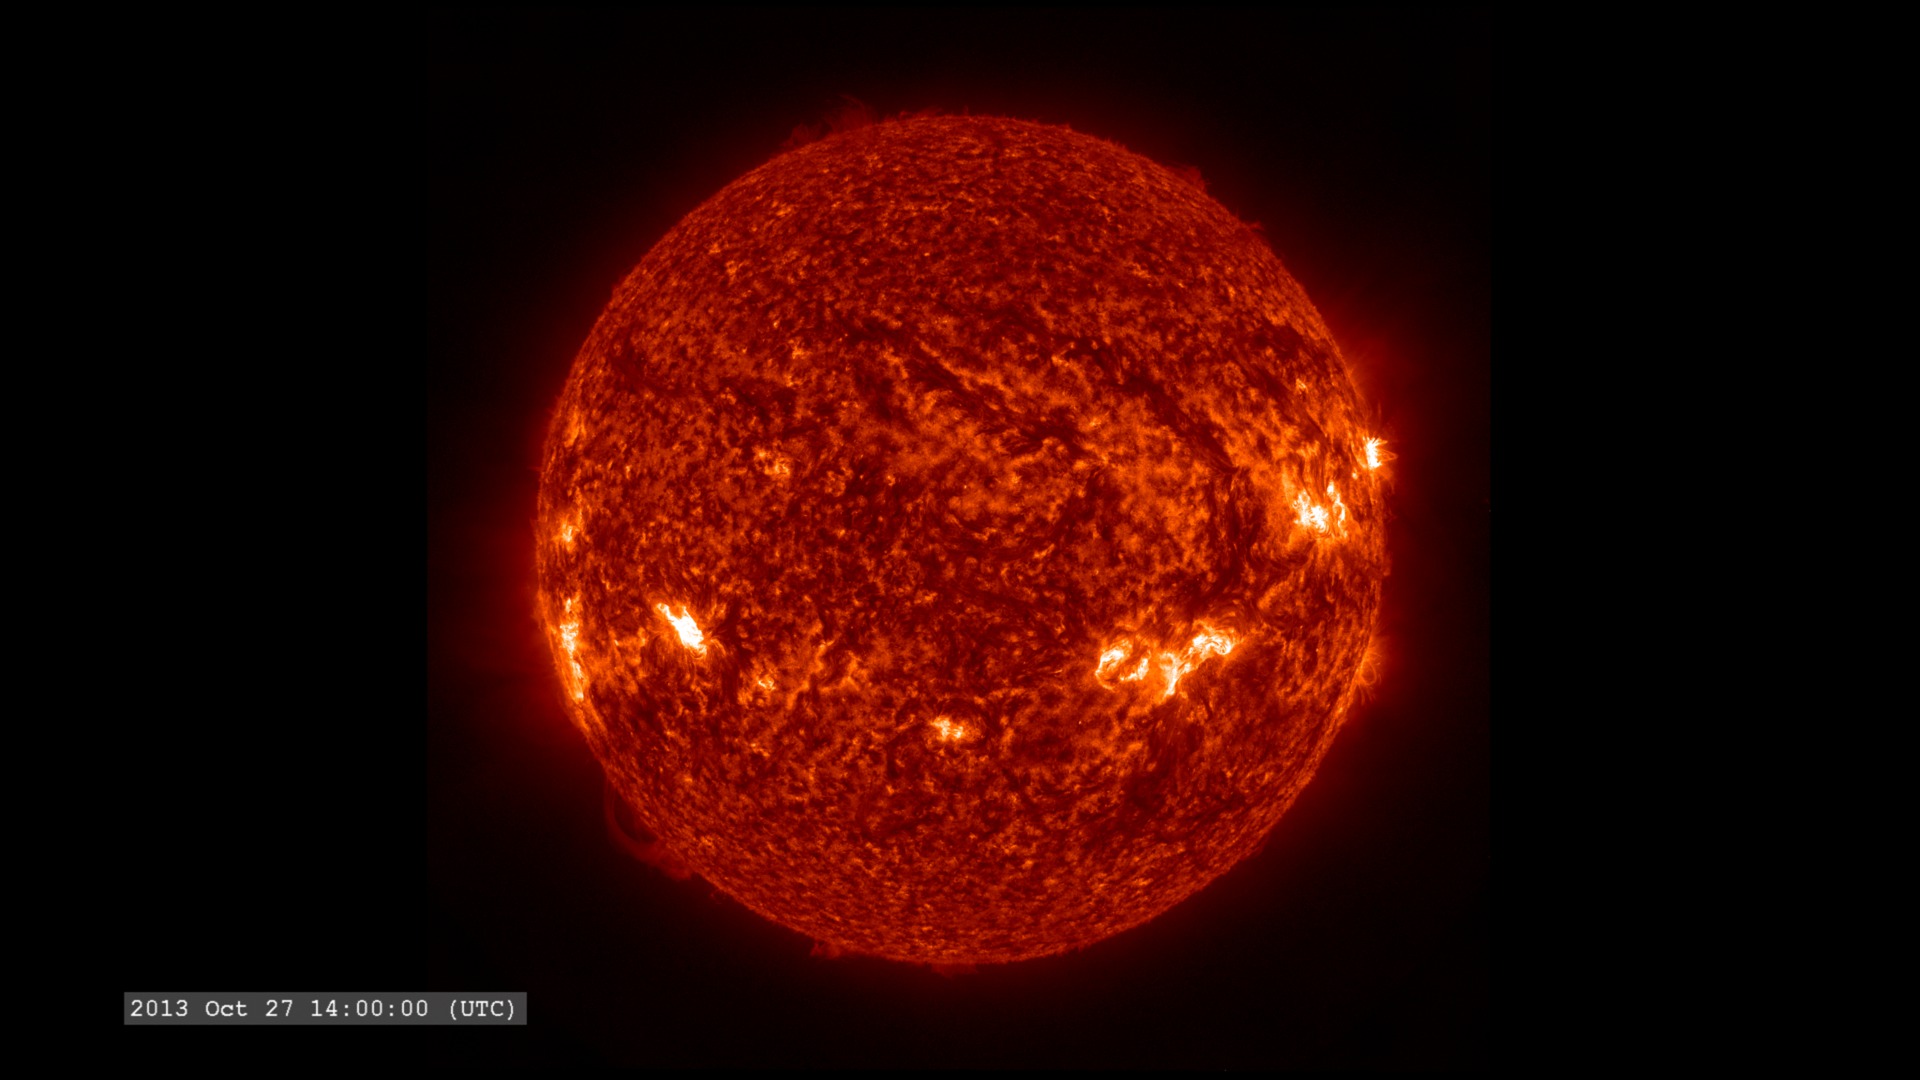
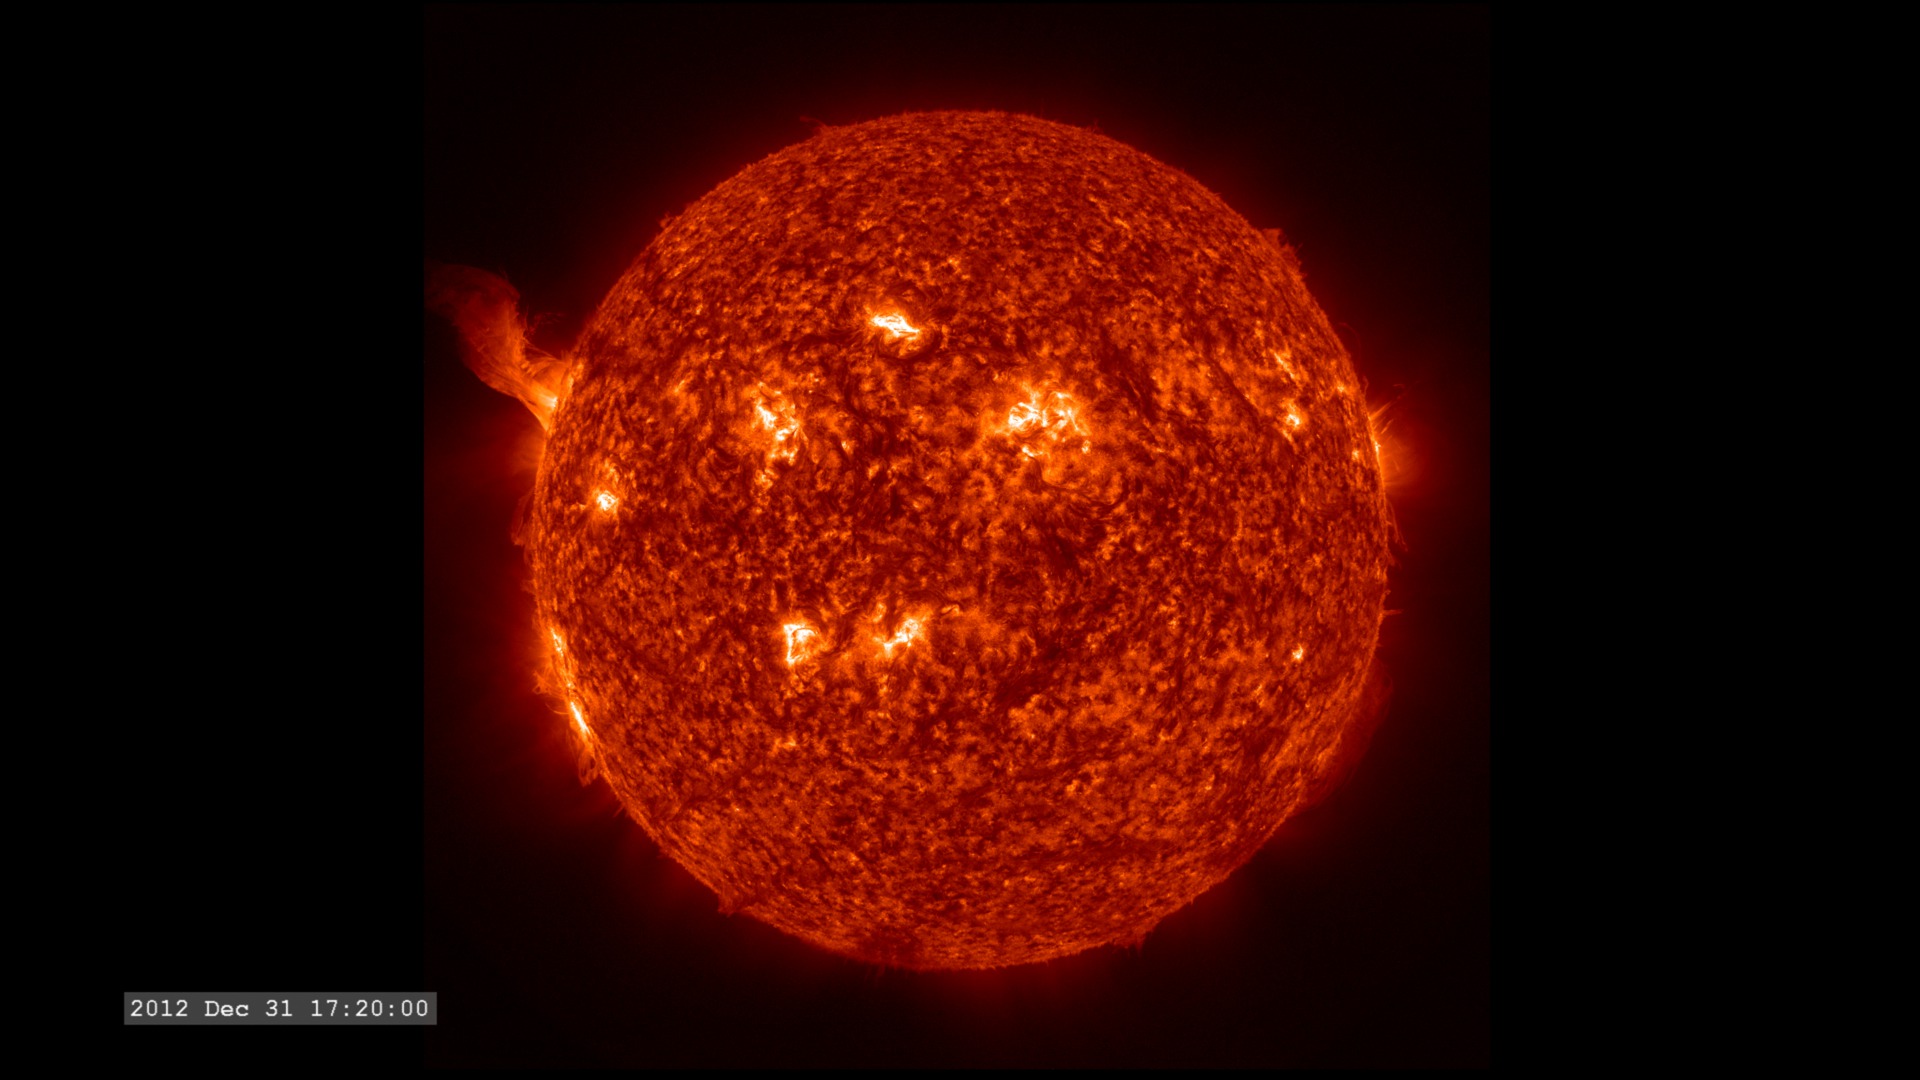
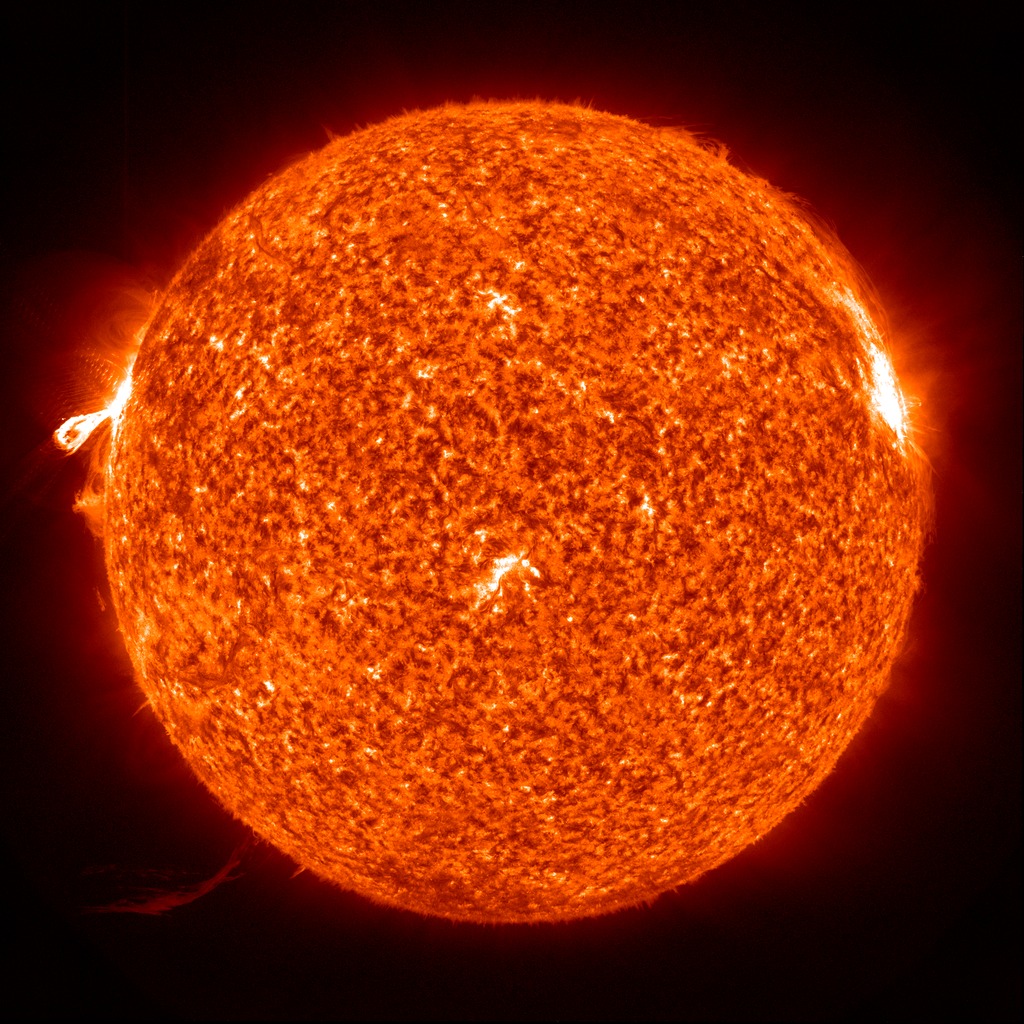
Go to this pageSpecialized instruments, either in ground-based or space-based telescopes, can observe light far beyond the ranges visible to the naked eye. Different wavelengths convey information about different components of the sun's surface and atmosphere, so scientists use them to paint a full picture of our constantly changing and varying star.Yellow light of 5800 angstroms, for example, generally emanates from material of about 10,000 degrees F (5700 degrees C), which represents the surface of the sun. Extreme ultraviolet light of 94 angstroms, on the other hand, comes from atoms that are about 11 million degrees F (6,300,000 degrees C) and is a good wavelength for looking at solar flares, which can reach such high temperatures. By examining pictures of the sun in a variety of wavelengths — as is done through such telescopes as NASA's Solar Dynamics Observatory (SDO), NASA's Solar Terrestrial Relations Observatory (STEREO) and the ESA/NASA Solar and Heliospheric Observatory (SOHO) — scientists can track how particles and heat move through the sun's atmosphere.We see the visible spectrum of light simply because the sun is made up of a hot gas — heat produces light just as it does in an incandescent light bulb. But when it comes to the shorter wavelengths, the sun sends out extreme ultraviolet light and x-rays because it is filled with many kinds of atoms, each of which give off light of a certain wavelength when they reach a certain temperature. Not only does the sun contain many different atoms — helium, hydrogen, iron, for example — but also different kinds of each atom with different electrical charges, known as ions. Each ion can emit light at specific wavelengths when it reaches a particular temperature. Scientists have cataloged which atoms produce which wavelengths since the early 1900s, and the associations are well documented in lists that can take up hundreds of pages.Instruments that produce conventional images of the sun focus exclusively on light around one particular wavelength, sometimes not one that is visible to the naked eye. SDO scientists, for example, chose 10 different wavelengths to observe for its Atmospheric Imaging Assembly (AIA) instrument. Each wavelength is largely based on a single, or perhaps two types of ions — though slightly longer and shorter wavelengths produced by other ions are also invariably part of the picture. Each wavelength was chosen to highlight a particular part of the sun's atmosphere.From the sun's surface on out, the wavelengths SDO observes, measured in angstroms, are: 4500: Showing the sun's surface or photosphere. 1700: Shows surface of the sun, as well as a layer of the sun's atmosphere called the chromosphere, which lies just above the photosphere and is where the temperature begins rising. 1600: Shows a mixture between the upper photosphere and what's called the transition region, a region between the chromosphere and the upper most layer of the sun's atmosphere called the corona. The transition region is where the temperature rapidly rises. 304: This light is emitted from the chromosphere and transition region. 171: This wavelength shows the sun's atmosphere, or corona, when it's quiet. It also shows giant magnetic arcs known as coronal loops. 193: Shows a slightly hotter region of the corona, and also the much hotter material of a solar flare. 211: This wavelength shows hotter, magnetically active regions in the sun's corona. 335: This wavelength also shows hotter, magnetically active regions in the corona. 94: This highlights regions of the corona during a solar flare. 131: The hottest material in a flare. ||
- ID: 11711 Produced Video
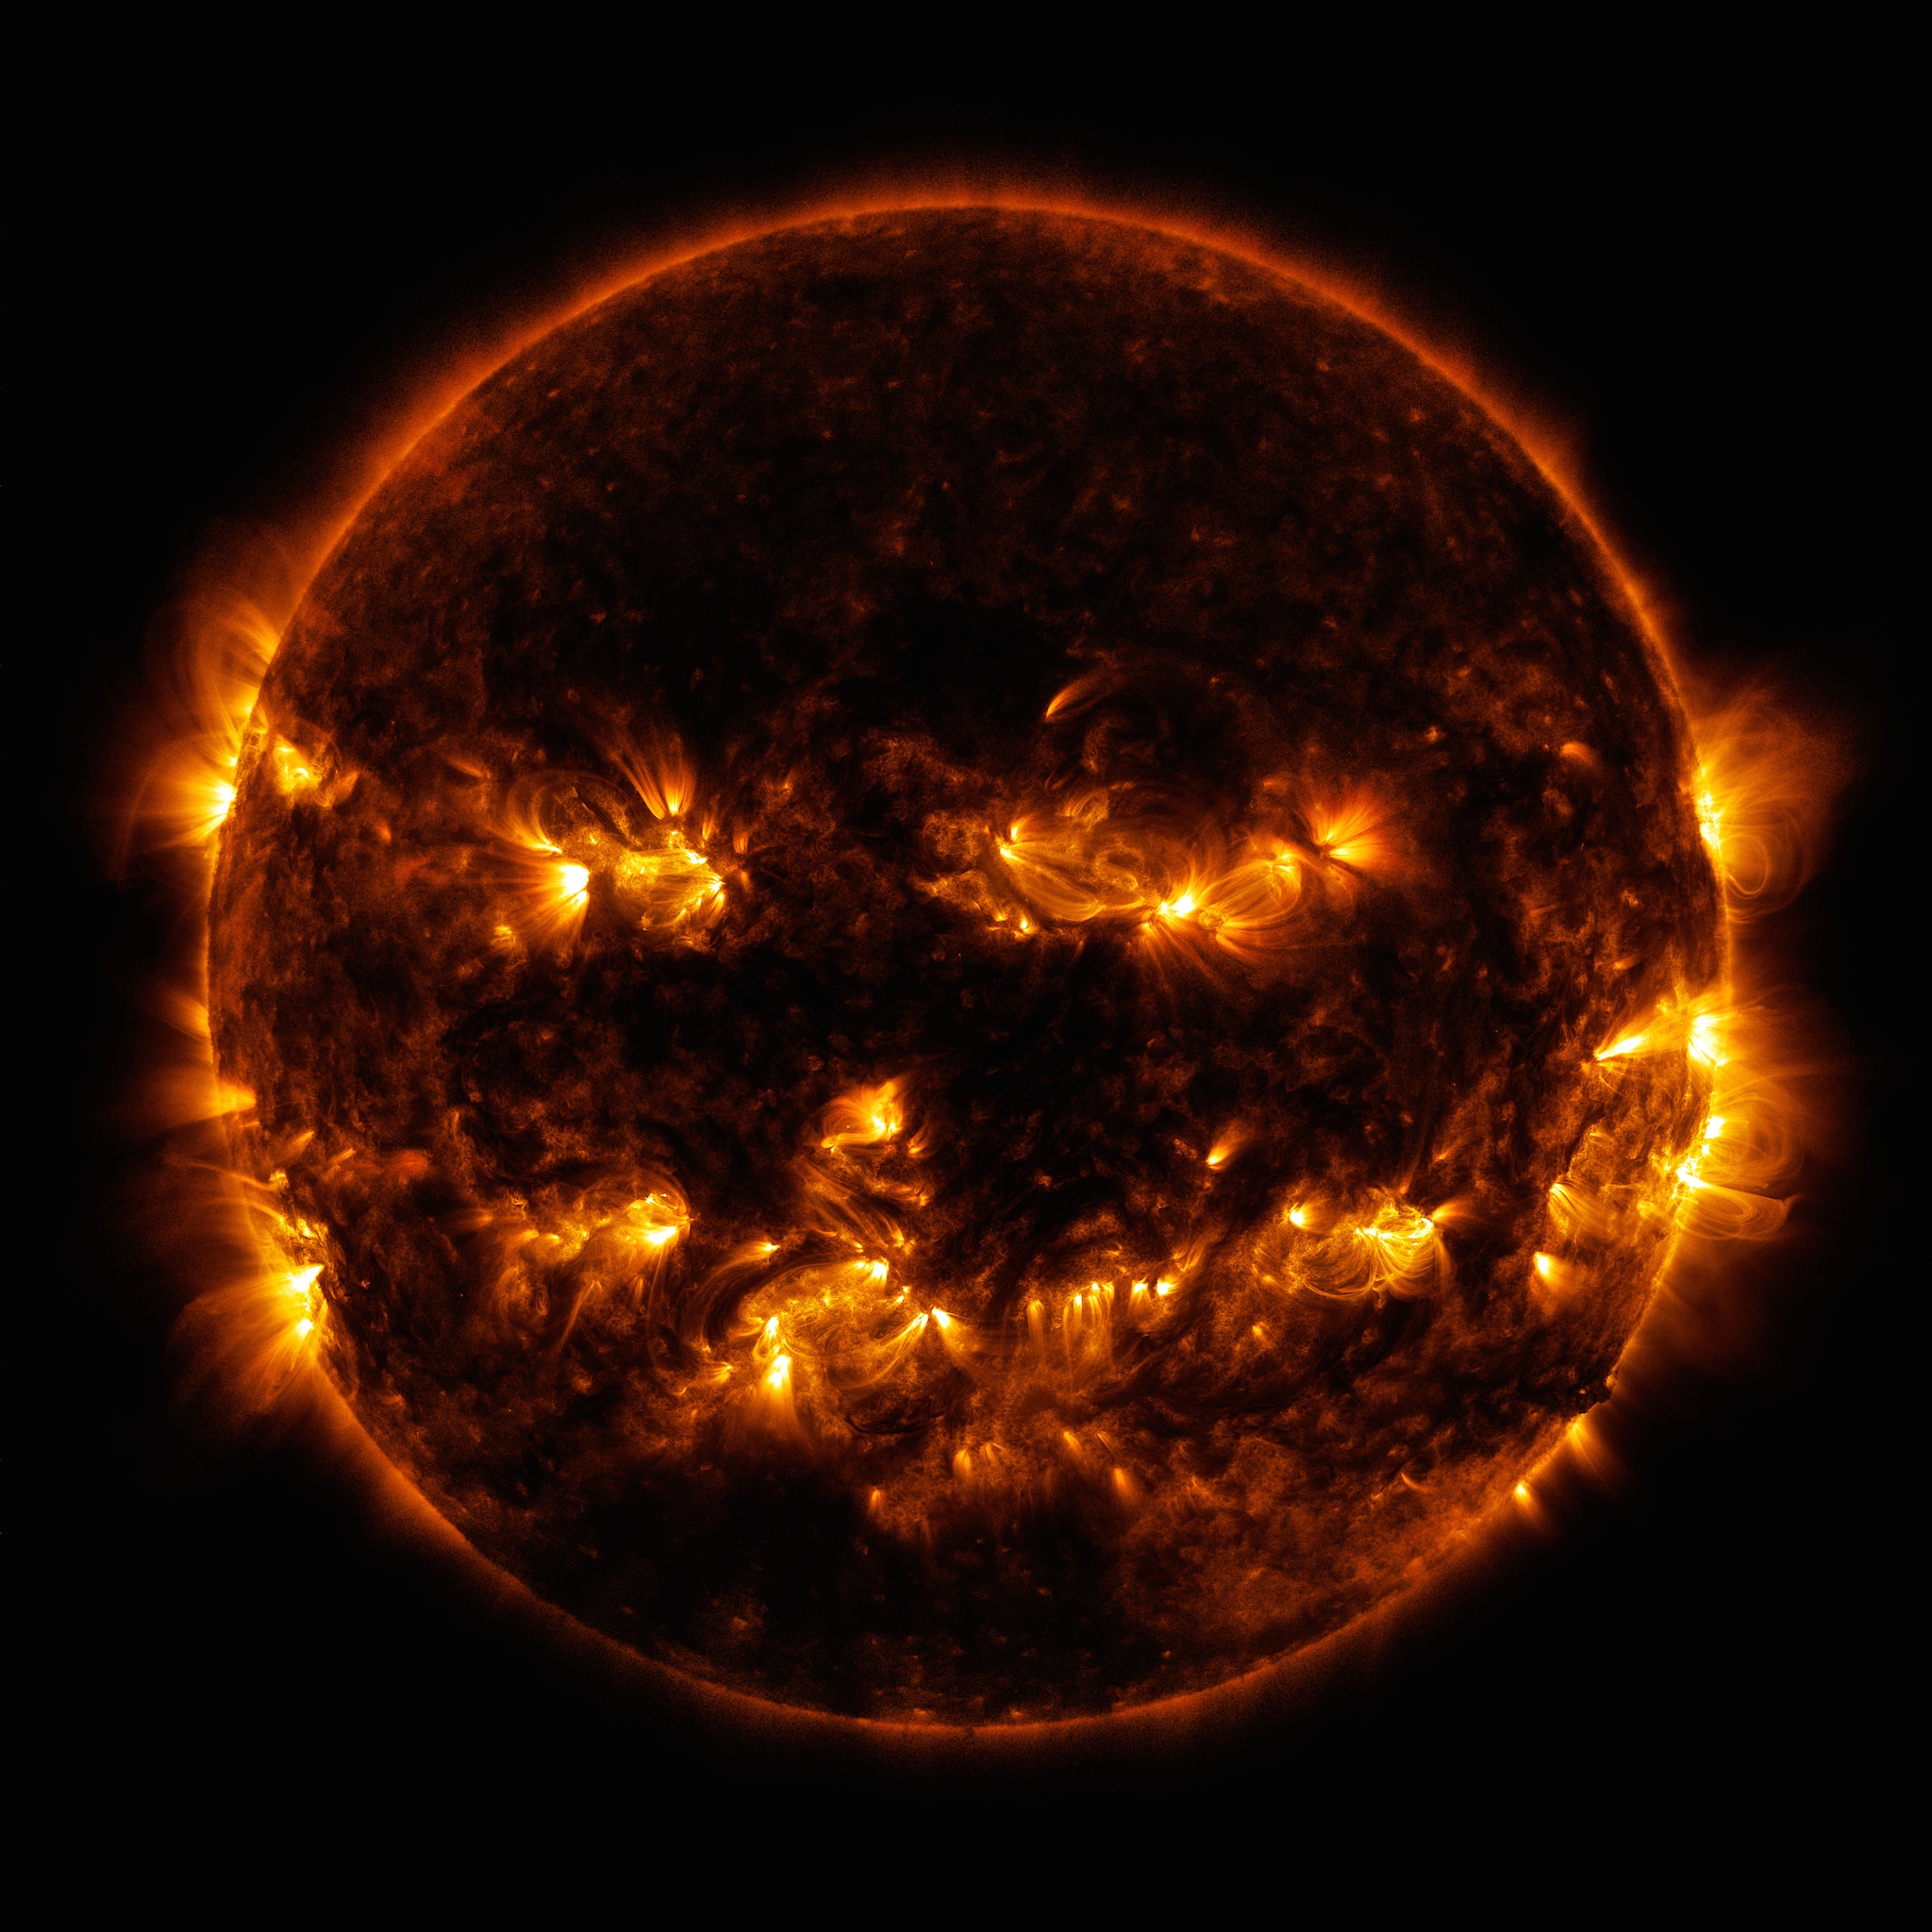
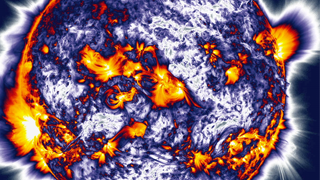
Pumpkin Sun
Go to this pageOn October 8, 2014, active regions on the sun gave it the appearance of a jack-o'-lantern. This image is a blend of 171 and 193 angstrom light as captured by the Solar Dynamics Observatory.Credit: NASA/GSFC/SDO || Halloween_Sun_2014_2k.jpg (2048x2048) [1.2 MB] || Halloween_Sun_2014_1k.jpg (1024x1024) [209.2 KB] || Halloween_Sun_2014_2k_print.jpg (1024x1024) [185.7 KB] || Halloween_Sun_2014.jpg (4096x4096) [3.3 MB] || Halloween_Sun_2014_web.jpg (320x320) [26.3 KB] || Halloween_Sun_2014_2k_searchweb.png (320x180) [86.1 KB] || Halloween_Sun_2014_2k_thm.png (80x40) [8.8 KB] || Halloween_Sun_2014_2k.tiff (2048x2048) [32.0 MB] || Halloween_Sun_2014.tiff (4096x4096) [128.0 MB] ||
- ID: 11291 Produced Video
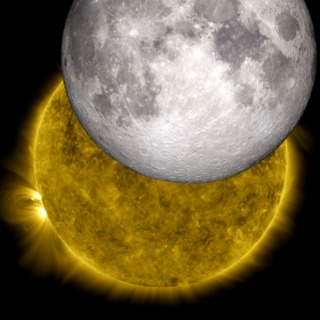
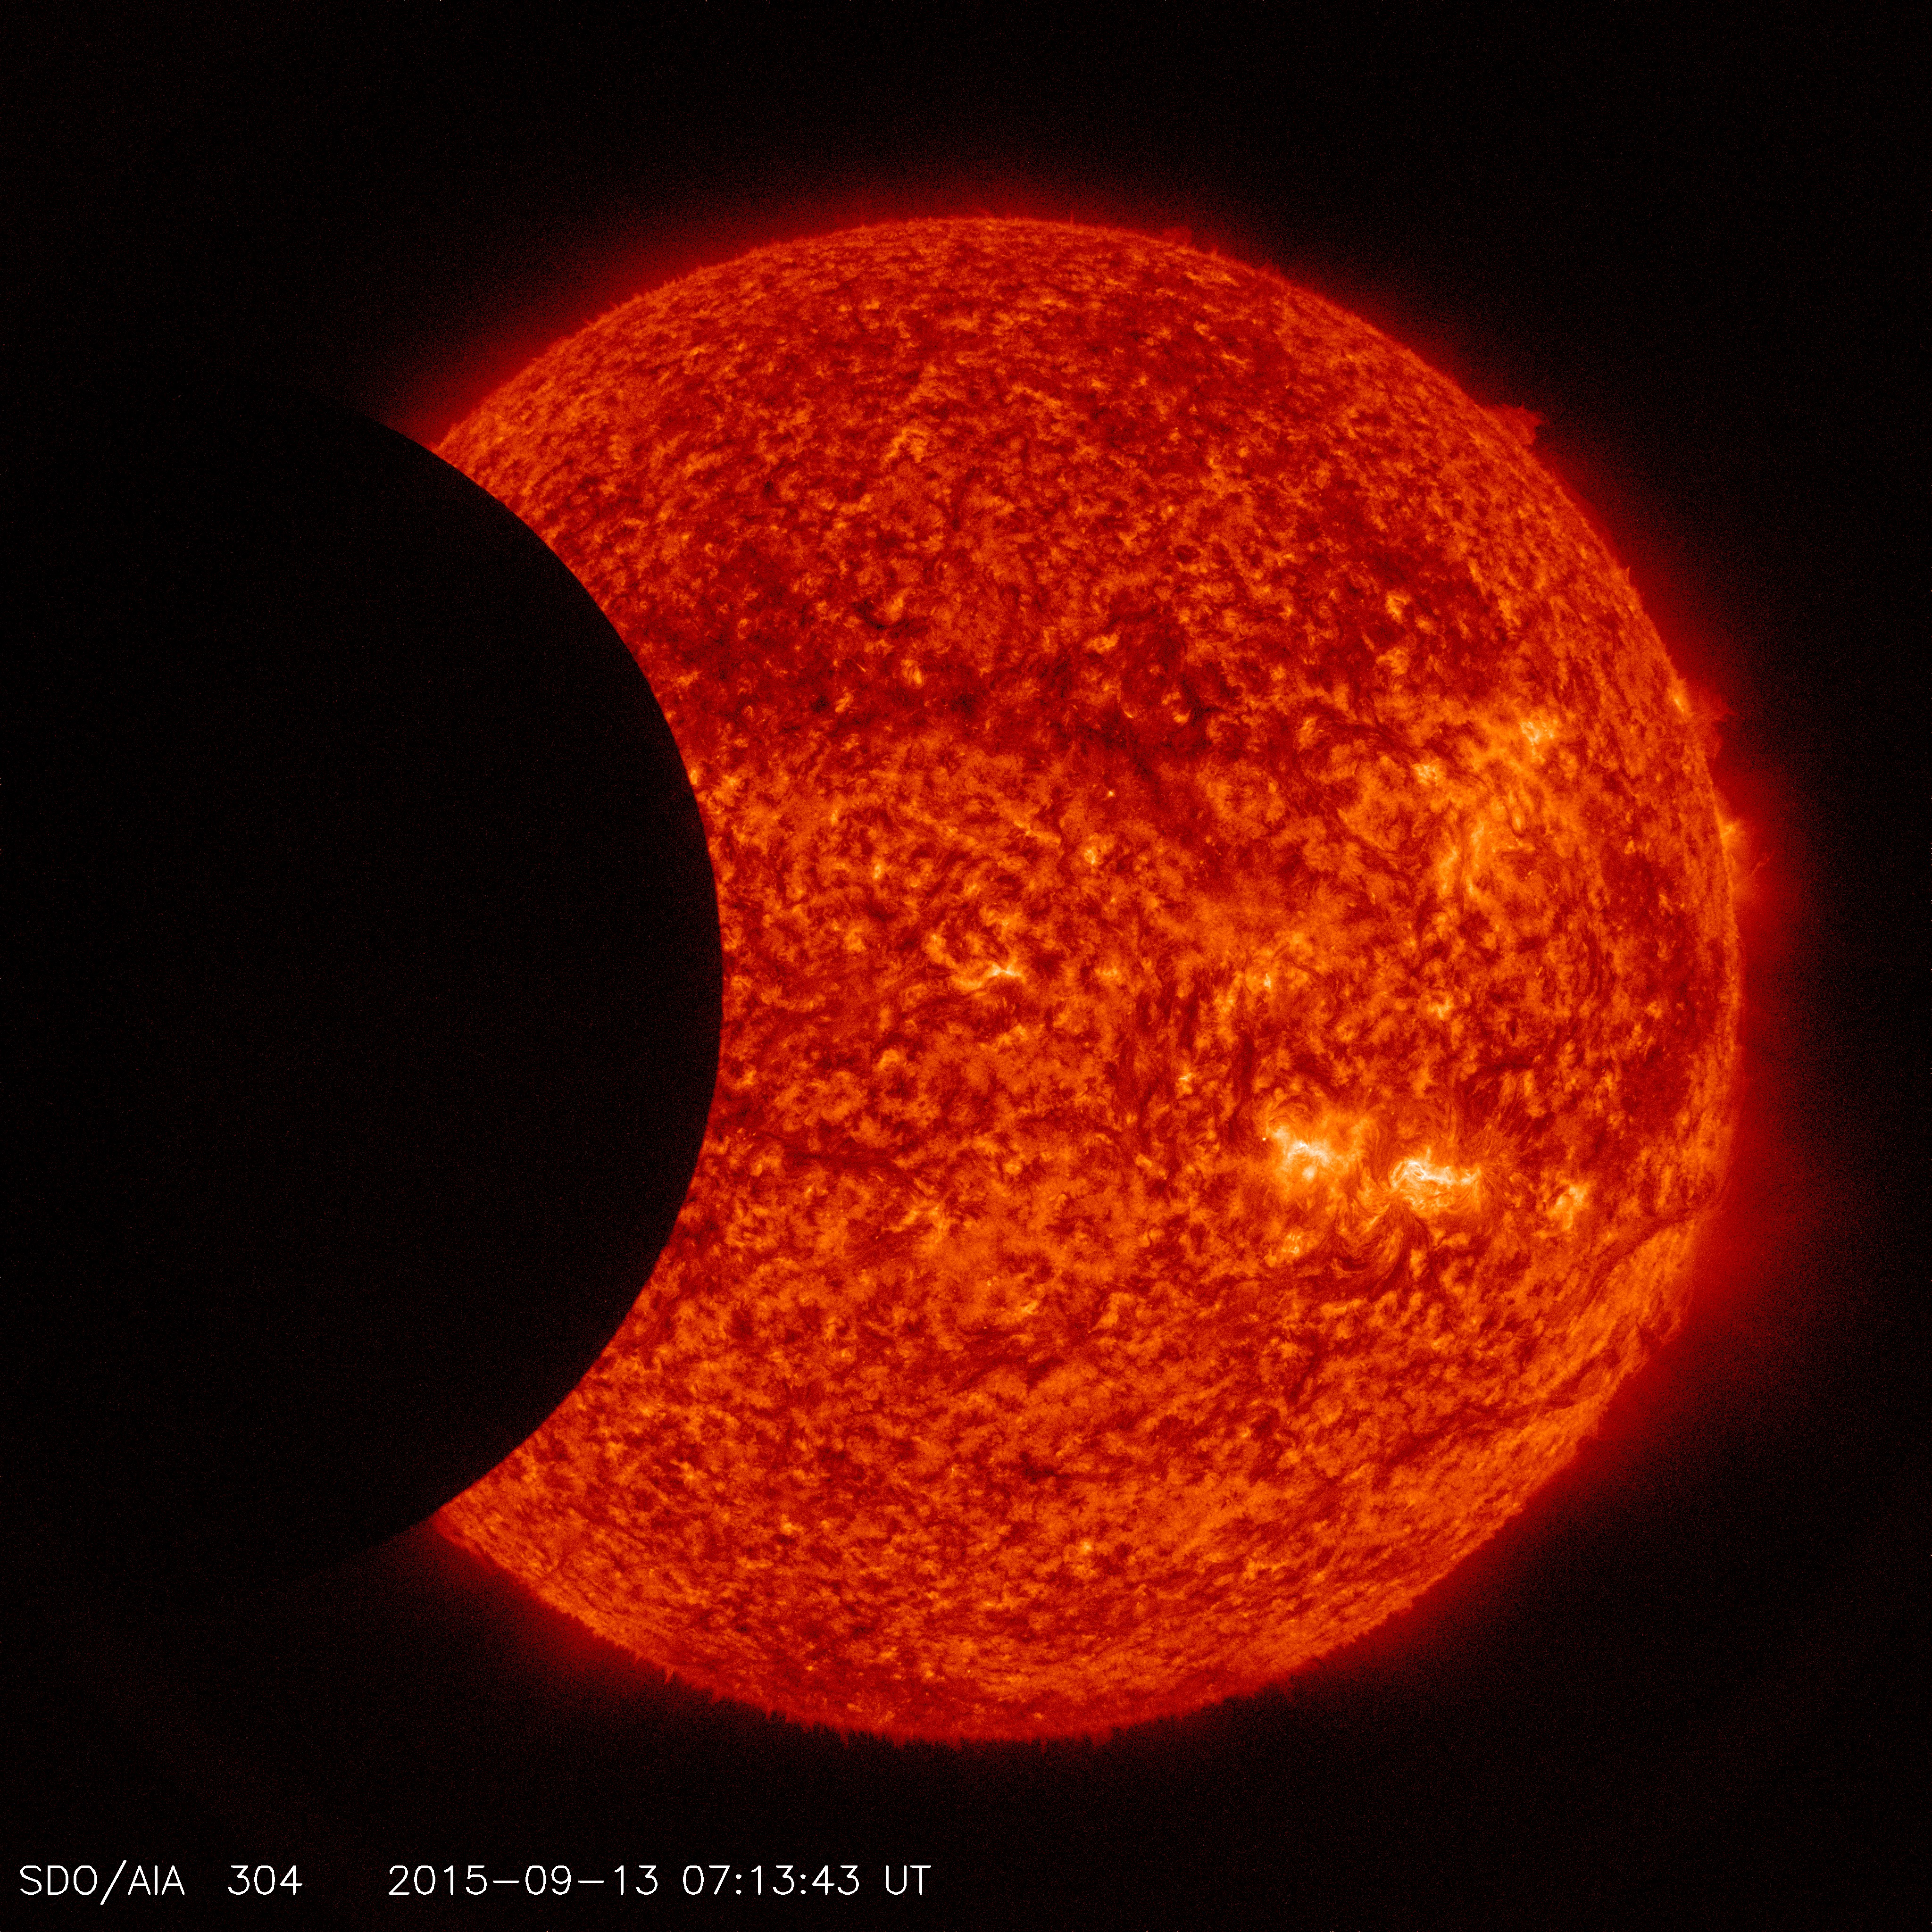
The Moon and the Sun: Two NASA Missions Join Their Images
Go to this pageTwo or three times a year, NASA’s Solar Dynamics Observatory observes the moon traveling across the sun, blocking its view. While this obscures solar observations for a short while, it offers the chance for an interesting view of the shadow of the moon. The moon’s crisp horizon can be seen up against the sun, since the moon does not have an atmosphere. (At other times of the year, when Earth blocks SDO’s view, the Earth’s horizon looks fuzzy due to its atmosphere.) If one looks closely at such a crisp border, the features of the moon’s topography are visible, as is the case in this image from Oct. 7, 2010. This recently inspired two NASA visualizers to overlay a 3-dimensional model of the moon based on data from NASA’s Lunar Reconnaissance Orbiter into the shadow of the SDO image. Such a task is fairly tricky, as the visualizers — Scott Wiessinger who typically works with the SDO imagery and Ernie Wright who works with the LRO imagery — had to precisely match up data from the correct time and viewpoint for the two separate instruments. The end result is an awe-inspiring image of the sun and the moon. To start the process, the visualizers took the viewing position and time from the SDO image. This information was dropped into an LRO model that can produce the exact view of the moon from anywhere, at any time, by incorporating 6 billion individual measurements of the moon’s surface height from LRO’s Lunar Orbiter Laser Altimeter instrument. The model had to take many factors into consideration, including not only SDO’s distance and viewing angle, but also the moon’s rotation and constant motion. Wright used animation software to wrap the elevation and appearance map around a sphere to simulate the moon. The two images were put together and the overlay was exact. The mountains and valleys on the horizon of the LRO picture fit right into the shadows seen by SDO. In its own way, this served as a kind of calibration of data. It means that the SDO data on its position and time is highly accurate and that the LRO models, too, are able to accurately provide images of what’s happening at any given moment in time. And of course, the whole exercise provides for a beautiful picture. ||
- ID: 40359 Gallery
Additional Resources
- ID: 12613 Produced Video
SDO 4k Slow-rotation Sun Resource Page
Go to this pageStill Image for page || SDO_Slow_Gallery.jpg (1920x1080) [235.4 KB] || SDO_Slow_Gallery_searchweb.png (320x180) [43.0 KB] || SDO_Slow_Gallery_thm.png (80x40) [3.6 KB] ||
- ID: 14126 Produced Video
SDO Video Toolkit
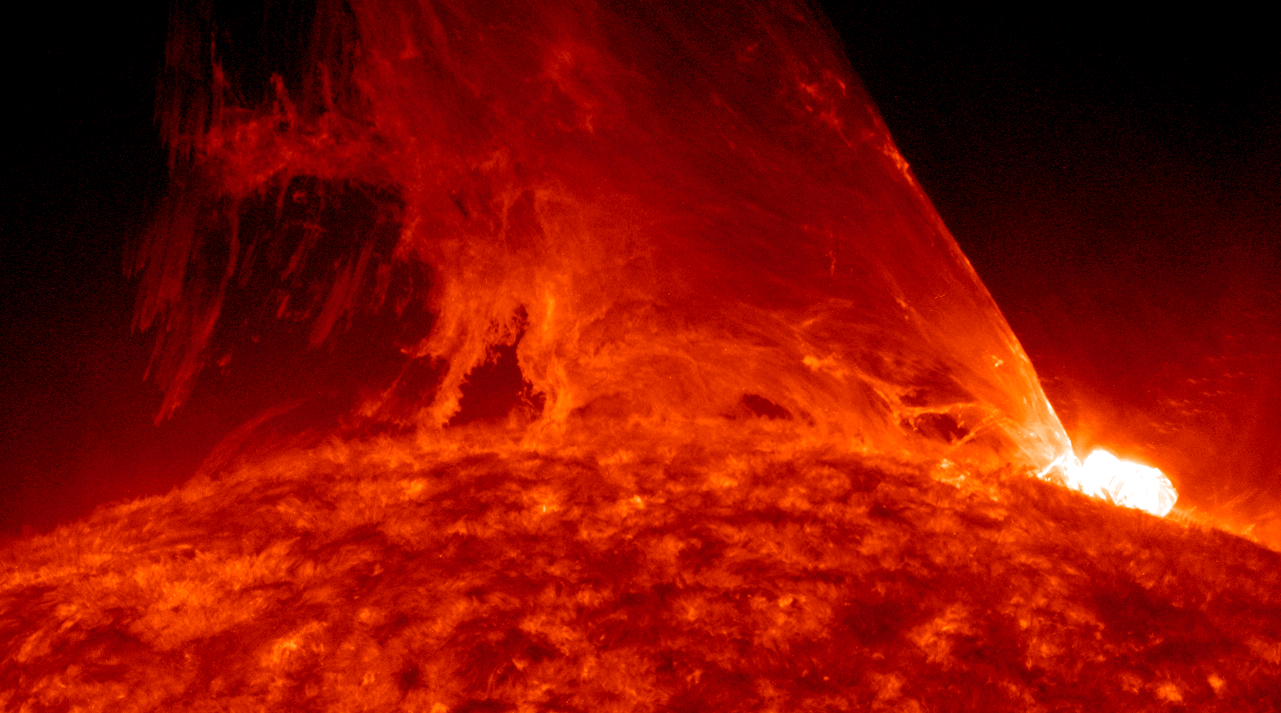
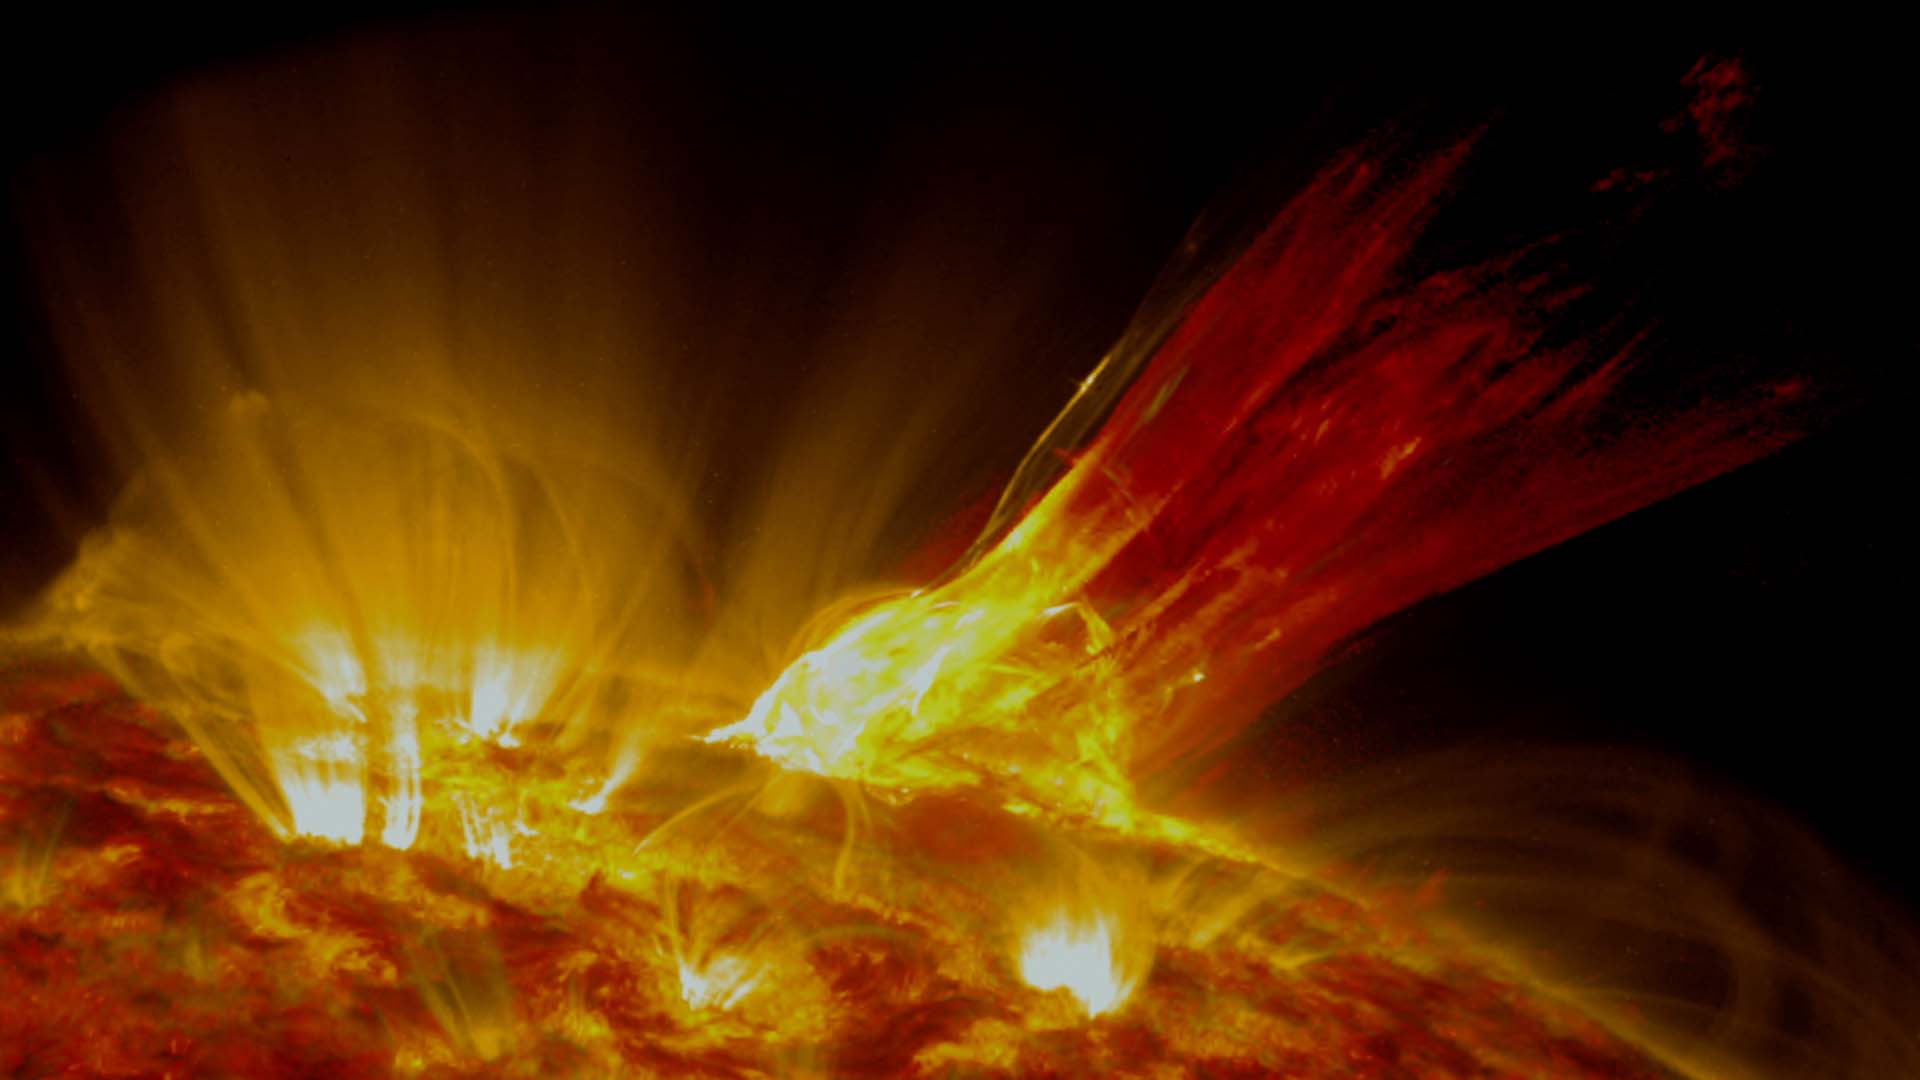
Go to this pageThe Trebuchet eruption (upper left) as seen in the SDO AIA 304 angstrom filter. This is probably one of the more popular views of the event.4k source files || New_Trebuchet_mkII.00300_print.jpg (1024x576) [336.5 KB] || New_Trebuchet_mkII.00300_print_searchweb.png (320x180) [95.4 KB] || New_Trebuchet_mkII.00300_print_thm.png (80x40) [6.2 KB] || New_Trebuchet_mkII.mp4 (1920x1080) [32.4 MB] || New_Trebuchet_mkII.webm (1920x1080) [3.7 MB] || New_Trebuchet_mkII.mov (1920x1080) [443.3 MB] || New_Trebuchet_mkII.mp4.hwshow [115 bytes] ||
- ID: 40358 Gallery
- ID: 40356 Gallery
 Link
Link- ID: 40069 Gallery
SDO First Light
Go to this pageThese are "First Light" release movies for Solar Dynamics Observatory (SDO) from April 11, 2010. For more information about SDO, visit the SDO web site @ NASA.gov.
- ID: 12614 Produced Video
SDO Anniversary Series
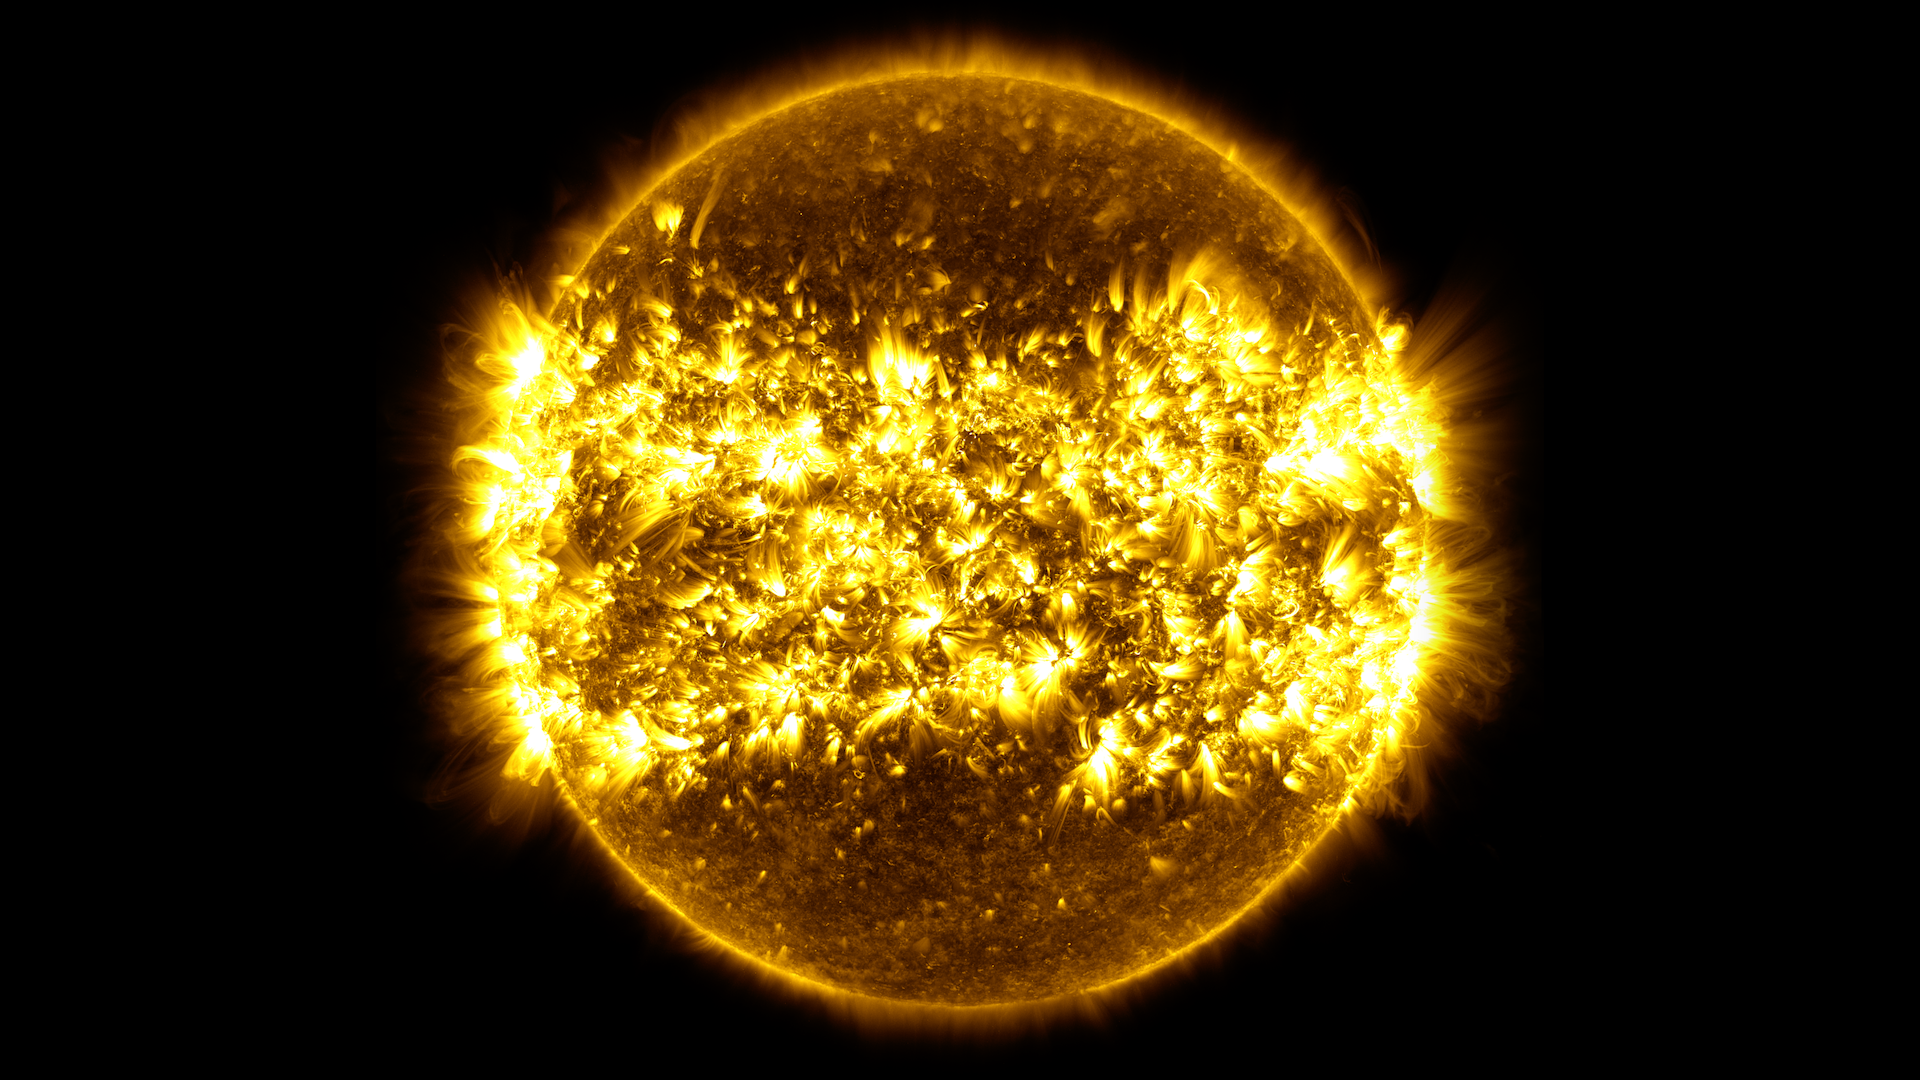
Go to this pageThe sun is always changing and NASA's Solar Dynamics Observatory is always watching. Launched on Feb. 11, 2010, SDO keeps a 24-hour eye on the entire disk of the sun, with a prime view of the graceful dance of solar material coursing through the sun's atmosphere, the corona.Year 1 ||
- ID: 13420 Produced Video
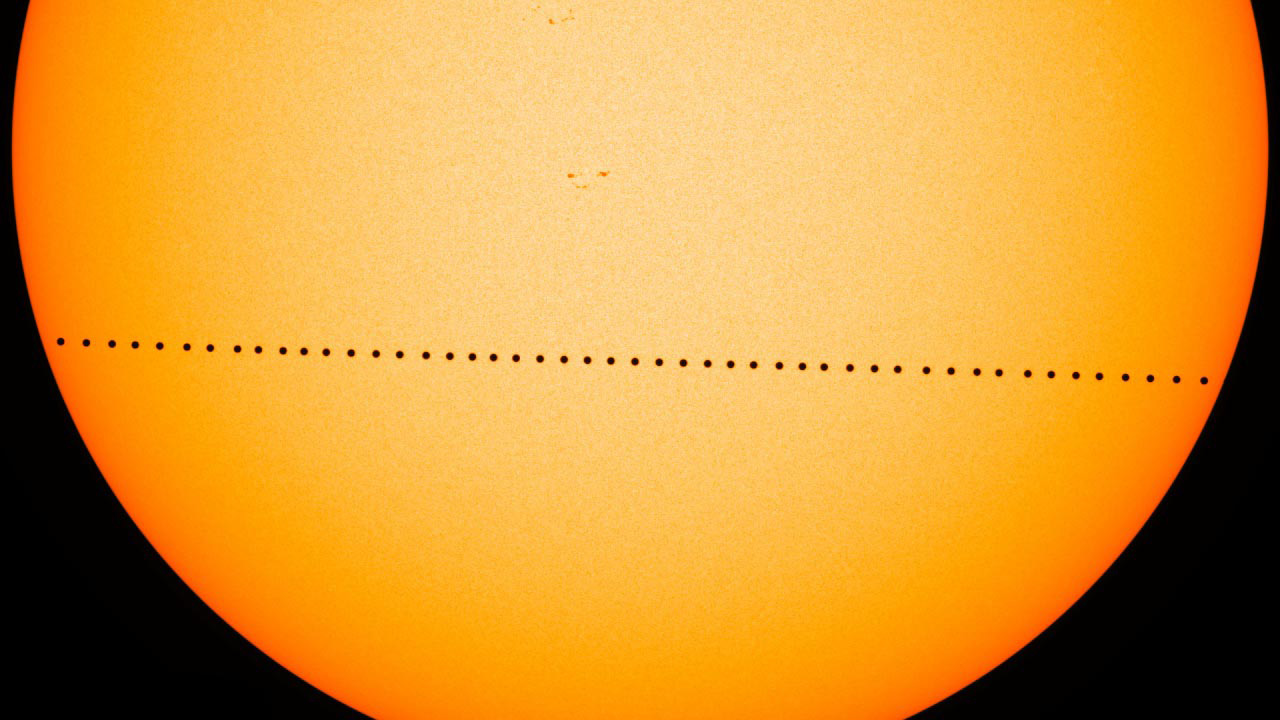
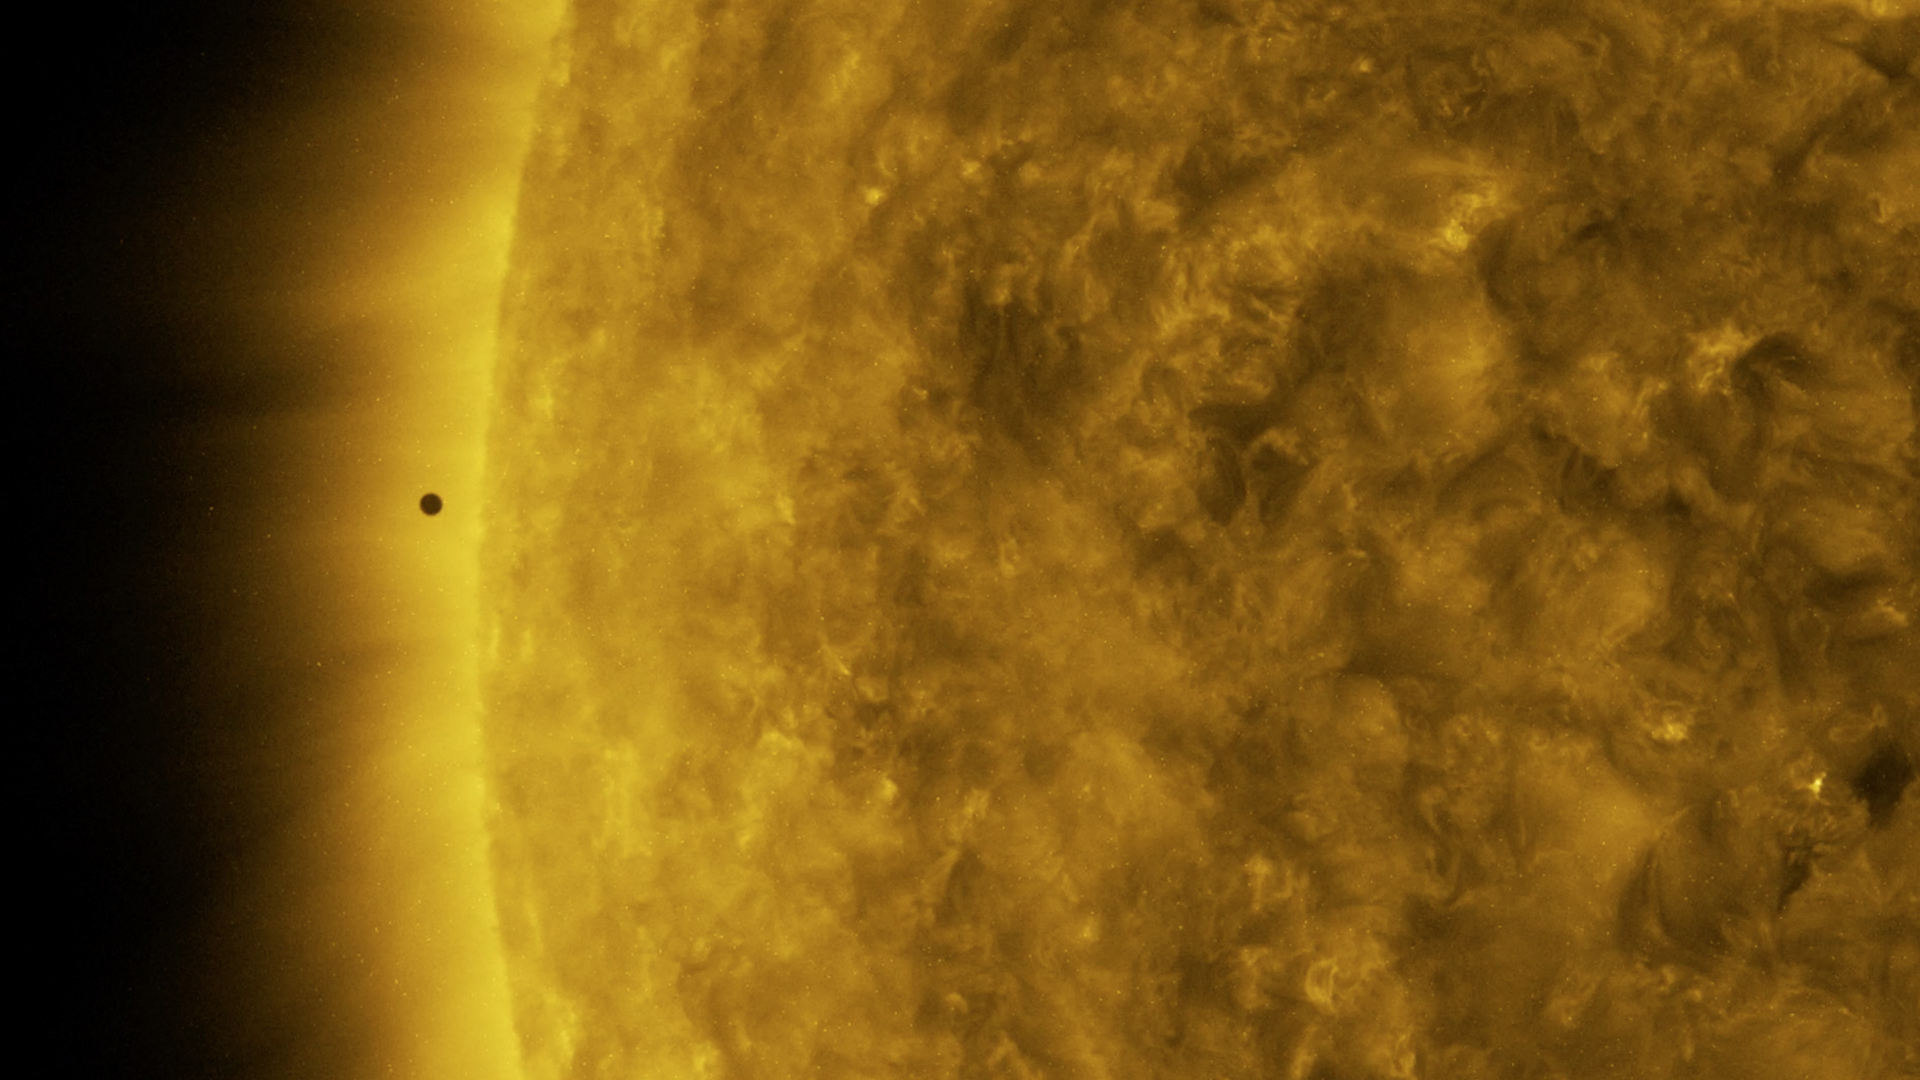
Watch Mercury Glide Across the Sun in Near Real Time
Go to this pageQuick link for B-ROLL for Mercury transit interviews.Quick link for AUDIO interview with Dr. Padi Boyd.Quick link for canned interview with Dr. Padi Boyd.Quick link for canned interview with Dr. Alex Young looking off camera. Just in! Mercury begins it's TRANSIT here on Monday, Nov. 11!! Quick link to canned interview in Spanish with NASA Scientst Teresa Nieves-Chinchilla.Click here to watch the Solar Dynamics Observatory's view of the transit. || Mercury_Transit.jpg (1280x720) [203.3 KB] || Mercury_Transit_print.jpg (1024x576) [187.0 KB] || Mercury_Transit_searchweb.png (320x180) [74.6 KB] || Mercury_Transit_web.png (320x180) [74.6 KB] || Mercury_Transit_thm.png (80x40) [4.4 KB] || watch-mercury-glide-across-the-sun-in-near-real-time.hwshow [252 bytes] ||