A newer version of this visualization is available.
Active Fires As Observed by VIIRS, 2020
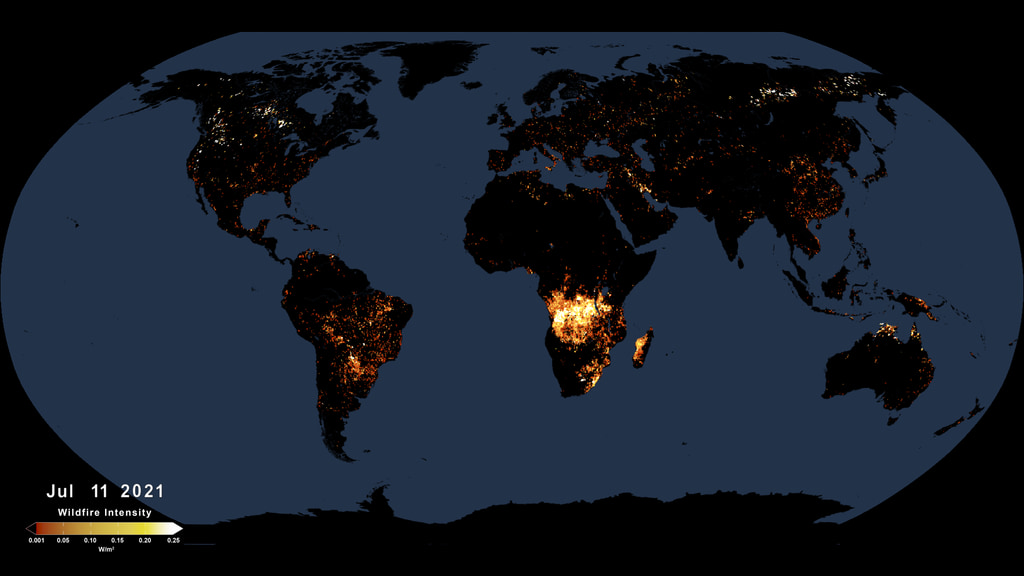
This animated visualization uses a moving three-day average of measured fire radiative power (FRP), summing the 375 m resolution data into one-quarter degree bins, to present a view of fire intensities around the globe.
This visualization shows active fires as observed by the Visible Infrared Imaging Radiometer Suite, or VIIRS, during 2020. The VIIRS instrument flies on the Joint Polar Satellite System’s Suomi-NPP and NOAA-20 polar-orbiting satellites. Instruments on polar orbiting satellites typically observe a wildfire at a given location a few times a day as they orbit the Earth from pole to pole. VIIRS detects hot spots at a resolution of 375 meters per pixel, which means it can detect smaller, lower temperature fires than other fire-observing satellites. Its observations are about three times more detailed than those from the MODIS instrument, for example. VIIRS also provides nighttime fire detection capabilities through its Day-Night Band, which can measure low-intensity visible light emitted by small and fledgling fires.

This still image shows the cumulative FRP over the year 2020, summing the 375 m resolution data into one-quarter degree bins, in a Robinson projection.
This still image shows the cumulative FRP over the year 2020, summing the 375 m resolution data into one-quarter degree bins, in a Mollweide projection.
This animated visualization uses a moving three-day average of measured fire radiative power (FRP), summing the 375 m resolution data into one-quarter degree bins, to present a view of fire intensities in North America.
Credits
Please give credit for this item to:
NASA's Scientific Visualization Studio
-
Visualizer
- Trent L. Schindler (USRA)
-
Scientists
-
Doug C. Morton
(NASA/GSFC)

-
Lesley Ott
(NASA/GSFC)
-
Doug C. Morton
(NASA/GSFC)
-
Writer
- Jenny Marder Fadoul (Telophase)
Datasets used
-
BMNG (Blue Marble: Next Generation) [Terra and Aqua: MODIS]
ID: 508Credit: The Blue Marble data is courtesy of Reto Stockli (NASA/GSFC).
This dataset can be found at: http://earthobservatory.nasa.gov/Newsroom/BlueMarble/
See all pages that use this dataset -
Fire Pixels [Suomi NPP: VIIRS]
ID: 1053
Note: While we identify the data sets used on this page, we do not store any further details, nor the data sets themselves on our site.
Related
- ID: 13263
Newer Versions
- ID: 4945
Used as a Source In
- ID: 13799
![Music: Organic Machine by Bernhard Hering [GEMA] and Matthias Kruger [GEMA]Complete transcript available.](/vis/a010000/a013700/a013799/2020Temp.png) Produced Video
Produced Video
Release date
This page was originally published on Thursday, April 8, 2021.
This page was last updated on Monday, January 6, 2025 at 12:18 AM EST.