Historical Atlantic Multidecadal Oscillation (AMO)
Visualization of Sea Surface Temperature (SST) Anomaly with corresponding timeplot tracking the Atlantic Multidecadal Oscillation (AMO) Index over the North Atlantic (0-80N) for the period of 1900-2005.
 Smooth Index for the period 1861-2015. The still image is provided with transparency.")
Atlantic Multidecadal Oscillation (AMO) Smooth Index for the period 1861-2015. The still image is provided with transparency.
Data Sources:
- Atlantic Mutlidecadal Oscillation (AMO) Index. The AMO Index is a monthly index of the North Atlantic temperatures from 1856 to present. This data visualization utilized the smoothed, long version of the AMO index. The data is available here: https://psl.noaa.gov/data/timeseries/AMO/
- Extended Reconstructed Sea Surface Temperature (ERSST) v5 (global monthly dataset). Data Citation: Boyin Huang, Peter W. Thorne, Viva F. Banzon, Tim Boyer, Gennady Chepurin, Jay H. Lawrimore, Matthew J. Menne, Thomas M. Smith, Russell S. Vose, and Huai-Min Zhang (2017): NOAA Extended Reconstructed Sea Surface Temperature (ERSST), Version 5. [Subset used: 1854-2020]. NOAA National Centers for Environmental Information. doi: 10.7289/V5T72FNM. [access date: February 2020].
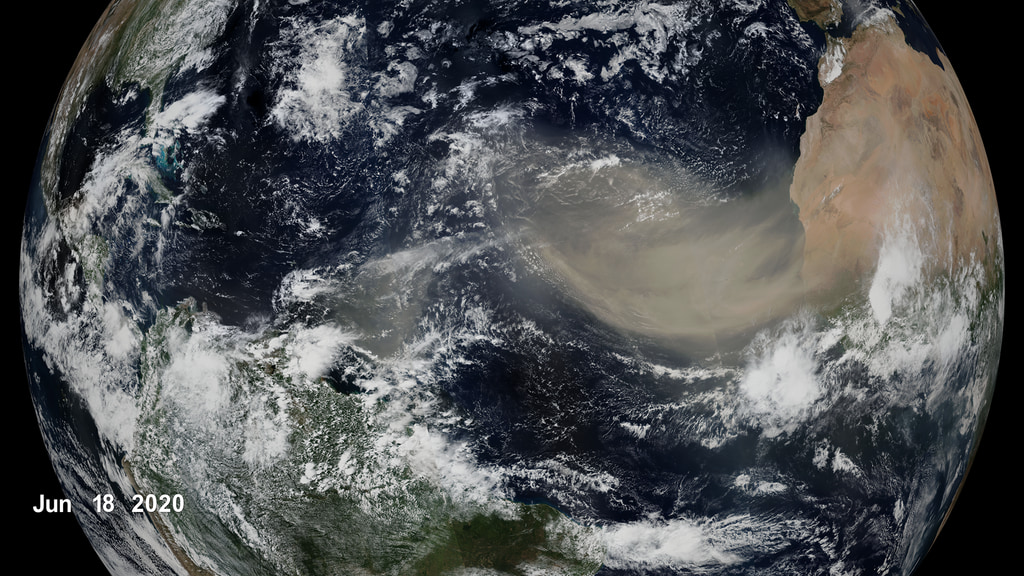
For the purposes of this visualization the science team derived Sea Surface Temperature Anomaly (from ERSST v5) for the North Atlantic region (0-80N) for the period 1900-2005. - Blue Marble: Next Generation was produced by Reto Stöckli, NASA Earth Observatory (NASA Goddard Space Flight Center). Citation: Reto Stöckli, Eric Vermote, Nazmi Saleous, Robert Simmon and David Herring.
The Blue Marble Next Generation – A true color earth dataset including seasonal dynamics from MODIS, October 17, 2005. - Global 30 Arc-Second Elevation (GTOPO 30) from USGS. doi: 10.5066/F7DF6PQS
The rest of this webpage offers additional versions, frames, layers and colorbar information, associated with the development of this data-driven visualization.
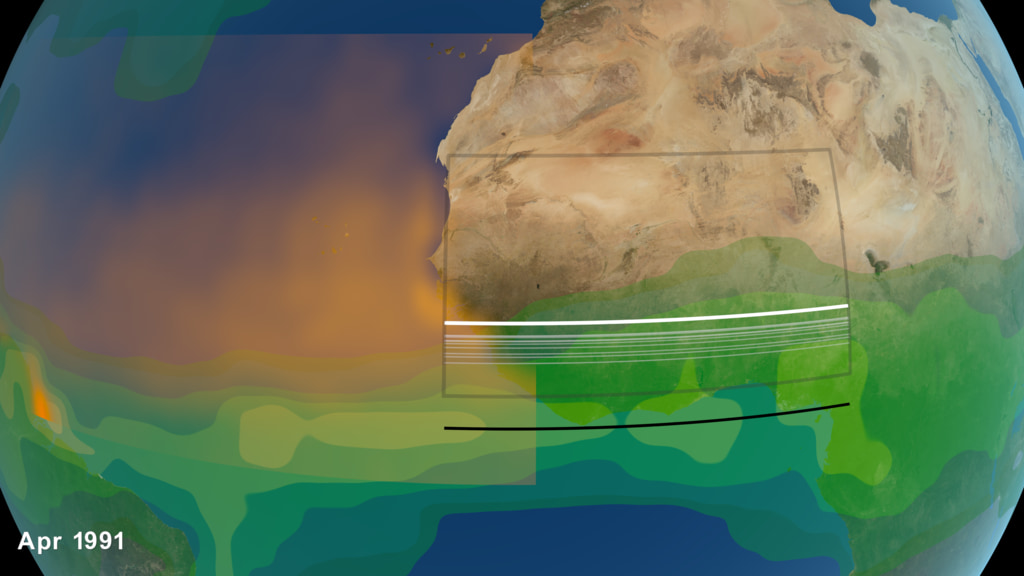
Visualization of historical Sea Surface Temperature (SST) Anomaly for the period 1900-2005. The gray inset highlights the Atlantic Multidecadal Oscillation (AMO) region over the North Atlantic with extents 0-80N.
Frames of Sea Surface Temperature (SST) Anomaly averaged for the period 1900-2005. The gray inset indicates the Atlantic Multidecadal Oscillation (AMO) Region in the North Atlantic, with extents 0-80N. This set of frames serves as a layer and is provided with transparency.
This set of frames provides the dates layer. Frames are provided with transparency.
This set of frames provides the animated timeplot for the period 1900-2005. The timeplot visualizes the smoothed Atlantic Multidecadal Oscillation (AMO) Index over the region in the North Atlantic with extents 0-80N.
Frames include the labels of Cool and Warm Phases to highlight the pattern and duration of events during the period 1900-2005. Frames are provided with transparency.
Title of the visualization sequence. The still image is provided with transparency.
Atlantic Multidecadal Oscillation (AMO) Smooth Index for the period 1861-2015. The still image is provided with transparency.
For More Information
See NASA.gov
Credits
Please give credit for this item to:
NASA's Scientific Visualization Studio
-
Visualizer
-
Helen-Nicole Kostis
(USRA)

-
Helen-Nicole Kostis
(USRA)
-
Scientists
- Tianle Yuan (UMBC)
- Hongbin Yu (JCET UMBC)
- Mian Chin (NASA/GSFC)
- Lorraine Remer (NASA/GSFC)
- David McGee (MIT)
- Amato Evan (University of California, San Diego)
- Mark Zelinka (Lawrence Livermore National Laboratory)
- Joel Norris (University of California, San Diego)
- Lazaros Oreopoulos (NASA/GSFC)
- Kerry G. Meyer (NASA/GSFC)
- Steven Platnick (NASA/GSFC)
-
Producers
- Kathryn Mersmann (USRA)
- Lara Streiff (GSFC Interns)
-
Writer
- Ellen T. Gray (ADNET Systems, Inc.)
-
Technical support
- Laurence Schuler (ADNET Systems, Inc.)
- Ian Jones (ADNET Systems, Inc.)
-
Project support
- Eric Sokolowsky (Global Science and Technology, Inc.)
- Leann Johnson (Global Science and Technology, Inc.)
Related papers
Yuan T, Yu H, Chin M, Remer LA, McGee D, Evan A. Anthropogenic Decline of African Dust: Insights From the Holocene Records and Beyond. Geophysical research letters. 2020 Nov 28;47(22):e2020GL089711. doi:10.1029/2020GL089711
Yuan T, Oreopoulos L, Zelinka M, Yu H, Norris JR, Chin M, Platnick S, Meyer K. Positive low cloud and dust feedbacks amplify tropical North Atlantic Multidecadal Oscillation. Geophysical Research Letters. 2016 Feb 16;43(3):1349-56. doi:10.1002/2016GL067679
Datasets used
-
GTOPO30 Topography and Bathymetry
ID: 274 -
BMNG (Blue Marble: Next Generation) [Terra and Aqua: MODIS]
ID: 508Credit: The Blue Marble data is courtesy of Reto Stockli (NASA/GSFC).
This dataset can be found at: http://earthobservatory.nasa.gov/Newsroom/BlueMarble/
See all pages that use this dataset -
AMO Index (Atlantic Multidecadal Oscillation (AMO) Index)
ID: 1114This dataset can be found at: https://psl.noaa.gov/data/timeseries/AMO/
See all pages that use this dataset -
ERSST v5 (Extended Reconstructed Sea Surface Temperature (ERSST) v5)
ID: 1115This dataset can be found at: https://www.ncei.noaa.gov/access/metadata/landing-page/bin/iso?id=gov.noaa.ncdc:C00927
See all pages that use this dataset
Note: While we identify the data sets used on this page, we do not store any further details, nor the data sets themselves on our site.
Related
- ID: 4849
 Visualization
 - ID: 4896
Used as a Source In
- ID: 13839
![Music: Dawn Drone by Juan Jose Alba Gomez [SGAE]Complete transcript available.](/vis/a010000/a013800/a013839/Thumbnail_print.jpg)
Release date
This page was originally published on Monday, April 19, 2021.
This page was last updated on Monday, January 6, 2025 at 12:18 AM EST.