Godzilla Dust Storm
Visualization of the Godzilla Dust Storm during June 2020.
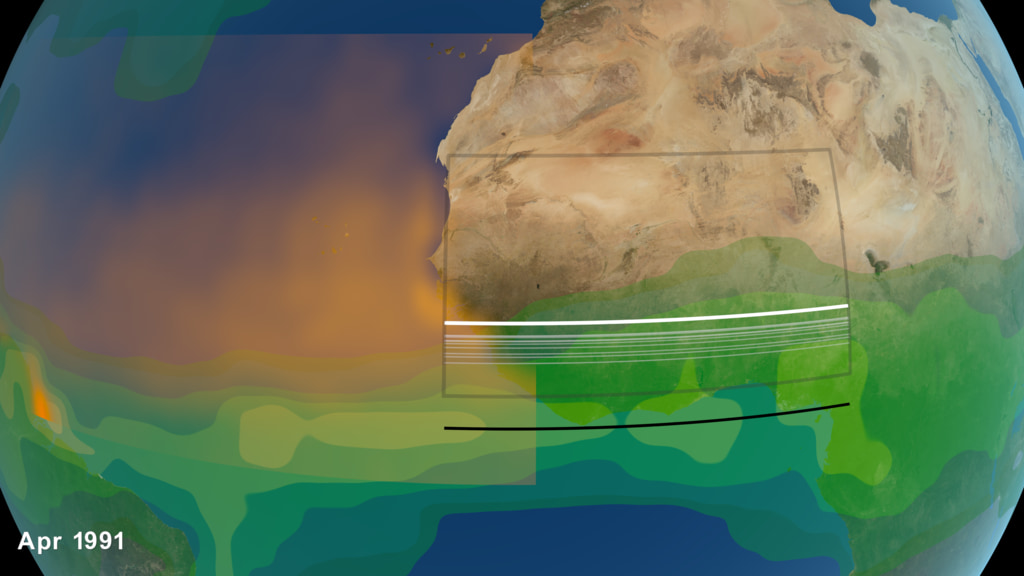
Visualization of the Godzilla Dust Storm during June 2020. This sequence observes the dust storm from West Africa.
In June 2020, a "Godzilla" dust plume travelled from the Sahara, the planet’s largest, hottest desert, across the Atlantic ocean to North America. Saharan dust plumes are a natural phenomenon and occur especially during the summertime, due to dust uplift from low level jets and haboobs. This particular event was nicknamed "Godzilla" dust plume, because of its huge extent and massive amount of dust transport - the most intense episode over the past two decades.
The data visualizations included on this webpage track the "Godzilla" dust plume by featuring near real-time VIIRS Corrected Reflectance (True Color) daily imagery for the month of June 2020. The first visualization listed on this webpage showcases the trans-Atlantic transport of the dust plume, while the second visualization showcases the formation of the dust plume as seen from West Africa.
The Sahara Desert is 3,600,000 square miles (9,200,000 square kilometers) of arid land stretched across the northern half of Africa, coming in just slightly smaller in size than the continental United States. Upwards of 60 million tons of its nutrient-laden sand and soil are lifted into the atmosphere each year, creating a massive layer of hot, dusty air that winds carry across the Atlantic to deliver those nutrients to the ocean and vegetation in South America and the Caribbean.
On its journey across the Atlantic, Saharan dust sprinkles into the ocean, feeding the marine life, and similarly plant life once it makes landfall. Minerals like iron and phosphorus in the dust act as a fertilizer for the Amazon rainforest, Earth’s largest and most biodiverse tropical forest, whose rains otherwise wash many of these valuable nutrients into the Amazon river basin.
Tracking and understanding dust plumes and their effects is critical, since dust intrusion also affects air quality. The “Godzilla” dust plume degraded the air quality in the Carribean Basin to the hazardous level and the dust intrusion into the U.S. exceeded the EPA air quality in about 40% of the stations in Southern U.S. Breathing in dust is particularly hazardous for children, the elderly, and those with respiratory conditions like asthma. Because of this, the Moderate Resolution Imaging Spectroradiometers (MODIS) on NASA's Terra and Aqua satellites, the National Oceanic and Atmospheric Administration (NOAA) GOES-16 (EAST) satellite, and the Visible Infrared Imaging Radiometer Suite (VIIRS) on the joint NASA/NOAA Suomi NPP satellite are employed to help detect dust plumes, so that at-risk communities could prepare for the potentially adverse health effects.
Data Sources:
- Suomi NPP/VIIRS Corrected Reflectance (True Color). The Visible Infrared Imaging Radiometer Suite (VIIRS) Corrected Reflectance imagery is available only as near real-time imagery. The VIIRS instrument in on board the joint NASA/NOAA Suomi National Polar orbiting Partnership (Suomi NPP) satellite. Imagery resolution is 250m, and the temporal resolution is daily. Suomi NPP/VIIRS True Color imagery was used for the following dates:
1-2, 4-11, 12-30 June 2020 - NOAA-20/VIIRS Corrected Reflectance (True Color). The Visible Infrared Imaging Radiometer Suite (VIIRS) Corrected Reflectance imagery is available only as near real-time imagery. The VIIRS instrument is aboard the joint NASA/NOAA NOAA-20 (JPSS-1) satellite. Imagery resolution is 250m, and the temporal resolution is daily. NOAA-20/VIIRS True Color imagery was used for the following dates:
1, 3, 11, 19 June 2020
For the purposes of this visualization sun glint was partially removed from the near-real time VIIRS True Color imagery.
We acknowledge the use of imagery provided by services from NASA's Global Imagery Browse Services (GIBS), part of NASA's Earth Observing System Data and Information System (EOSDIS).
The rest of this webpage offers visual content in layers.

Frames of Earth imagery of the Godzilla Dust Storm visualization. Images are provided with transparency.
This set of frames provides the dates layer. Frames are provided with transparency.
Frames of the Earth layer for the Godzilla Dust Storm visualization, as seen from West Africa. Frames are provided with transparency.
This set of frames provides the dates layer for the visualization sequence of the Godzilla Dust Storm, as seen from West Africa. Frames are provided with transparency.
For More Information
See NASA.gov
Credits
Please give credit for this item to:
NASA's Scientific Visualization Studio.
We acknowledge the use of imagery provided by services from NASA's Global Imagery Browse Services (GIBS), part of NASA's Earth Observing System Data and Information System (EOSDIS).
-
Visualizer
- Helen-Nicole Kostis (USRA)
-
Technical directors
- Greg Shirah (NASA/GSFC)
- Kel Elkins (USRA)
-
Scientists
- Tianle Yuan (UMBC)
- Hongbin Yu (JCET UMBC)
-
Producers
- Kathryn Mersmann (USRA)
- Lara Streiff (GSFC Interns)
-
Writer
- Ellen T. Gray (ADNET Systems, Inc.)
-
Technical support
- Laurence Schuler (ADNET Systems, Inc.)
- Ian Jones (ADNET Systems, Inc.)
-
Project support
- Eric Sokolowsky (Global Science and Technology, Inc.)
- Leann Johnson (Global Science and Technology, Inc.)
Release date
This page was originally published on Monday, April 19, 2021.
This page was last updated on Monday, July 15, 2024 at 12:08 AM EDT.
Papers used in this visualization
Yu, H., Tan, Q., Zhou, L., Zhou, Y., Bian, H., Chin, M., Ryder, C. L., Levy, R. C., Pradhan, Y., Shi, Y., Song, Q., Zhang, Z., Colarco, P. R., Kim, D., Remer, L. A., Yuan, T., Mayol-Bracero, O., and Holben, B. N.: Observation and modeling of a historic African dust intrusion into the Caribbean Basin and the southern U.S. in June 2020, Atmos. Chem. Phys. Discuss. [preprint], https://doi.org/10.5194/acp-2021-73, 2021.
Yu, H., Tan, Q., Zhou, L., Zhou, Y., Bian, H., Chin, M., Ryder, C. L., Levy, R. C., Pradhan, Y., Shi, Y., Song, Q., Zhang, Z., Colarco, P. R., Kim, D., Remer, L. A., Yuan, T., Mayol-Bracero, O., and Holben, B. N.: Observation and modeling of a historic African dust intrusion into the Caribbean Basin and the southern U.S. in June 2020, Atmos. Chem. Phys. Discuss. [preprint], https://doi.org/10.5194/acp-2021-73, 2021.
Datasets used in this visualization
-
Suomi NPP/VIIRS Corrected Reflectance (True Color)
ID: 1116Credit: We acknowledge the use of imagery provided by services from NASA's Global Imagery Browse Services (GIBS), part of NASA's Earth Observing System Data and Information System (EOSDIS).
This dataset can be found at: https://earthdata.nasa.gov/earth-observation-data/near-real-time/download-nrt-data/viirs-nrt
See all pages that use this dataset -
NOAA-20/VIIRS Corrected Reflectance (True Color)
ID: 1117Credit: We acknowledge the use of imagery provided by services from NASA's Global Imagery Browse Services (GIBS), part of NASA's Earth Observing System Data and Information System (EOSDIS).
This dataset can be found at: https://earthdata.nasa.gov/earth-observation-data/near-real-time/download-nrt-data/viirs-nrt
See all pages that use this dataset
Note: While we identify the data sets used in these visualizations, we do not store any further details, nor the data sets themselves on our site.
Related
- ID: 14223

- ID: 4895
 Visualization
 - ID: 4896
Used as a Source In
- ID: 14043
 Produced Video
 - ID: 13839
![Music: Dawn Drone by Juan Jose Alba Gomez [SGAE]Complete transcript available.](/vis/a010000/a013800/a013839/Thumbnail_print.jpg)