Dust Reduction - Intertropical Convergence Zone (ITCZ) Movement
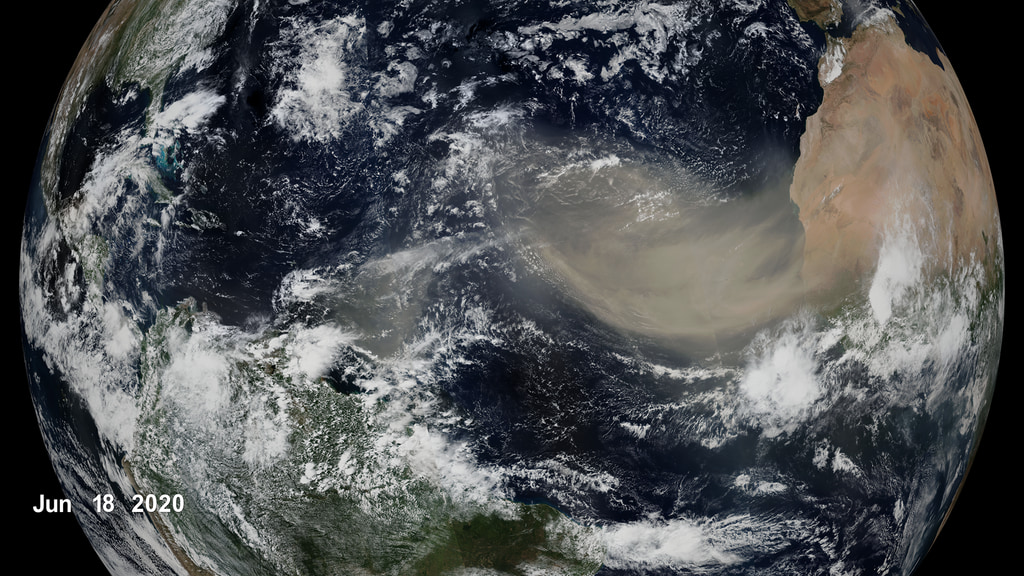
This visualization depicts the northern trend of the Intertropical Convergence Zone (ITCZ). A horizontal black line indicates the current ITCZ centroid for the longitudinal extents of the study region, which moves with GPCP precipitation data. The northernmost extent of the ITCZ is indicated with a thin white line for each year. The bold white line represents the northernmost overall extent. The grey box represents the study region used to calculate the ITCZ centroid. A region of dust optical depth data is shown in orange off the coast of Africa.
Data Sources:
- Global Precipitation Climatology Project (GPCP) - monthly precipitation dataset from 1979-present combines observations and satellite precipitation data into 2.5°x2.5° global grids. GPCP Precipitation data provided by the NOAA/OAR/ESRL PSL, Boulder, Colorado, USA, from their Web site here
- Dust Optical Depth. Evan, A.T. and Mukhopadhyay, S., 2010. African dust over the northern tropical Atlantic: 1955–2008. Journal of Applied Meteorology and Climatology, 49(11), pp.2213-2229.
This visualization depicts the northern trend of the Intertropical Convergence Zone (ITCZ). A horizontal black line indicates the current ITCZ centroid for the longitudinal extents of the study region, which moves with GPCP precipitation data. The northernmost extent of the ITCZ is indicated with a thin white line for each year. The bold white line represents the northernmost overall extent. The grey box represents the study region used to calculate the ITCZ centroid.
Credits
Please give credit for this item to:
NASA's Scientific Visualization Studio
-
Visualizers
-
Kel Elkins
(USRA)

-
Helen-Nicole Kostis
(USRA)
-
Kel Elkins
(USRA)
-
Scientists
- Tianle Yuan (UMBC)
- Hongbin Yu (JCET UMBC)
-
Producer
- Kathryn Mersmann (USRA)
-
Writer
- Ellen T. Gray (ADNET Systems, Inc.)
-
Technical support
- Laurence Schuler (ADNET Systems, Inc.)
- Ian Jones (ADNET Systems, Inc.)
-
Project support
- Eric Sokolowsky (Global Science and Technology, Inc.)
- Leann Johnson (Global Science and Technology, Inc.)
Datasets used
-
GPCP Combined Precipitation
ID: 270
Note: While we identify the data sets used on this page, we do not store any further details, nor the data sets themselves on our site.
Related
- ID: 4849
 Visualization
 - ID: 4895
 Visualization
Used as a Source In
- ID: 13839
![Music: Dawn Drone by Juan Jose Alba Gomez [SGAE]Complete transcript available.](/vis/a010000/a013800/a013839/Thumbnail_print.jpg)
Release date
This page was originally published on Monday, April 19, 2021.
This page was last updated on Monday, January 6, 2025 at 12:18 AM EST.