2019 Total Solar Eclipse Maps and Shapefiles

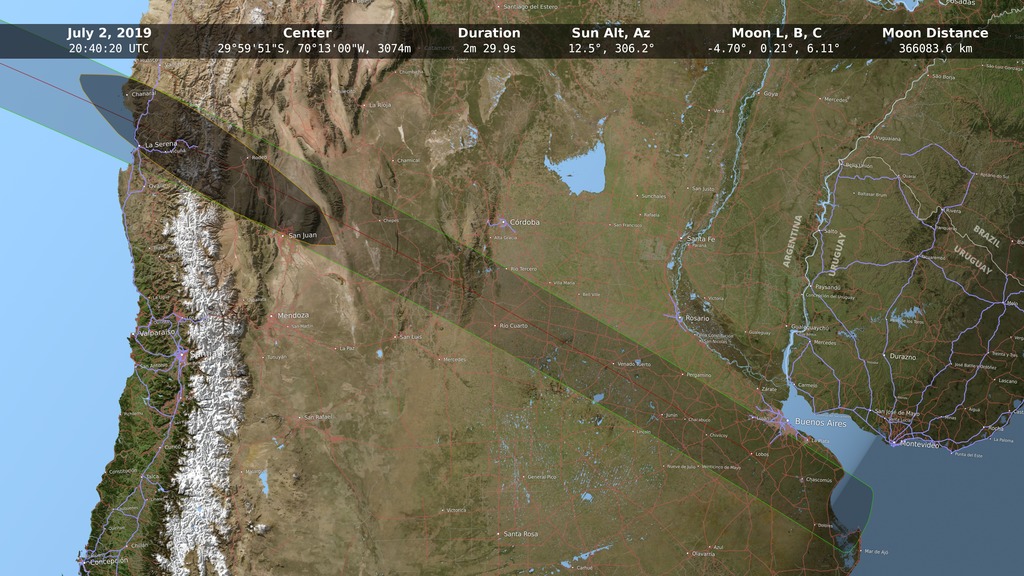
A map of Chile and Argentina showing the path of totality for the July 2, 2019 total solar eclipse.
This map of Chile and Argentina shows the path of the Moon's umbral shadow — the path of totality — during the total solar eclipse on July 2, 2019. Features include national boundaries, major roads, and place names. The umbra is shown at 3-minute intervals labeled in the local time zone of the umbra center (Chile or Argentina standard time). To read about the reason the shapes aren't smooth ovals, go here. At 300 DPI, the scale of the map is approximately 1:4,000,000.
The map uses a number of NASA data products. The land color is based on Blue Marble Next Generation, a global mosaic of MODIS images assembled by NASA's Earth Observatory. Elevations are from SRTM, a radar instrument flown on Space Shuttle Endeavour during the STS-99 mission. Lunar topography, used for precise shadow calculations, is from NASA LRO laser altimetry and JAXA Kaguya stereo imaging. Planetary positions are from the JPL DE421 ephemeris. The lunar limb profile and eclipse calculations are by the visualizer.
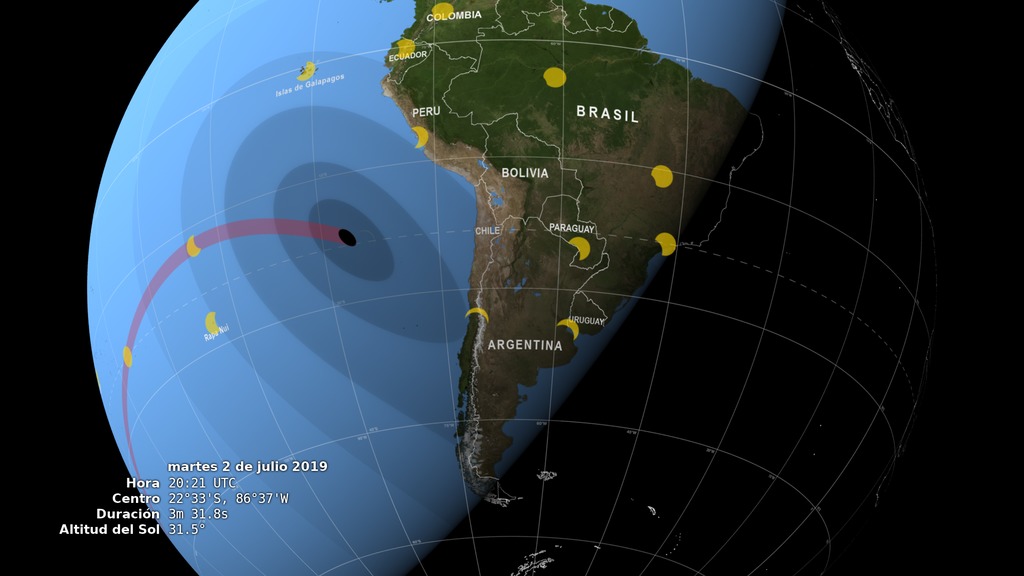
The map below shows the global extent of the shadow path. The umbra is drawn at 10-minute intervals.
A global map of the path of totality for the July 2, 2019 total solar eclipse.
Shapefiles
The map was rendered in animation software, but maps are more typically created using geographic information system (GIS) tools and vector datasets. A set of shapefiles describing the umbra and penumbra extents is provided below in two Zip archives, one for small-scale (global) maps and the other for larger-scale mapping.
The shapes of the umbra and penumbra, provided in ESRI shapefile format suitable for use in GIS software.
eclipse2019_shapefiles.zip contains the following shapefiles:
penum19 contains the contours for maximum obscuration at 5-percent intervals from 95% to 5%, and the penumbra edge at 0%.
w_upath19 contains the complete path of totality.
w_umbra19_1m contains umbra shapes at 1-minute intervals from 18:02 to 20:44 UTC, covering the complete timespan of totality.
w_center19 contains the complete center line.
The projection for all of these shapefiles is WGS84, latitude-longitude, in degrees. A minimal .PRJ file reflecting this projection is included for each shape.
 mapping.")
The umbra, path, and center line in shapefile format for use in GIS software. This shapefile set is intended for larger scale (higher resolution) mapping.
eclipse2019_shapefiles_1s.zip is intended for larger-scale (higher resolution) mapping. It contains the following shapefiles:
umbra19_1s contains 560 umbra shapes at one-second intervals from 20:35:30 to 20:44:49 UTC. These are high-resolution shapes with roughly 100-meter precision. The attributes for each shape include both a string representation of the UTC time and an integer containing the number of seconds past midnight of eclipse day.
upath19 contains the path of totality, limited to the extent of the 560 umbra shapes. Both the path and the umbra shapes are truncated at 75°W.
center19 contains the center line as a polyline with points at one-second intervals.
Credits
Please give credit for this item to:
NASA's Scientific Visualization Studio
-
Visualizer
-
Ernie Wright
(USRA)

-
Ernie Wright
(USRA)
-
Technical support
- Laurence Schuler (ADNET Systems, Inc.)
- Ian Jones (ADNET Systems, Inc.)
-
Producer
- Genna Duberstein (USRA)
-
Programmer
-
Ernie Wright
(USRA)
-
Ernie Wright
(USRA)
Datasets used
-
DEM [SRTM: SIR-C]
ID: 481 -
BMNG (Blue Marble: Next Generation) [Terra and Aqua: MODIS]
ID: 508Credit: The Blue Marble data is courtesy of Reto Stockli (NASA/GSFC).
This dataset can be found at: http://earthobservatory.nasa.gov/Newsroom/BlueMarble/
See all pages that use this dataset -
DEM (Digital Elevation Map) [LRO: LOLA]
ID: 653 -
DE421 (JPL DE421)
ID: 752Planetary ephemerides
This dataset can be found at: http://ssd.jpl.nasa.gov/?ephemerides#planets
See all pages that use this dataset -
SLDEM2015 (DIgital Elevation Model) [LRO/SELENE: LOLA/TC]
ID: 948A digital elevation model of the Moon derived from the Lunar Orbiter Laser Altimeter and the SELENE Terrain Camera. See the description in Icarus. The data is here.
See all pages that use this dataset -
GRIP4 (Global Roads Inventory Project)
ID: 1040Roads database covering 222 countries
Credit: The GRIP4 roads database is provided under an Open Data Commons Open Database License. Meijer, J.R., Huijbegts, M.A.J., Schotten, C.G.J. and Schipper, A.M. (2018): Global patterns of current and future road infrastructure. Environmental Research Letters, 13-064006.
See all pages that use this dataset -
Natural Earth: Cultural Vectors
ID: 1041Boundaries, populated places
See all pages that use this dataset
Note: While we identify the data sets used on this page, we do not store any further details, nor the data sets themselves on our site.
Related
- ID: 4736
 Visualization
 - ID: 4711
 Visualization
 - ID: 4712
 Visualization
Release date
This page was originally published on Tuesday, April 30, 2019.
This page was last updated on Monday, January 6, 2025 at 12:14 AM EST.