The X8.2 Flare of September 2017, as Seen by SDO
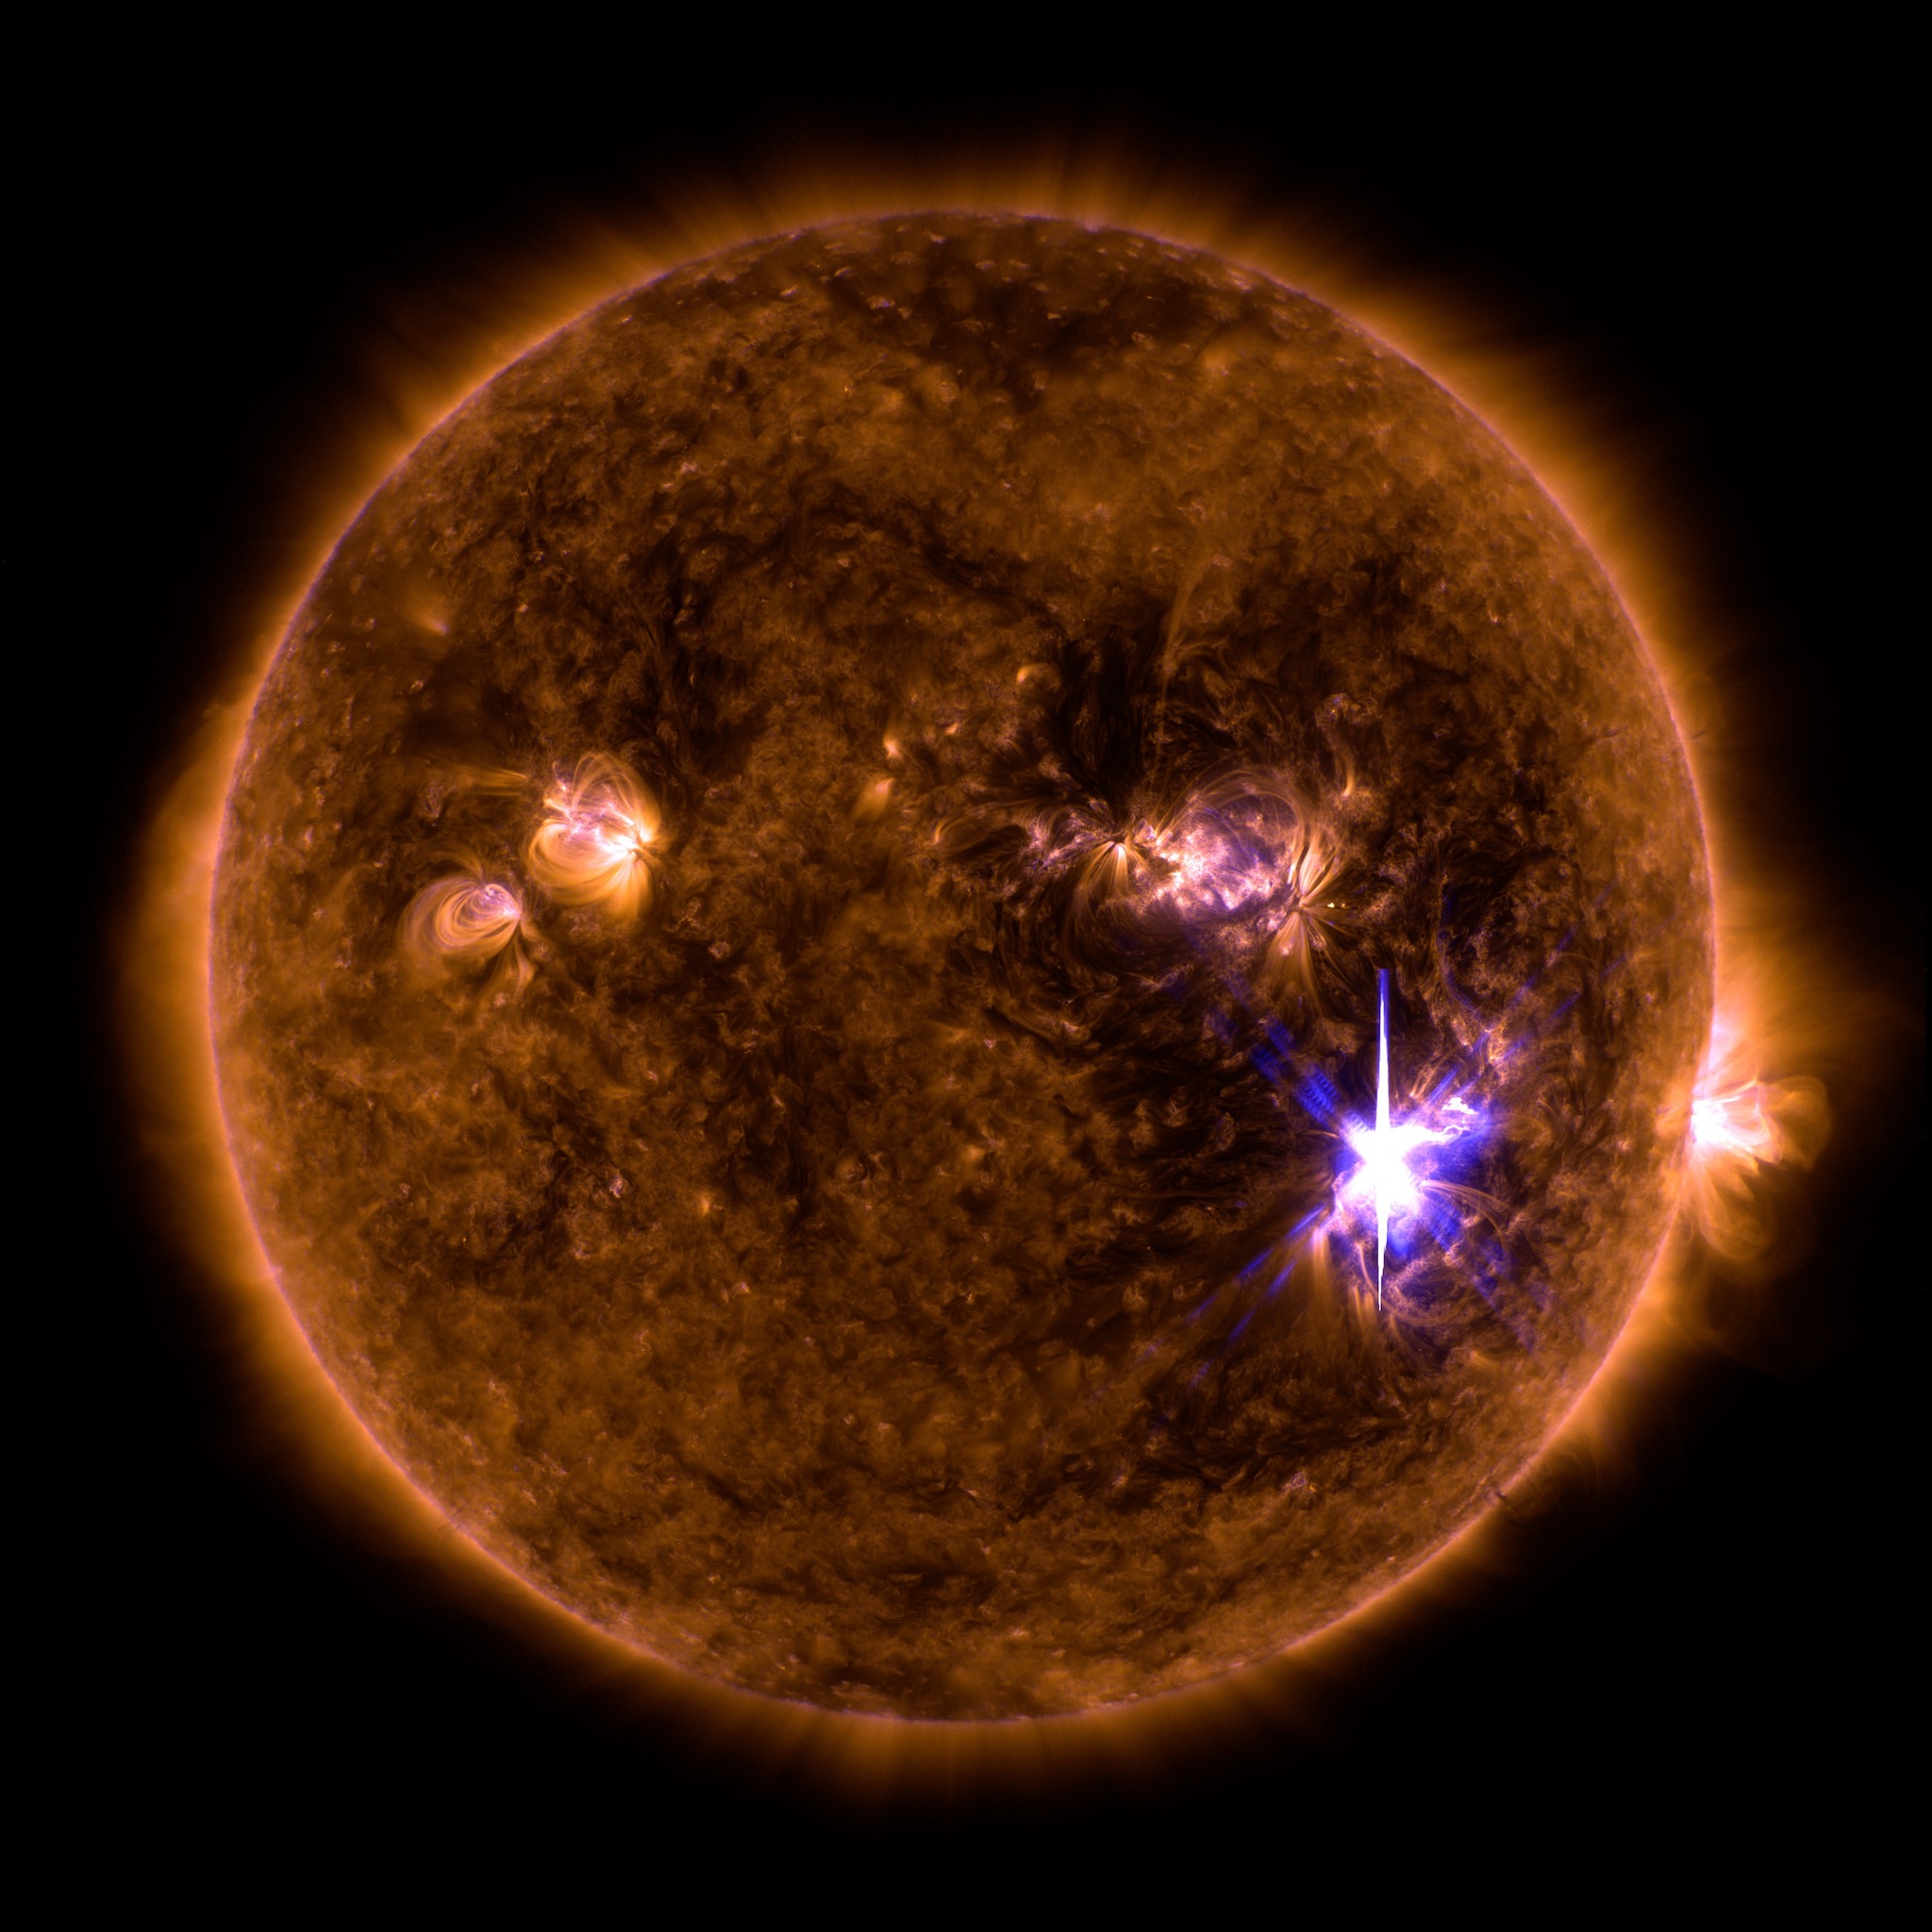
40 hours of AIA 131 angstrom imager at 12 second cadence viewing the time around the X8.2 solar flare.
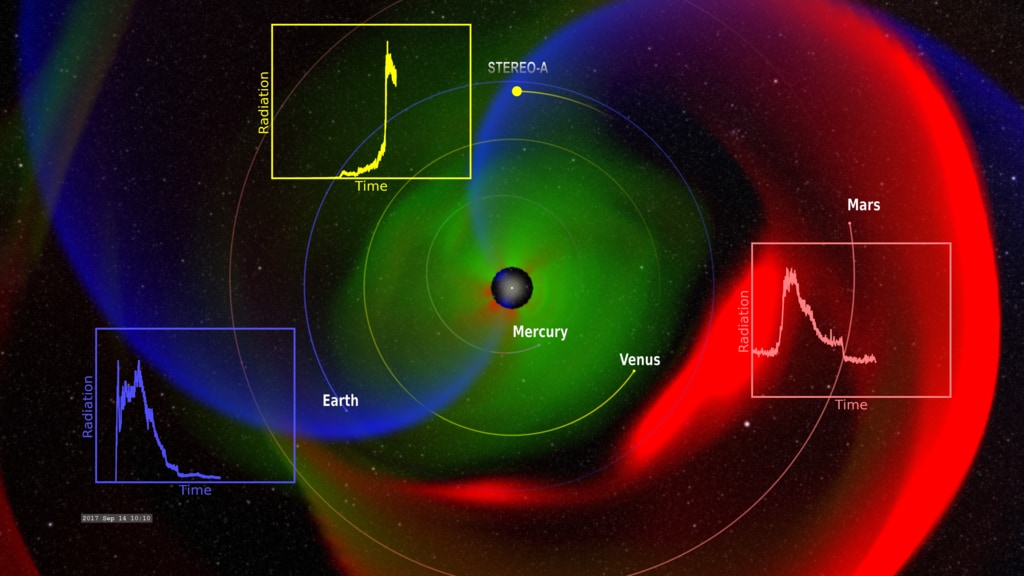
Between September 9-10 of 2017, the Sun launched a series of three coronal mass ejections (CMEs), culminating with an X8.2 flare from the eastern limb, as the active region was rotating away from the Earth. These events rippled across the solar system, and were detected by multiple NASA missions.
A slow (500 km/s) CME was launched at 23:46UT on September 9. A second faster CME (1000km/s) was launched on September 10 at 02:16UT and the fastest CME (2600 km/s) was launched at 16:54 UT. The faster CMEs would eventually catch up with the slower CME and merge into a single CME moving through the solar system.
These image sequences from SDO are selected at a higher time resolution (12 seconds between frames) compared to some of the older content related to these events.
40 hours of AIA 171 angstrom imager at 12 second cadence viewing the time around the X8.2 solar flare..
40 hours of AIA 304 angstrom imager at 12 second cadence viewing the time around the X8.2 solar flare.
40 hours of AIA 131 angstrom imager (4Kx4K) at 12 second cadence viewing the time around the X8.2 solar flare.
40 hours of AIA 171 angstrom imager (4Kx4K) at 12 second cadence viewing the time around the X8.2 solar flare.
40 hours of AIA 304 angstrom imager (4Kx4K) at 12 second cadence viewing the time around the X8.2 solar flare.
Credits
Please give credit for this item to:
NASA's Scientific Visualization Studio
-
Visualizer
- Tom Bridgman (Global Science and Technology, Inc.)
-
Technical support
- Laurence Schuler (ADNET Systems, Inc.)
- Ian Jones (ADNET Systems, Inc.)
Missions
This page is related to the following missions:Series
This page can be found in the following series:Datasets used
-
AIA 304 (304 Filter) [SDO: AIA]
ID: 677This dataset can be found at: http://jsoc.stanford.edu/
See all pages that use this dataset -
AIA 171 (171 Filter) [SDO: AIA]
ID: 680This dataset can be found at: http://jsoc.stanford.edu/
See all pages that use this dataset -
AIA 131 (131 Filter) [SDO: AIA]
ID: 730This dataset can be found at: http://jsoc.stanford.edu/
See all pages that use this dataset
Note: While we identify the data sets used on this page, we do not store any further details, nor the data sets themselves on our site.
Related
- ID: 4699
 Visualization
Older Versions
- ID: 12706
 Produced Video
Release date
This page was originally published on Wednesday, May 1, 2019.
This page was last updated on Wednesday, May 28, 2025 at 12:07 AM EDT.