2019 Path of Totality
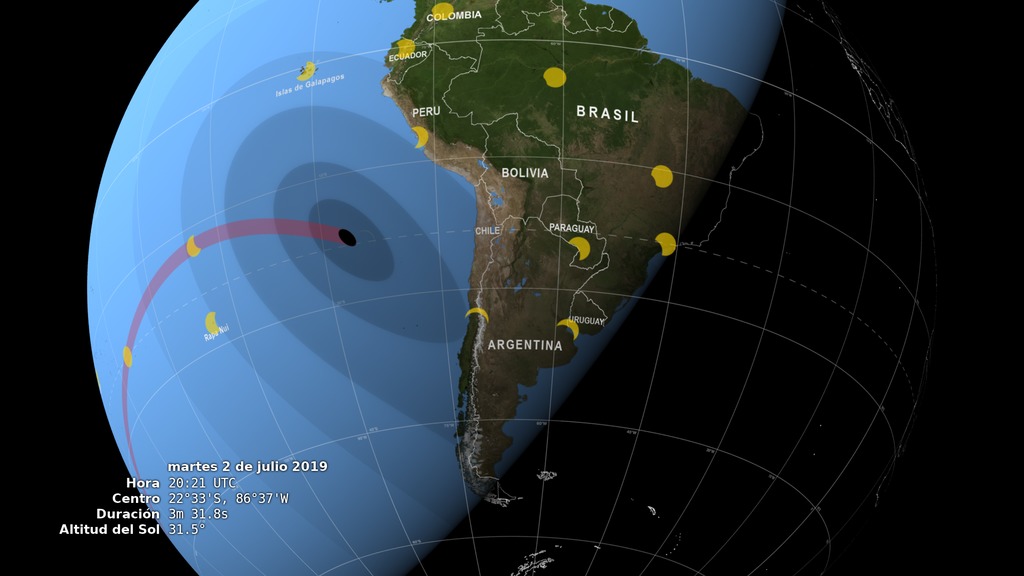
This animation shows the Moon's umbra shadow as it passes over Chile and Argentina during the July 2, 2019 total solar eclipse. Through the use of a number of NASA datasets, notably the global elevation maps from Lunar Reconnaissance Orbiter, the shape and location of the shadow is depicted with high accuracy.
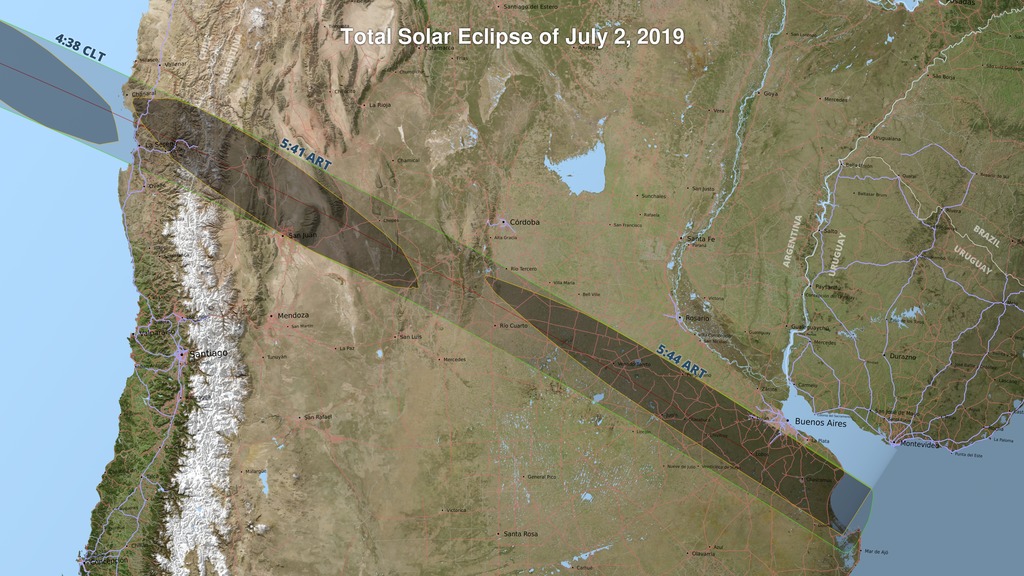
During the July 2, 2019 total solar eclipse, the Moon's umbral shadow will scud across South America, through Chile and Argentina, in just 7 minutes before sliding off the Earth's surface as both the Sun and Moon set. The path of this shadow, the path of totality, is where observers will see the Moon completely cover the Sun for about two and a half minutes.
This animation shows the umbra and its path in a unique way. Elevations on the Earth's surface and the irregular lunar limb (the silhouette edge of the Moon's disk) are both fully accounted for, and they both have dramatic and surprising effects on the shape of the umbra and the location of the path. The umbra becomes a polygon with edges that are ruffled by the high elevations of the Andes. To read more about these effects, go here.
The animation provides an overhead view of the umbra and runs at a rate of 30× real time — every minute of the eclipse takes two seconds in the animation.
| Earth radius | 6378.137 km |
|---|---|
| Ellipsoid | WGS84 |
| Geoid | EGM96 |
| Elevations | SRTM 3 arcsec DEM |
| Moon radius | 1737.4 km |
| Sun radius | 696,000 km (959.645 arcsec at 1 AU) |
| Ephemeris | DE 421 |
| Earth orientation | SOFA libraryiauC2t06a() |
| Delta UTC | 69.184 seconds (TT – TAI + 37 leap seconds) |
| ΔT | 69.368 seconds |
Credits
Please give credit for this item to:
NASA's Scientific Visualization Studio
-
Visualizer
-
Ernie Wright
(USRA)

-
Ernie Wright
(USRA)
-
Technical support
- Laurence Schuler (ADNET Systems, Inc.)
- Ian Jones (ADNET Systems, Inc.)
-
Producer
- Genna Duberstein (USRA)
-
Programmer
-
Ernie Wright
(USRA)
-
Ernie Wright
(USRA)
Datasets used
-
DEM [SRTM: SIR-C]
ID: 481 -
BMNG (Blue Marble: Next Generation) [Terra and Aqua: MODIS]
ID: 508Credit: The Blue Marble data is courtesy of Reto Stockli (NASA/GSFC).
This dataset can be found at: http://earthobservatory.nasa.gov/Newsroom/BlueMarble/
See all pages that use this dataset -
DEM (Digital Elevation Map) [LRO: LOLA]
ID: 653 -
DE421 (JPL DE421)
ID: 752Planetary ephemerides
This dataset can be found at: http://ssd.jpl.nasa.gov/?ephemerides#planets
See all pages that use this dataset -
SLDEM2015 (DIgital Elevation Model) [LRO/SELENE: LOLA/TC]
ID: 948A digital elevation model of the Moon derived from the Lunar Orbiter Laser Altimeter and the SELENE Terrain Camera. See the description in Icarus. The data is here.
See all pages that use this dataset
Note: While we identify the data sets used on this page, we do not store any further details, nor the data sets themselves on our site.
Related
- ID: 4736
 Visualization
 - ID: 4711
 Visualization
 - ID: 4713
 Visualization
Release date
This page was originally published on Tuesday, April 30, 2019.
This page was last updated on Monday, January 6, 2025 at 12:14 AM EST.