Umbra Shapes
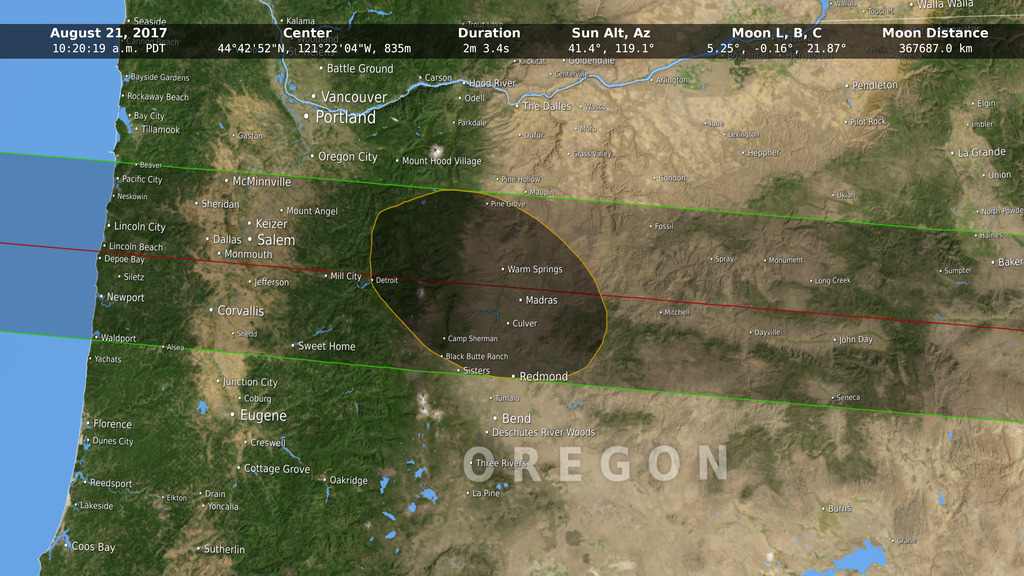
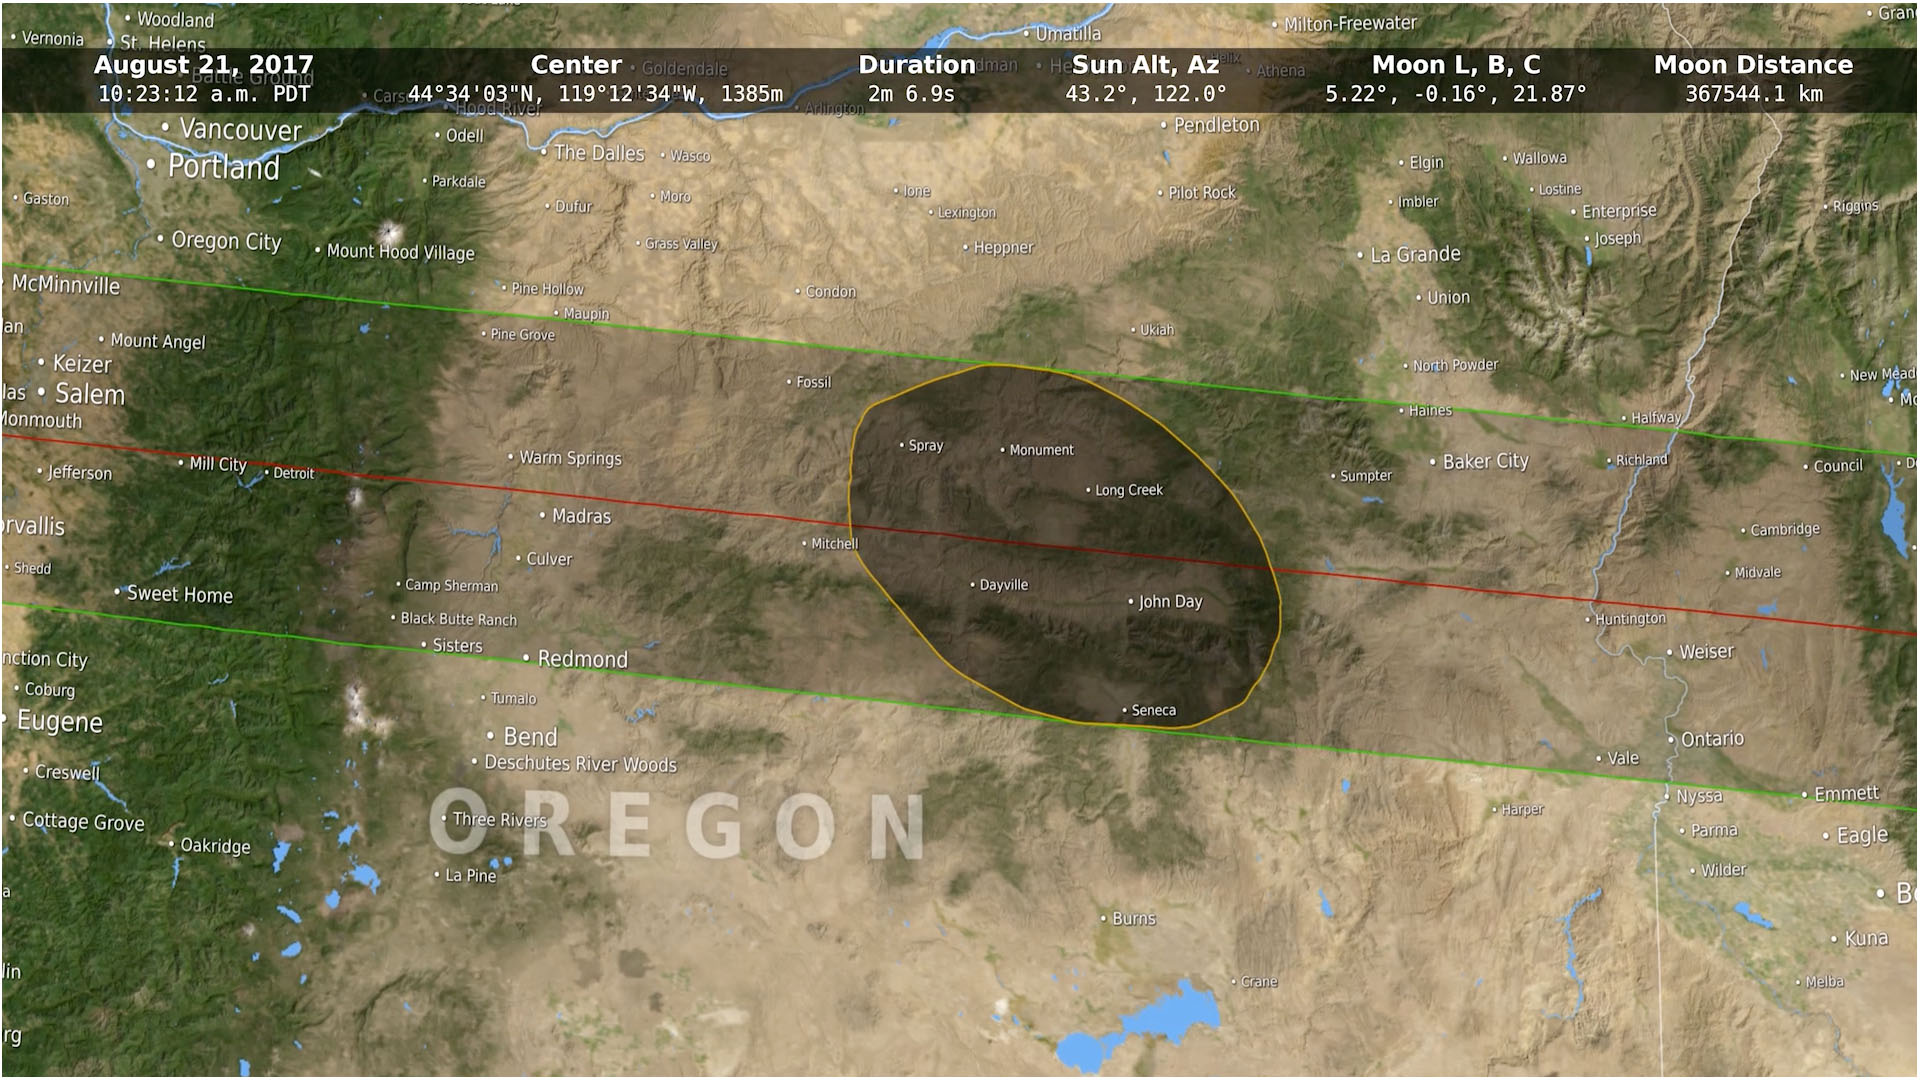
This animation shows the shape of the Moon's umbral shadow during the August 21, 2017 total solar eclipse, calculated at three different levels of detail. The dark gray is the closest to the true shape.
For centuries, eclipse maps have depicted the shape of the Moon's umbra on the ground as a smooth ellipse. But as this visualization shows — in a way never seen before — the shape is dramatically altered by both the rugged lunar terrain and the elevations of observers on the Earth.
The lunar umbra is the part of the Moon's shadow where the entire Sun is blocked by the Moon. In space, it's a cone extending some 400,000 kilometers behind the Moon. When the small end of this cone hits the Earth, we experience a total solar eclipse. The umbra shape discussed here is the intersection of the umbra cone with the surface of the Earth. On an eclipse map, this tells you where to stand in order to experience totality.
The true shape of the umbra is more like an irregular polygon with slightly curved edges. Each edge corresponds to a single valley on the lunar limb, the last (or first) spot on the limb that lets sunlight through. This is the location of the diamond part of the diamond ring effect visible in the seconds just before or just after totality. An observer standing at the cusp where two edges meet will be treated to a double diamond ring.
As these edges pass over mountain ranges (for the 2017 eclipse, the Cascades, Rockies, and Appalachians), they are scalloped by the peaks and valleys of the landscape. The higher elevations in the western states in 2017 also shift the umbra toward the southeast (in the direction of the Sun's azimuth) by as much as 3 kilometers.
In the animation, the red ellipse is the shape that results from assuming that the Moon and the Earth are both smooth. This is the shape most commonly seen on eclipse maps. The white shape shows the effect of the mountains and valleys along the silhouette edge of the Moon (the lunar limb). The dark gray shape adds the effect of elevations on the Earth's surface.
Details
The math used currently to predict and map eclipses was first described by Friedrich Wilhelm Bessel in 1829 and was expressed in its modern form by William Chauvenet in 1863. Bessel's method uses a coordinate system based on a plane, called the fundamental plane, passing through the center of the Earth and perpendicular to the Sun-Moon line. This greatly simplifies the calculations. The intersection of the Moon's shadow with the plane is always a circle, for example, and its size depends only on the Moon's z-coordinate.Using this coordinate system, it's possible to calculate just a handful of numbers, called Besselian elements, that can be plugged into various equations to predict almost anything you'd want to know about an eclipse. This was especially important in the 19th and early 20th centuries, when the math had to be done by hand. Even now, the simplicity of this approach allows us to compare hundreds or even thousands of eclipses far into the past and the future, using a reasonable amount of computer time.

Mountains and valleys near the south pole of the Moon are visible in this image of a partial solar eclipse taken from space by the Solar Dynamics Observatory spacecraft on October 7, 2010.
Bessel's method for predicting eclipses pretends that the Moon is a smooth sphere, when in fact its terrain is more rugged and extreme than the Earth's. The valleys along the silhouette edge, or limb, of the Moon affect the timing and duration of an eclipse by allowing sunlight to sneak through in places where a smooth Moon would block it. Eclipse calculations can correct for this by using a limb profile, a description of the surface elevations around the disk of the Moon.
Until quite recently, everyone used the limb profiles published in 1963 by Chester Burleigh Watts. To produce his profiles, Watts designed a machine that traced some 700 photographs of the Moon covering the full range of angles, or librations, visible from Earth, an effort that spanned 17 years. Eclipse calculations are now moving to much more accurate limb profiles based on data from NASA's Lunar Reconnaissance Orbiter (LRO) and the Japan Space Agency's Kaguya spacecraft.
The lunar limb as it changes during the two-month period centered on the 2017 eclipse. Orange lines mark the equator and meridian. The blue outline is the limb, exaggerated by a factor of 18.
The lunar limb in the present work is based on LRO laser altimetry and on a hybrid LRO/Kaguya dataset called SLDEM2015. To create a limb profile, each point in an elevation map is transformed into 3D cartesian coordinates in a Moon body-fixed frame. At each time step in the eclipse calculation, the point cloud is rotated into fundamental plane coordinates. The limb profile then comprises the set of points lying farthest from the shadow axis. The animation above shows how this profile changes as the Moon librates.
Observer elevations are taken from SRTM, a digital elevation map of the Earth based on radar data collected during the February, 2000 flight of the Space Shuttle Endeavor. As illustrated by the following cartoon, higher elevations can lift the observer either into or out of the umbra cone. The overall effect is to shift the umbra toward the Sun.

Higher elevations can lift the observer into or out of the shadow cone.
For More Information
Credits
Please give credit for this item to:
NASA's Scientific Visualization Studio
-
Visualizer
-
Ernie Wright
(USRA)

-
Ernie Wright
(USRA)
Missions
This page is related to the following missions:Series
This page can be found in the following series:Datasets used
-
DEM [SRTM: SIR-C]
ID: 481 -
DEM (Digital Elevation Map) [LRO: LOLA]
ID: 653 -
DE421 (JPL DE421)
ID: 752Planetary ephemerides
This dataset can be found at: http://ssd.jpl.nasa.gov/?ephemerides#planets
See all pages that use this dataset -
SLDEM2015 (DIgital Elevation Model) [LRO/SELENE: LOLA/TC]
ID: 948A digital elevation model of the Moon derived from the Lunar Orbiter Laser Altimeter and the SELENE Terrain Camera. See the description in Icarus. The data is here.
See all pages that use this dataset
Note: While we identify the data sets used on this page, we do not store any further details, nor the data sets themselves on our site.
Related
- ID: 4515
 Visualization
 - ID: 4516
 Visualization
 - ID: 4518
 Visualization
 - ID: 4314
 Visualization
Used as a Source In
- ID: 12412
 Produced Video
Release date
This page was originally published on Tuesday, December 13, 2016.
This page was last updated on Sunday, January 5, 2025 at 11:09 PM EST.