Mapping Particle Injections in Earth's Magnetosphere
A view from above the northern hemisphere of particle injection propagation constructed from their respective satellite detections. Distinct injections, and their detection by satellites, are represented by different colors.
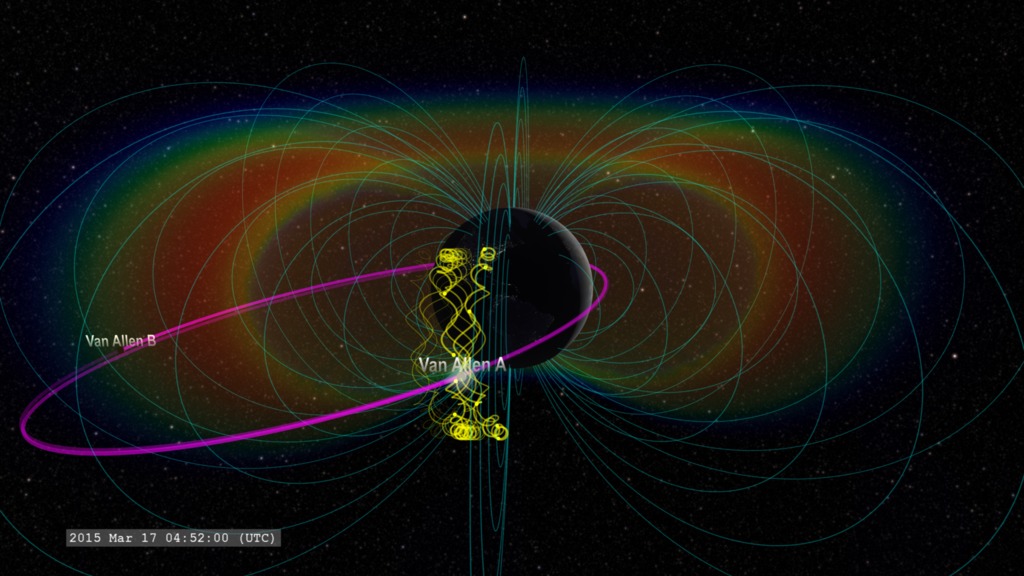
Near-Earth space is not empty. It is filled with energetic charged particles and magnetic fields from the Sun and Earth. Some of these energetic particles make it into Earth's upper atmosphere, where they can create auroras around the north and south magnetic poles. But most of these energetic particles stay trapped by Earth's magnetic field, forming concentric belts encircling the planet, called the Van Allen Radiation Belts (Radiation Belts & Plasmapause).
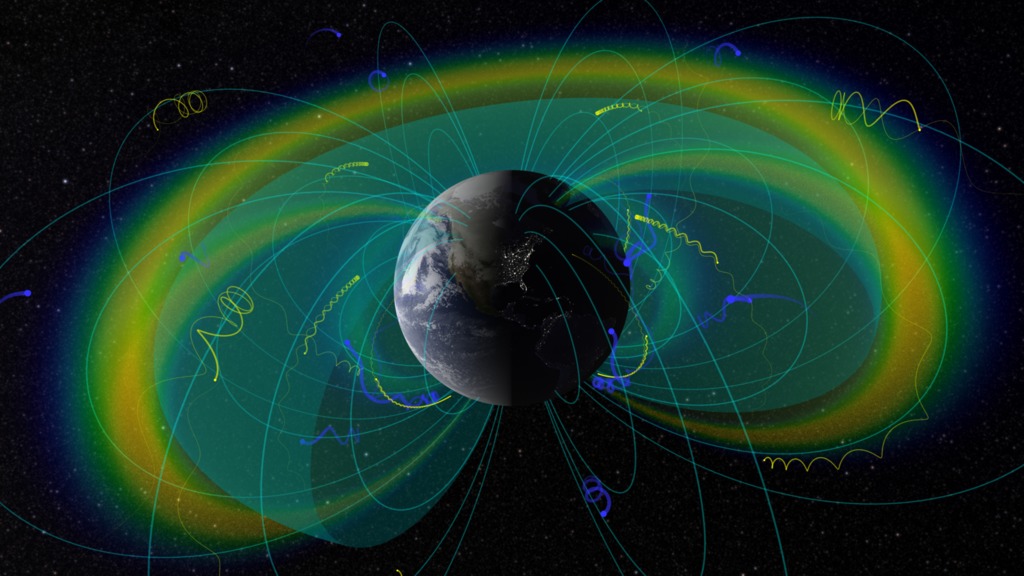
When energetic particles are injected into Earth's radiation belts, perhaps by a reconnection event in Earth's magnetotail, they can become trapped by the geomagnetic field. Consequently, these energetic particles will propagate around Earth as they slowly disperse. If a satellite with particle monitors lies along the particle trajectory, the satellite can detect these particles (Prompt Electron Acceleration in the Radiation Belts). With multiple satellite detections, it is possible to approximately reconstruct the origin and path of the original particle injection. These visualizations illustrate the results of this reconstruction applied to a series of particle injections detected by multiple satellites on April 7, 2016.
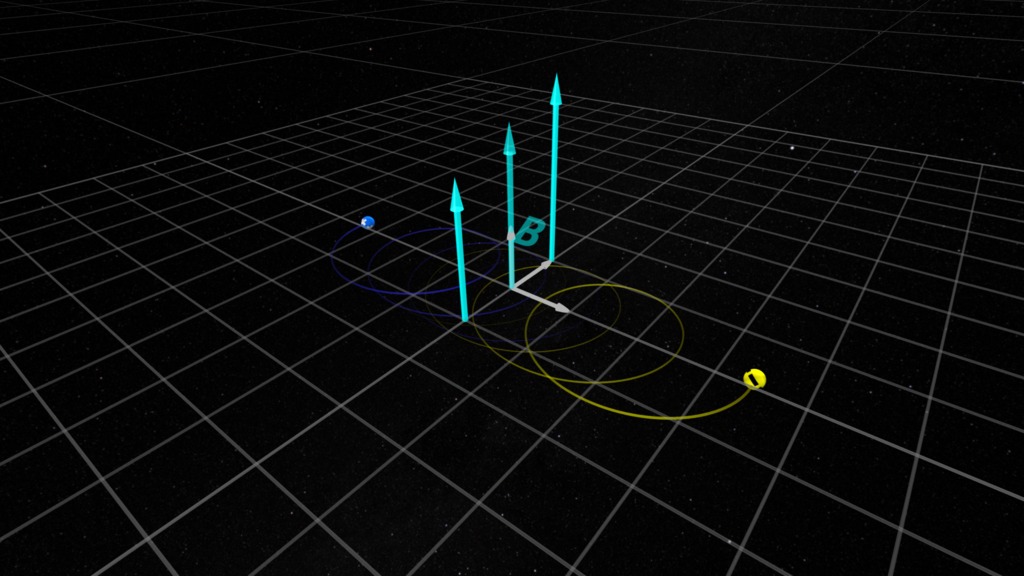
In this visualization, we distinguish each injection with a different color, and that color is used to flash the satellite detecting that particular injection. The injections drift around Earth by a process called gradient drift (Plasma Zoo: Particle Drift in a Magnetic Gradient). Negative charged particles drift eastward (corresponding to counter-clockwise in the visualization view above the north geographic pole), while positive charged particles drift westward (corresponding to clockwise in the visualization view).
A view from the dusk limb of Earth, transitioning to a view above the northern hemisphere of particle injection propagation constructed from their respective satellite detections. Distinct injections, and their detection by satellites, are represented by different colors.
For More Information
See NASA.gov
Credits
Please give credit for this item to:
NASA's Scientific Visualization Studio
-
Visualizer
- Tom Bridgman (Global Science and Technology, Inc.)
-
Scientist
- Drew L. Turner (Space Sciences Department, The Aerospace Corporation)
-
Writer
- Mara Johnson-Groh (Wyle Information Systems)
-
Producer
- Genna Duberstein (USRA)
-
Technical support
- Laurence Schuler (ADNET Systems, Inc.)
- Ian Jones (ADNET Systems, Inc.)
Missions
This page is related to the following missions:Datasets used
-
SSCweb ephemerides (SSCweb)
ID: 538Satellite ephemerides
This dataset can be found at: http://sscweb.gsfc.nasa.gov
See all pages that use this dataset -
Space-Track TLE (Space-Track Two-Line Elements)
ID: 753Satellite ephemerides
This dataset can be found at: http://Space-Track.org
See all pages that use this dataset
Note: While we identify the data sets used on this page, we do not store any further details, nor the data sets themselves on our site.
Related
- ID: 4480
 Visualization
 - ID: 4263
 Visualization
 - ID: 4241
 Visualization
Release date
This page was originally published on Monday, November 27, 2017.
This page was last updated on Monday, January 6, 2025 at 12:12 AM EST.