GPM Constellation
The Global Precipitation Measurement (GPM) mission unites data from ten U.S. and international satellites that measure rainfall and snowfall. The partnership, co-led by NASA and the Japan Aerospace Exploration Agency, is anchored by the GPM Core Observatory, launched on February 27, 2014. Carrying two advanced precipitation instruments, the GPM Microwave Imager and Dual-frequency Precipitation Radar, the Core Observatory measures the full range of precipitation types from heavy rainfall to, for the first time, light rain and snowfall. With an orbit that cuts across the path of the other satellites it is also used as a reference standard so that data from all the partner satellites can be meaningfully compared. The combined data from all ten satellites allows scientists to collect precipitation data from all parts of the world in under three hours.
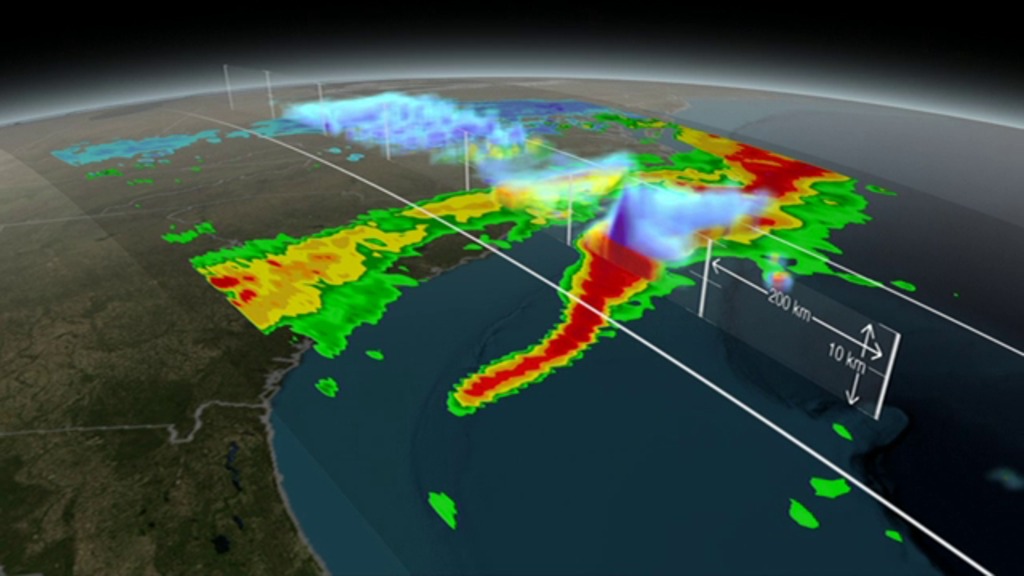
This animation shows rain data collected by the GPM Core Observatory and the partner satellites currently in orbit on March 17, 2014. The end of the animation focuses in on a storm system that moved over the eastern United States, showing GPM Microwave Imager data of rain and snow rates. This is the first time a single satellite has collected simultaneous data on rain and snow for a single storm.
. Shades of cyan represent low amounts of frozen precipitation, whereas shades of purple represent high amounts of precipitation.")
Colorbar for frozen precipitation rates (ie, snow rates). Shades of cyan represent low amounts of frozen precipitation, whereas shades of purple represent high amounts of precipitation.
. Shades of green represent low amounts of liquid precipitation, whereas shades of red represent high amounts of precipitation.")
Colorbar for liquid precipitation rates (ie, rain rates). Shades of green represent low amounts of liquid precipitation, whereas shades of red represent high amounts of precipitation.

Print resolution still of GPM taking rain rate data over Africa.
Print resolution still of GPM taking rain rate data over the North Atlantic and the West African coast.
Print resolution still of GPM taking rain rate data across the Atlantic Ocean.
Print resolution still showing part of the GPM constellation. Satellites in view are DMSP F-16, DMSP F-18, TRMM, and GPM.
Print resolution still of both TRMM and GPM taking rain rate data of the March 17th, 2014 East coast snow storm.
Print resolution still of rain rate data taken by both GPM and TRMM of the March 17th, 2014 East coast snow storm.
Credits
Please give credit for this item to:
NASA's Scientific Visualization Studio
-
Animators
-
Alex Kekesi
(Global Science and Technology, Inc.)

- Horace Mitchell (NASA/GSFC)
- Tom Bridgman (Global Science and Technology, Inc.)
-
Alex Kekesi
(Global Science and Technology, Inc.)
-
Producers
- Ryan Fitzgibbons (USRA)
- Rani Gran (NASA/GSFC)
-
Scientists
- Gail Skofronick Jackson (NASA/GSFC)
- Dalia B Kirschbaum (NASA/GSFC)
-
George Huffman
(NASA/GSFC)
-
Project support
- Laurence Schuler (ADNET Systems, Inc.)
- Ian Jones (ADNET Systems, Inc.)
-
Writer
- Ellen T. Gray (ADNET Systems, Inc.)
Missions
This page is related to the following missions:Series
This page can be found in the following series:Datasets used
-
Monthly Average Precipitation [TRMM: PR and TMI]
ID: 516This dataset can be found at: http://disc.sci.gsfc.nasa.gov/data/datapool/TRMM/01_Data_Products/index.html
See all pages that use this dataset -
Rain Rates (Surface Precipitation) [GPM: GMI]
ID: 822Credit: Data provided by the joint NASA/JAXA GPM mission.
See all pages that use this dataset -
rain rates (precipitation rates) [SHIZUKU (GCOM-W1): AMSR2]
ID: 836Credit: AMSR2 data courtesy of the Japan Aerospace Exploration Agency (JAXA).
See all pages that use this dataset -
Rain Rates (Precipitation) [DMSP F16: SSMI]
ID: 837 -
Rain Rates (Precipitation) [DMSP F17: SSMI]
ID: 838 -
Rain Rates (Precipitation) [DMSP F18: SSMI]
ID: 839
Note: While we identify the data sets used on this page, we do not store any further details, nor the data sets themselves on our site.
Related
- ID: 11635
 Produced Video
Release date
This page was originally published on Thursday, September 4, 2014.
This page was last updated on Wednesday, May 3, 2023 at 1:50 PM EDT.