A newer version of this visualization is available.
The 2012 Earth-Orbiting Heliophysics Fleet
Since Sentinels of the Heliosphere in 2008, there have been a few new missions, and a few missions have been shut down. As of Fall of 2012, here's a tour of the NASA Near-Earth Heliophysics fleet, covering the space from near-Earth orbit out to the orbit of the Moon.
Revision (November 9, 2012): The RBSP mission has been renamed the Van Allen Probes. NASA Press Release.
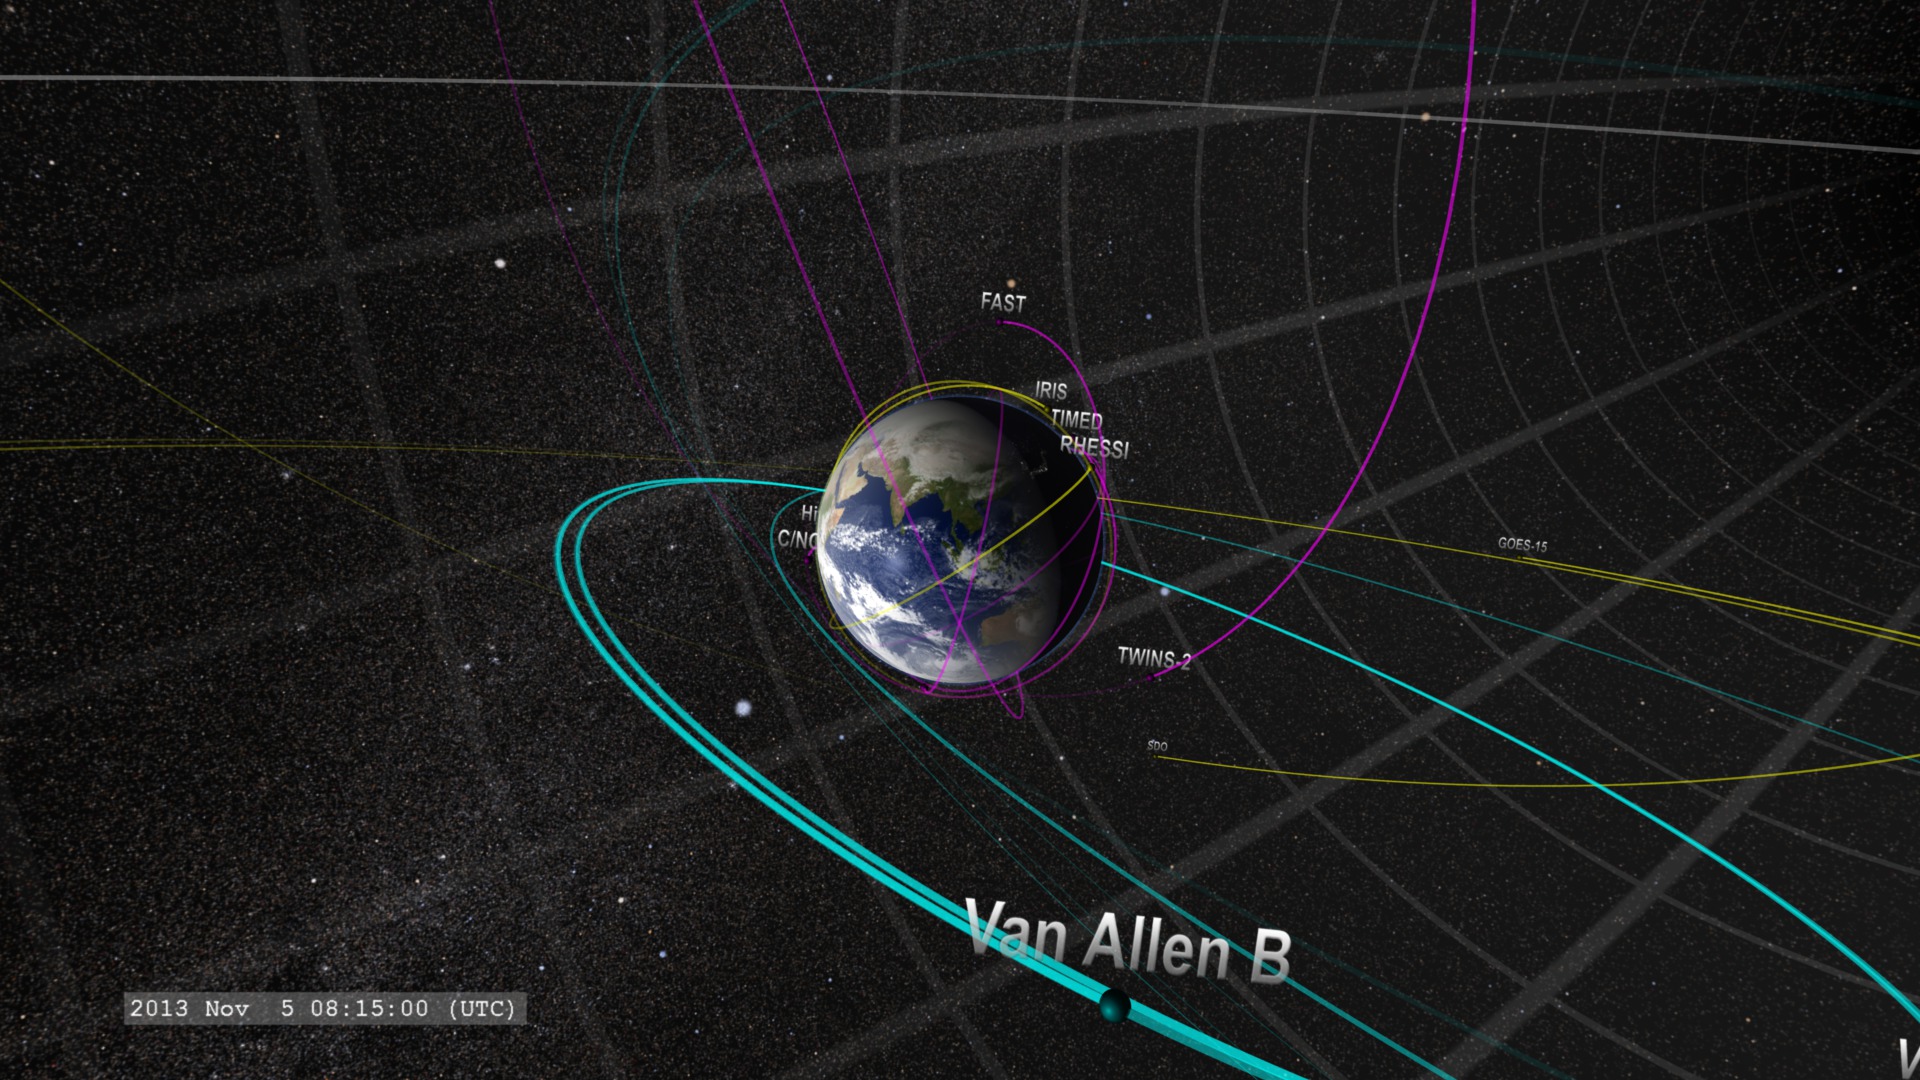
The satellite orbits are color coded for their observing program:
Magenta: TIM (Thermosphere, Ionosphere, Mesosphere) observations Yellow: solar observations and imagery Cyan: Geospace and magnetosphere Violet: Heliospheric observations
Near-Earth Fleet:
- Hinode: Observes the Sun in multiple wavelengths up to x-rays. SVS page
- RHESSI : Observes the Sun in x-rays and gamma-rays. SVS page
- TIMED: Studies the upper layers (40-110 miles up) of the Earth's atmosphere.
- FAST: Measures particles and fields in regions where aurora form.
- CINDI: Measures interactions of neutral and charged particles in the ionosphere.
- SORCE: Monitors solar intensity across a broad range of the electromagnetic spectrum.
- AIM: Images and measures noctilucent clouds. SVS page
- RBSP: (Renamed the Van Allen Probes) Designed to study the impact of space weather on Earth's radiation belts. SVS page
Geosynchronous Fleet:
- SDO: Solar Dynamics Observatory keeps the Sun under continuous observation at 16 megapixel resolution.
- GOES: The newest GOES satellites include a solar X-ray imager operated by NOAA.
Geospace Fleet:
- Geotail: Conducts measurements of electrons and ions in the Earth's magnetotail.
- Cluster: This is a group of four satellites which fly in formation to measure how particles and fields in the magnetosphere vary in space and time. SVS page
- THEMIS: This is a fleet of three satellites to study how magnetospheric instabilities produce substorms. Two of the original five satellites were moved into lunar orbit to become ARTEMIS.SVS page
- IBEX: The Interstellar Boundary Explorer measures the flux of neutral atoms from the heliopause.
Lunar Orbiting Fleet
- ARTEMIS: Two of the THEMIS satellites were moved into lunar orbit to study the interaction of the Earth's magnetosphere with the Moon.
Note: A number of near-Earth missions had their orbits generated from Two-Line orbital elements valid in July 2012. Orbit perturbations since then may result in significant deviation from the actual satellite position for the time frame of this visualization.
Movie showing the heliosphysics missions from near Earth orbit out to the orbit of the Moon.

Close-up view of the near-Earth heliophysics satellites.
Further out, the three remaining THEMIS satellites orbit.
Cluster flies in formation.
At geostationary orbit, GOES and SDO keep watch on the Sun.
Out beyond the magnetosphere, is IBEX.
A far view of the Earth-orbiting heliophysics satellites.
ARTEMIS satellites orbit the Moon.
Final view.
Credits
Please give credit for this item to:
NASA/Goddard Space Flight Center Scientific Visualization Studio
-
Animator
- Tom Bridgman (Global Science and Technology, Inc.)
-
Producer
- Scott Wiessinger (USRA)
Missions
This page is related to the following missions:Series
This page can be found in the following series:Datasets used
-
SSCweb ephemerides (SSCweb)
ID: 538Satellite ephemerides
This dataset can be found at: http://sscweb.gsfc.nasa.gov
See all pages that use this dataset -
DE421 (JPL DE421)
ID: 752Planetary ephemerides
This dataset can be found at: http://ssd.jpl.nasa.gov/?ephemerides#planets
See all pages that use this dataset -
Space-Track TLE (Space-Track Two-Line Elements)
ID: 753Satellite ephemerides
This dataset can be found at: http://Space-Track.org
See all pages that use this dataset -
STK Ephemeris (Satellite ToolKit Ephemeris)
ID: 754Satellite ephemerides
See all pages that use this dataset -
SPICE Ephemerides (SPICE Ephemerides)
ID: 755Satellite and planetary ephemerides
See all pages that use this dataset
Note: While we identify the data sets used on this page, we do not store any further details, nor the data sets themselves on our site.
Related
- ID: 11212

Newer Versions
- ID: 4127
 Visualization
Release date
This page was originally published on Thursday, September 20, 2012.
This page was last updated on Sunday, February 2, 2025 at 10:07 PM EST.