A Year In The Life Of Earth’s CO2
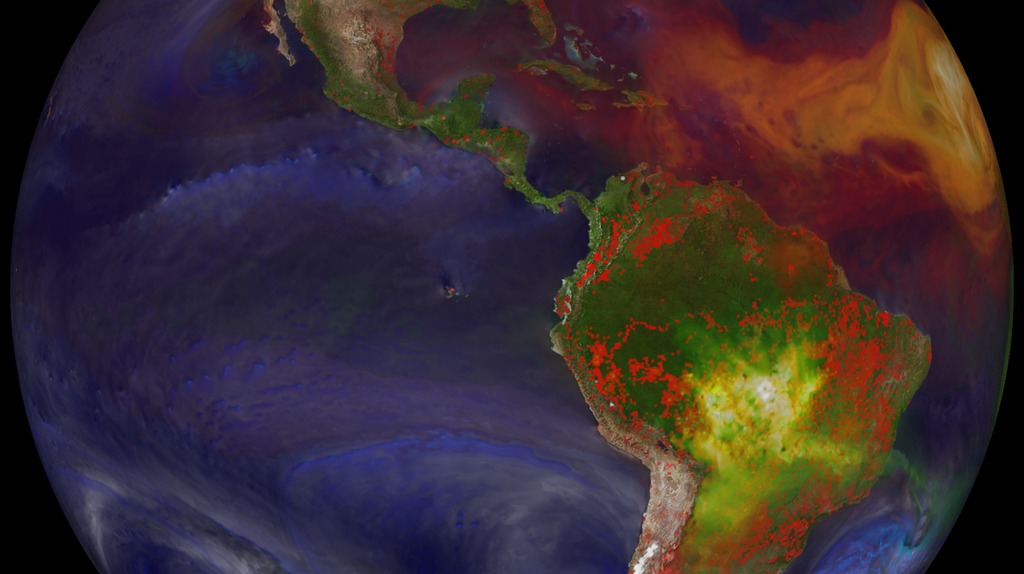
An ultra-high-resolution NASA computer model has given scientists a stunning new look at how carbon dioxide in the atmosphere travels around the globe.
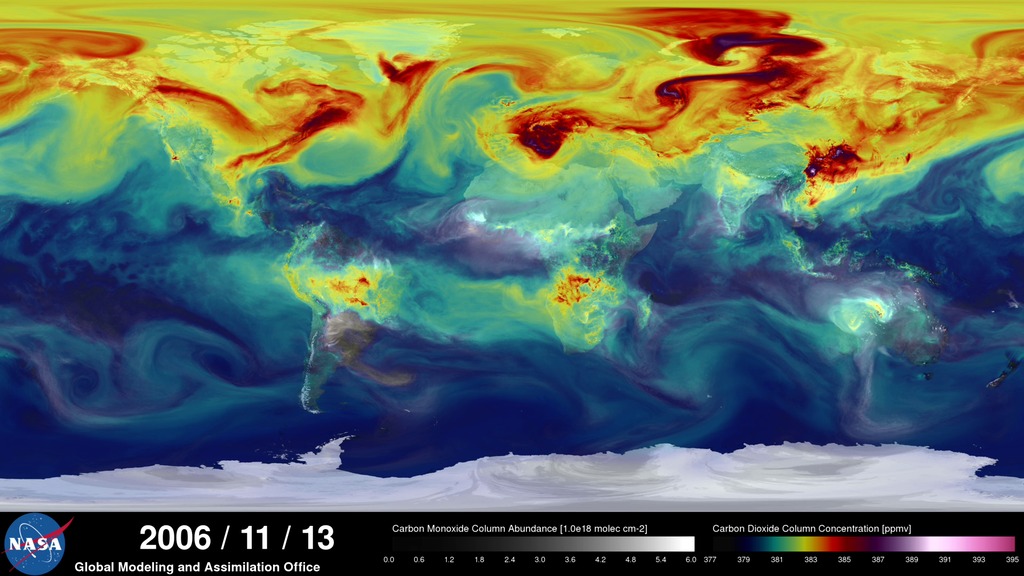
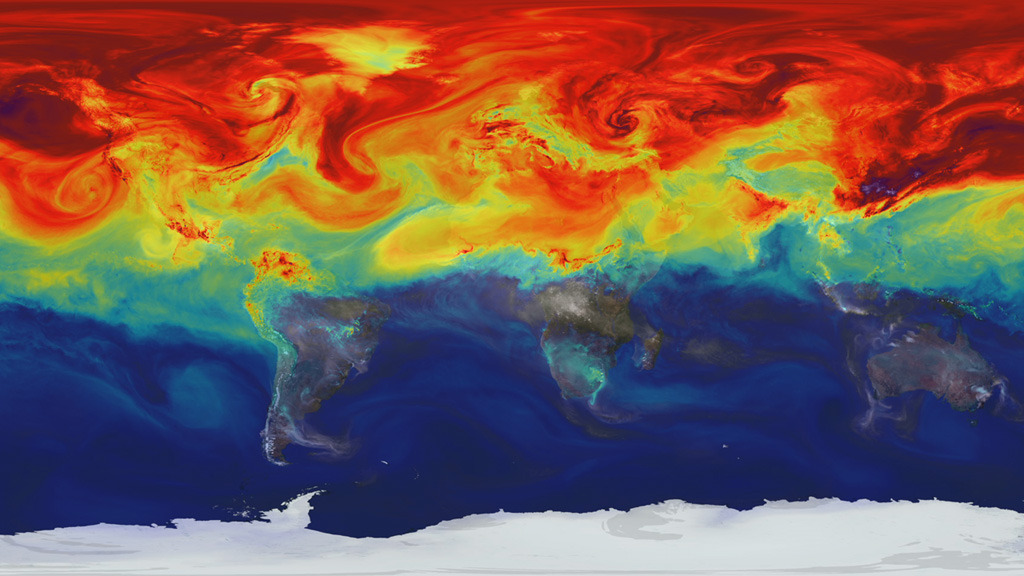
Plumes of carbon dioxide in the simulation swirl and shift as winds disperse the greenhouse gas away from its sources. The simulation also illustrates differences in carbon dioxide levels in the northern and southern hemispheres and distinct swings in global carbon dioxide concentrations as the growth cycle of plants and trees changes with the seasons.
The carbon dioxide visualization was produced by a computer model called GEOS-5, created by scientists at NASA Goddard Space Flight Center’s Global Modeling and Assimilation Office.
The visualization is a product of a simulation called a “Nature Run.” The Nature Run ingests real data on atmospheric conditions and the emission of greenhouse gases and both natural and man-made particulates. The model is then left to run on its own and simulate the natural behavior of the Earth’s atmosphere. This Nature Run simulates January 2006 through December 2006.
While Goddard scientists worked with a “beta” version of the Nature Run internally for several years, they released this updated, improved version to the scientific community for the first time in the fall of 2014.
Visualization - Jan. 1, 2006 - Dec. 31, 2006
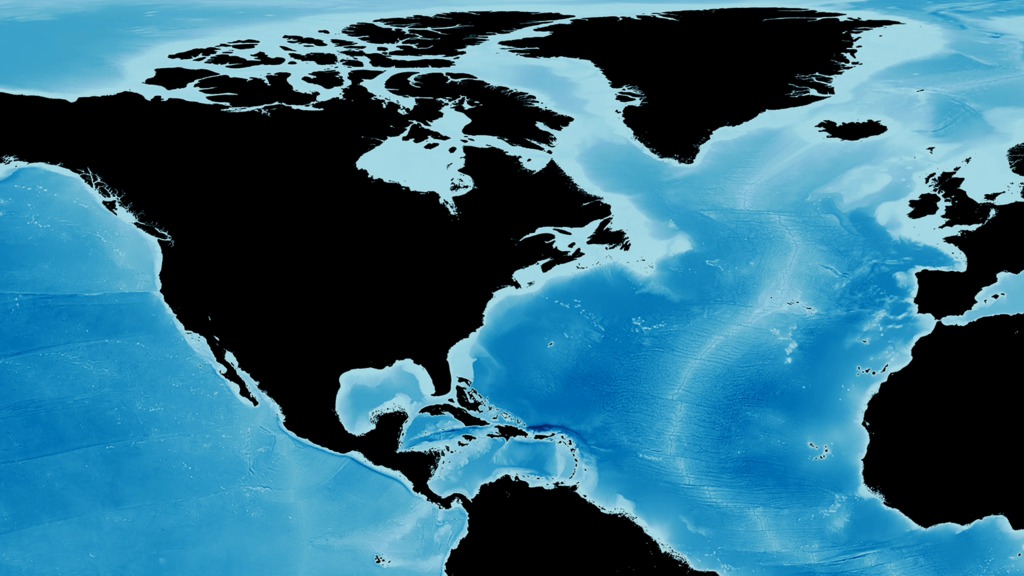
North America - Feb. 1 - 28, 2006
Africa - Aug. 1 - 31, 2006
Himalayas - Feb. 1 - 28, 2006

Still image - Jan. 1, 2006
Still image - North America - Feb. 12, 2006
Visualization without annotation - Jan. 1, 2006 - Dec. 31, 2006
For More Information
Credits
Please give credit for this item to:
NASA's Goddard Space Flight Center
-
Animator
- William Putman (NASA/GSFC)
-
Video editor
- Kayvon Sharghi (USRA)
-
Narration
- William Putman (NASA/GSFC)
- Kayvon Sharghi (USRA)
-
Narrator
- William Putman (NASA/GSFC)
-
Producer
- Kayvon Sharghi (USRA)
-
Scientist
- William Putman (NASA/GSFC)
-
Project support
- Aaron E. Lepsch (ADNET Systems, Inc.)
-
Writer
- Patrick Lynch (Wyle Information Systems)
Series
This page can be found in the following series:Related
- ID: 10236
- ID: 10273
- ID: 11683
 Produced Video
 - ID: 30017
 Hyperwall Visual
Release date
This page was originally published on Monday, November 17, 2014.
This page was last updated on Monday, January 6, 2025 at 1:27 AM EST.