GPM GMI First Light
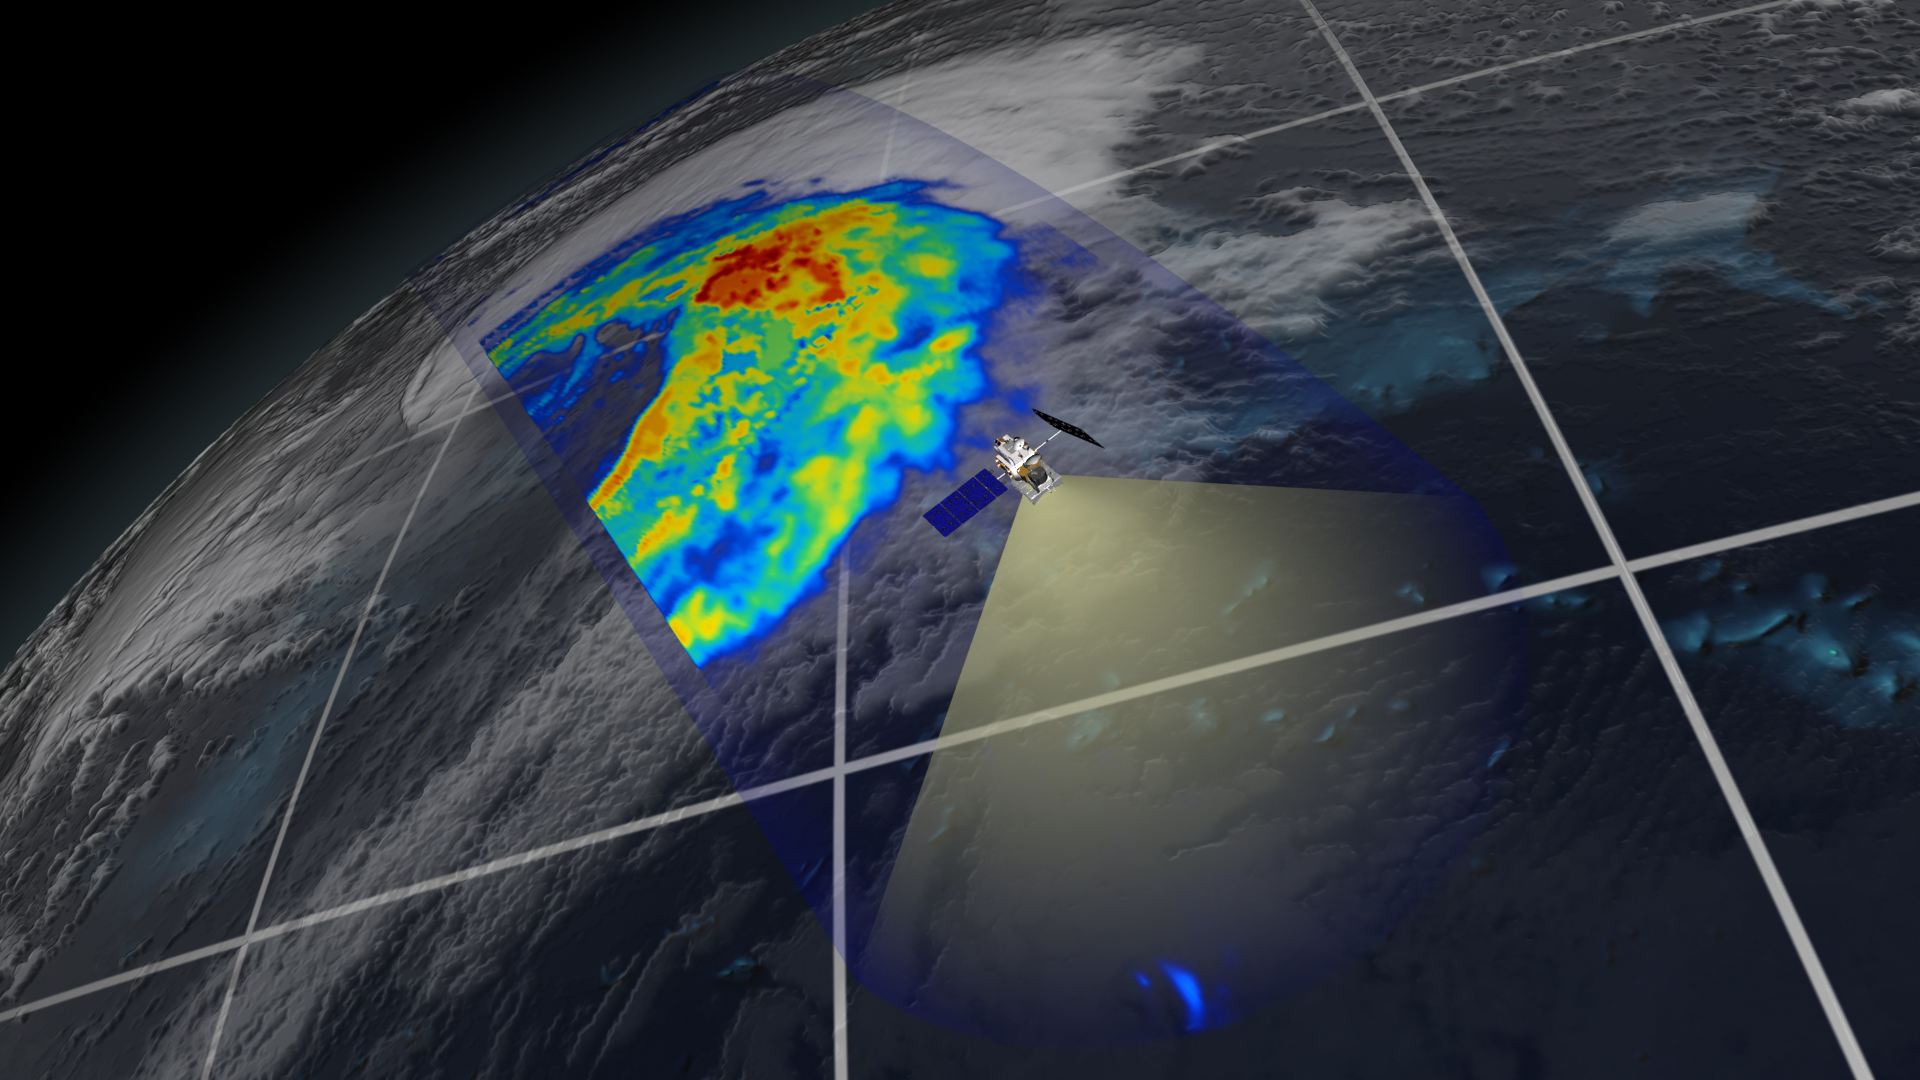
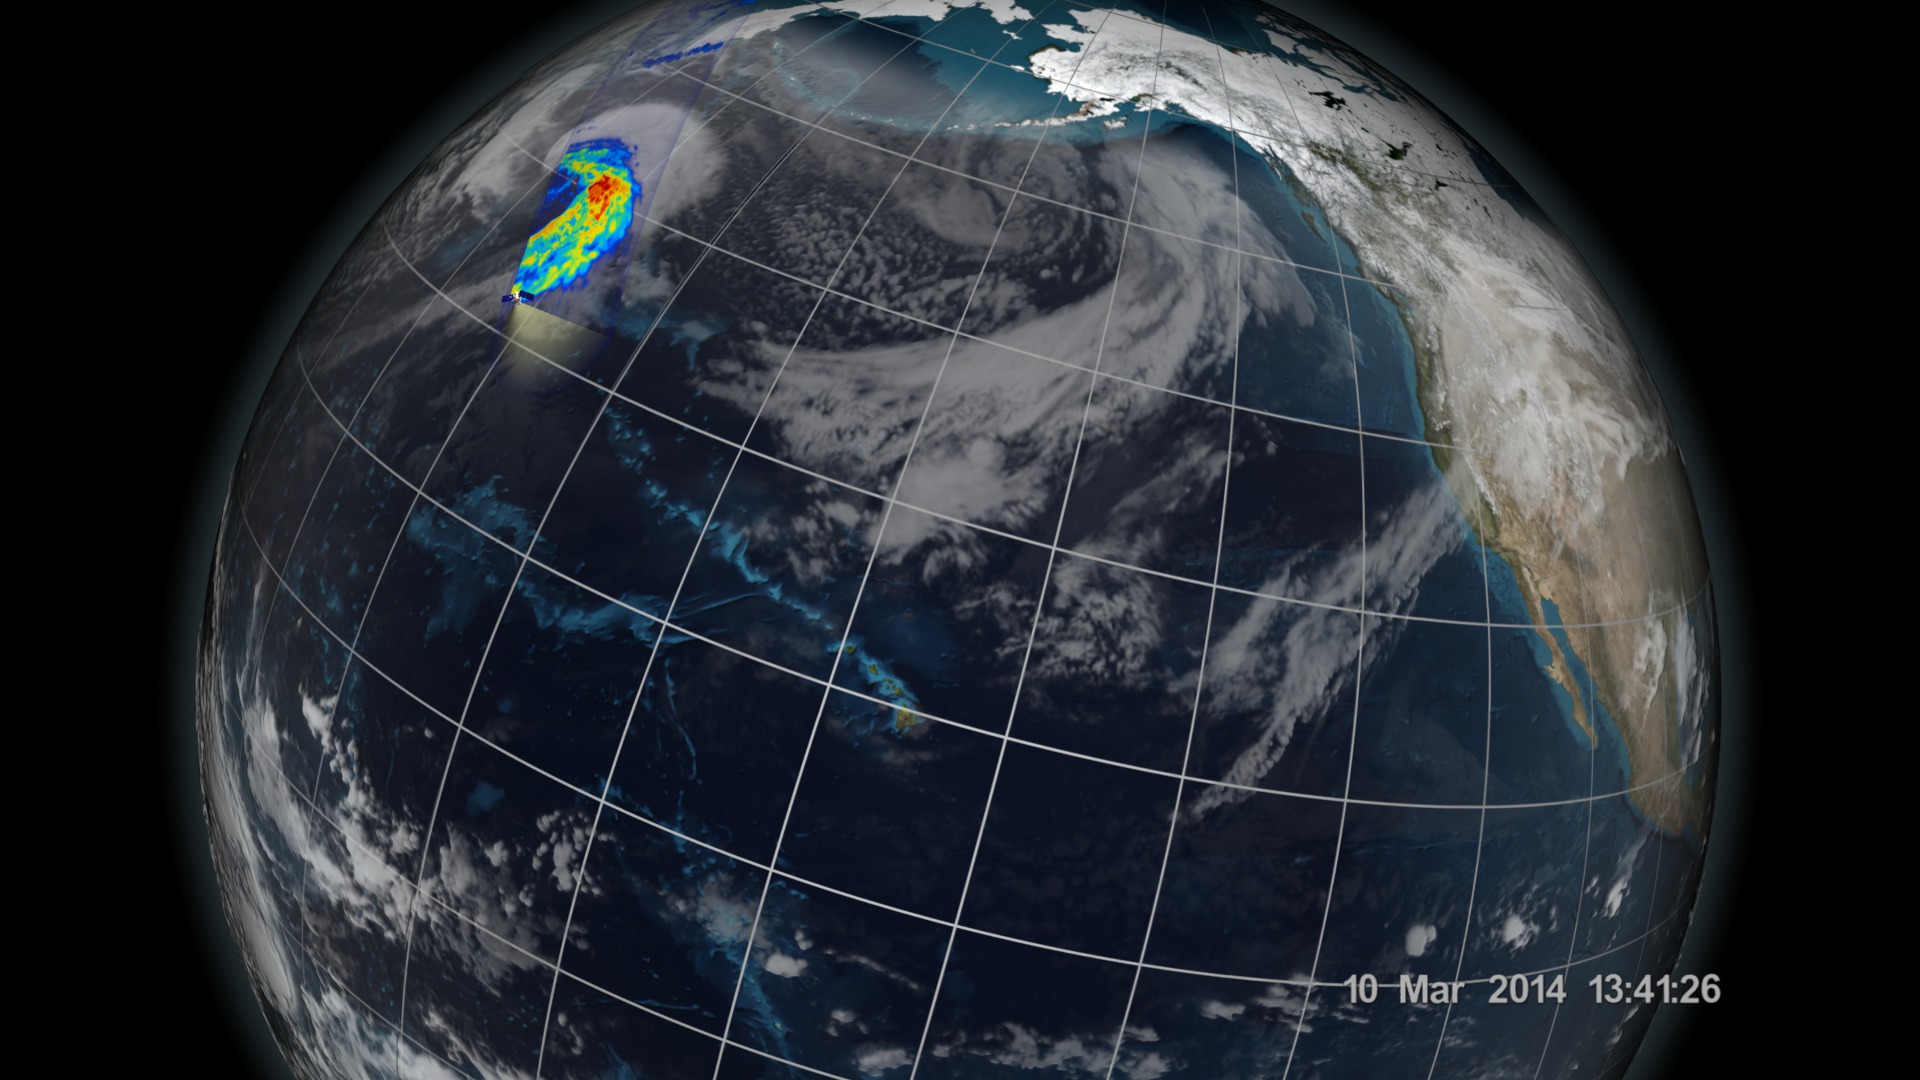
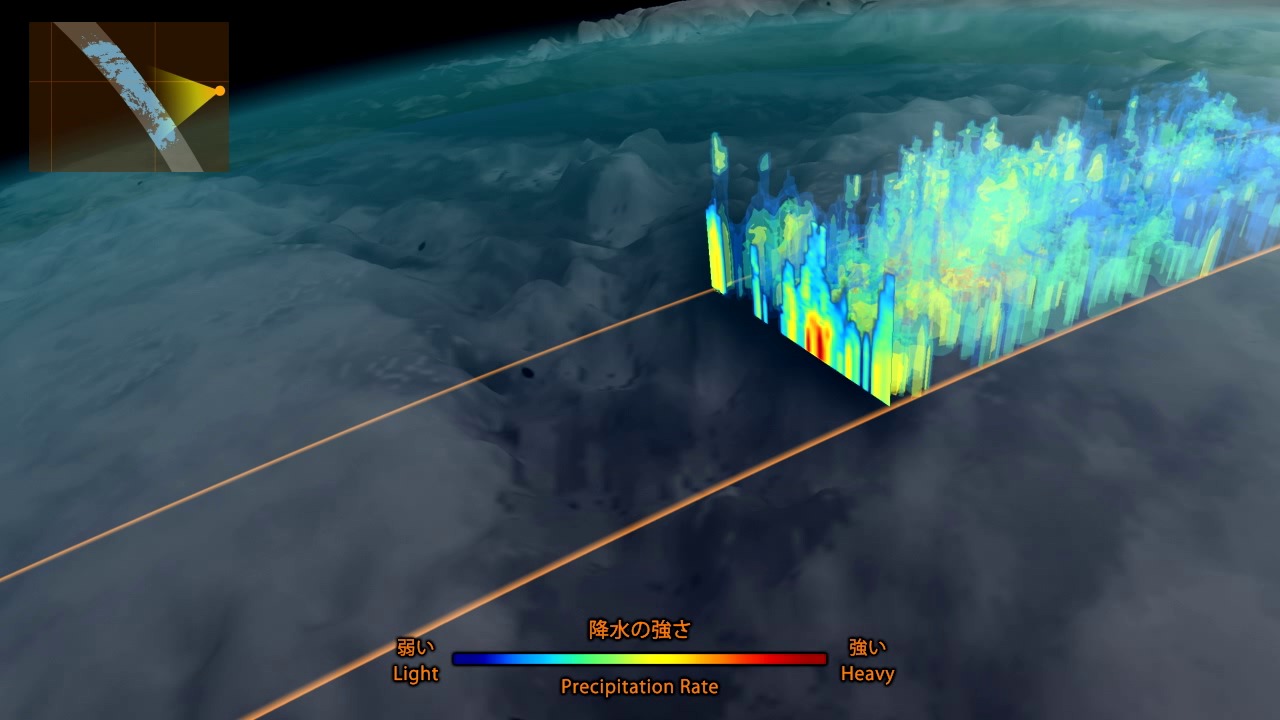
On March 10, the Core Observatory passed over an extra-tropical cyclone about 1055 miles (1700 kilometers) due east of Japan's Honshu Island. This visualization shows data from the GPM Microwave Imager, which observes different types of precipitation with 13 channels. Scientists analyze that data and then use it to calculate the light to heavy rain rates and falling snow within the storm.
Narrated video using the first light visualizations of the GPM GMI instrument.
For complete transcript, click here.
This video is also available on our YouTube channel.
Credits
Please give credit for this item to:
NASA's Goddard Space Flight Center
-
Animator
-
Alex Kekesi
(Global Science and Technology, Inc.)

-
Alex Kekesi
(Global Science and Technology, Inc.)
-
Video editor
- Ryan Fitzgibbons (USRA)
-
Narration
- Ryan Fitzgibbons (USRA)
-
Narrator
- Dan Gallagher (USRA)
-
Producer
- Ryan Fitzgibbons (USRA)
-
Scientists
- Gail Skofronick Jackson (NASA/GSFC)
- Chris Kidd (University of Maryland)
- Dalia B Kirschbaum (NASA/GSFC)
-
Project support
- Aaron E. Lepsch (ADNET Systems, Inc.)
-
Writer
- Ellen T. Gray (ADNET Systems, Inc.)
Missions
This page is related to the following missions:Series
This page can be found in the following series:Tapes
The media on this page originally appeared on the following tapes:-
GPM GMI First Light
(ID: 2014027)
Tuesday, March 25, 2014 at 4:00AM
Datasets used
-
Brightness Temperature [GPM: GMI]
ID: 821Credit: Data provided by the joint NASA/JAXA GPM mission.
See all pages that use this dataset -
Rain Rates (Surface Precipitation) [GPM: GMI]
ID: 822Credit: Data provided by the joint NASA/JAXA GPM mission.
See all pages that use this dataset
Note: While we identify the data sets used on this page, we do not store any further details, nor the data sets themselves on our site.
Related
- ID: 11470
 Produced Video
 - ID: 4153
 Visualization
 - ID: 11509
 Produced Video
 - ID: 4135
 Visualization
Release date
This page was originally published on Tuesday, March 25, 2014.
This page was last updated on Saturday, February 1, 2025 at 12:18 AM EST.