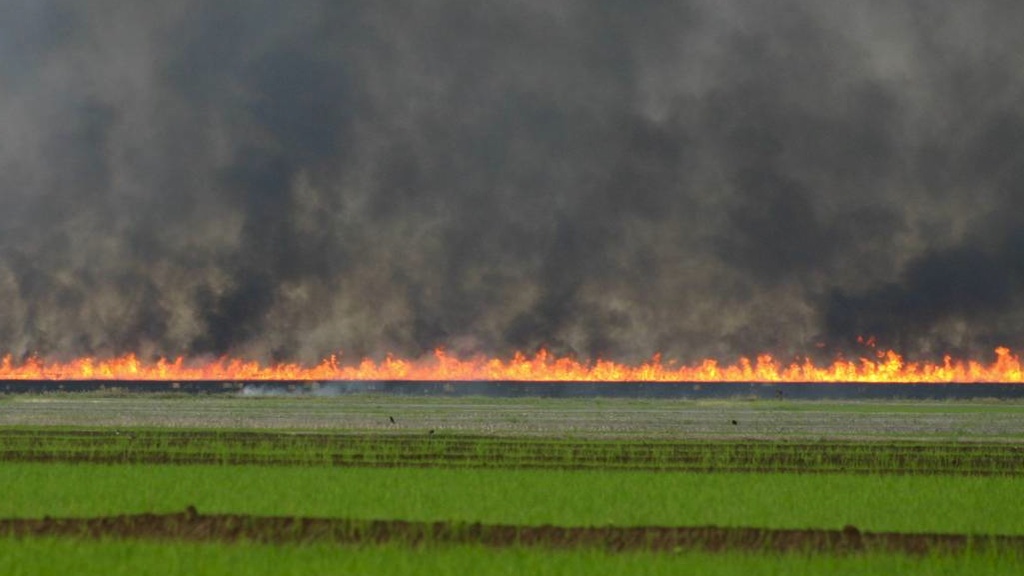
A Look Back at a Decade of Fires
For more than a decade, instruments on Terra and Aqua, two of NASA's flagship Earth-observing satellites, have scanned the surface of our planet for fires four times a day. The instruments, both Moderate Resolution Imaging Spectroradiometers (MODIS), have revolutionized what scientists know about fire's role in land cover change, ecosystem processes, and the global carbon cycle by allowing researchers to map the characteristics and global distribution of fires in remarkable detail. The collection of videos below provides perspective on how global fires impact humans and our planet.
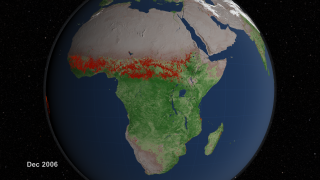
Fire observations from around the world taken over nearly 10 years are shown in this visualization of NASA satellite data.
For complete transcript, click here.
UC Irvine scientist Jim Randerson talks about how fires influence climate.
For complete transcript, click here.
NASA scientist Amber Soja talks about the impact of fire on human health and air quality.
For complete transcript, click here.
University of Maryland scientist Chris Justice explains how some fires are essential to maintaining the ecosystem.
For complete transcript, click here.
For More Information
Credits
Please give credit for this item to:
NASA/Goddard Space Flight Center
-
Animator
- Lori Perkins (NASA/GSFC)
-
Video editor
- Kayvon Sharghi (USRA)
-
Interviewees
- Chris Justice (University of Maryland)
- Amber Soja (NASA/LaRC)
- Jim Randerson (University of California, Irvine)
-
Narrator
- Jefferson Beck (USRA)
-
Producer
- Kayvon Sharghi (USRA)
-
Scientists
- Chris Justice (University of Maryland)
- Louis Giglio (SSAI)
- Luigi Boschetti (University of Maryland College Park)
-
Videographer
- Rob Andreoli (Advocates in Manpower Management, Inc.)
-
Writers
- Kayvon Sharghi (USRA)
- Adam P Voiland (Wyle Information Systems)
Missions
This page is related to the following missions:Series
This page can be found in the following series:Tapes
The media on this page originally appeared on the following tapes:-
NASA.gov Fires Package
(ID: 2011110)
Tuesday, October 18, 2011 at 4:00AM
Datasets used
-
Fire Location [Terra and Aqua: MODIS]
ID: 496Credit: Fire location data courtesy of MODIS Rapid Response Project (NASA/GSFC and University of Maryland - http://rapidfire.sci.gsfc.nasa.gov)
See all pages that use this dataset -
NDVI (Normalized Difference Vegetation Index (NDVI)) [Terra and Aqua: MODIS]
ID: 633 -
Ice and Snow (Pixel Reliability (value=2)) [Terra and Aqua: MODIS]
ID: 714
Note: While we identify the data sets used on this page, we do not store any further details, nor the data sets themselves on our site.
Related
- ID: 10831
 Produced Video
 - ID: 3868
 Visualization
Release date
This page was originally published on Thursday, October 20, 2011.
This page was last updated on Thursday, October 10, 2024 at 12:15 AM EDT.