|
NASA's Great Zooms: A Case Study Gregory W. Shirah and Horace G. Mitchell Scientific Visualization Studio
|
|
|---|---|
|
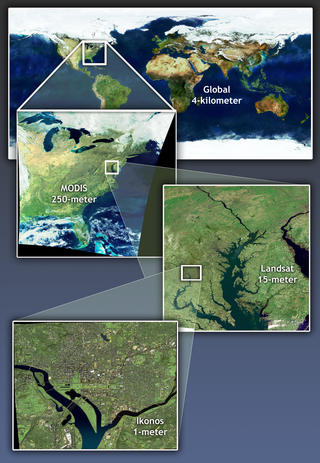
Abstract This paper examines a series of NASA outreach visualizations created using several layers of remote sensing satellite data ranging from 4-kilometers per pixel to 1-meter per pixel. The viewer is taken on a seamless, cloud free journey from a global view of the Earth down to ground level where buildings, streets, and cars are visible. The visualizations were produced using a procedural shader that takes advantage of accurate georegistration and color matching between images. The shader accurately and efficiently maps the data sets to geometry allowing for animations with few perceptual transitions among data sets. We developed a pipeline to facilitate the production of over twenty zoom visualizations. Millions of people have seen these visualizations through national and international media coverage. CR Categories: I.3.7 [Computer Graphics]: Three-Dimensional Graphics and Realism -- Color, shading, shadowing, and texture; J.2 [Physical Sciences and Engineering]: Earth and atmospheric sciences Additional Keywords: visualization, remote sensing, renderman, shader, georegistration, color matching. 1 INTRODUCTION The Scientific Visualization Studio (SVS) at the National Aeronautics and Space Administration's (NASA) Goddard Space Flight Center produces visualizations of Earth and space science data to explain NASA research and mission results. A recent series of visualizations consists of zooms from a global view of the Earth through finer and finer detail to a view of a particular landmark structure, such as the US Capitol Building. What makes these visualizations unique is the use of actual cloudless satellite imagery in zooms so seamless that every frame is an accurate representation of the detail visible at a particular height. These animations illustrate the role resolution plays in remote sensing measurements by creating the illusion of a movie created from a single camera in space with a giant zoom lens (although the Earth is thankfully never free of clouds). The SVS has created these "great" zooms of about 26 different locations in the United States [1]. This paper discusses the development of our initial zoom visualizations and the problems we encountered. Solutions are then identified, primarily in the form of a registration shader, followed by the production pipeline we created to produce the majority of the zoom visualizations. |
2 INITIAL EFFORTS
In the summer of 2000, Darrel Williams, the Landsat Project scientist, tasked the SVS to create a visualization of a dramatic zoom out from Washington DC to begin an Earth Science symposium [2] at the Smithsonian National Air and Space Museum. He provided four satellite images to illustrate some of the scales at which remote sensing data is acquired:
1 2 3 4 Next Page>> |
