Urban Growth Seen from SpaceAsk anyone who lives in D.C. or New York or Phoenix: urban growth is booming and it's having profound effects on people's lives. Now research data confirms it. Using sophisticated remote sensing systems, scientists have evidence of significant changes to regional geography. At this year's annual meeting of the American Association for the Advancement of Science in Washington, D.C., researchers present findings about their study of wide scale urbanization. While some of their work demonstrates common sense causes and effects from growth, others provide startling evidence for heavy urban growth apparently causing major changes to local weather and climate patterns. ATLANTA SPREADS OUT AND HEATS UP
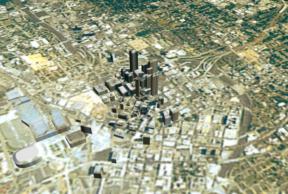
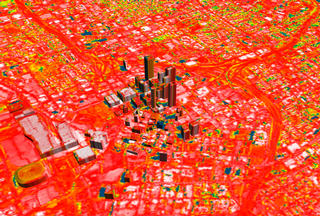
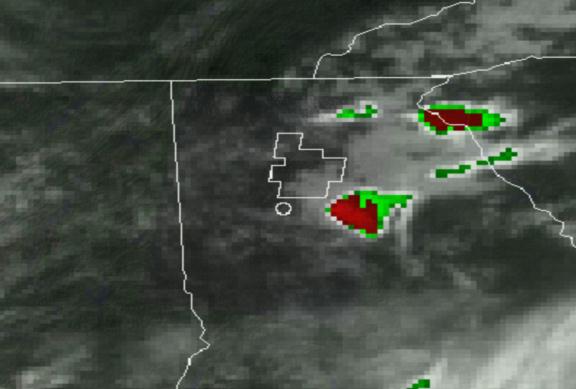
Images and Movies It's official: in terms of annual take-offs and landings, Atlanta's Hartsfield Airport is now the busiest in the world. But airport traffic is only one of many urban growth signs in Georgia's cosmopolitan jewel. Burgeoned by a robust economy, "Hot-Lanta" has seen phenomenal growth recently, from soaring downtown high rises to sprawling suburbs and industrial parks. And hot it is: the home of the Braves is so thick with asphalt and air conditioners that it's become a "heat island", soaking up radiant energy during the day and holding onto it at night. Data indicates that heavily developed parts of the Atlanta metro remain warmer than surrounding areas, effectively trapping heat like a sponge holds water. Many of those localized heat sinks are centered around areas where growth is greatest, especially along county borders, transportation routes, and downtown. But besides bigger traffic jams, researchers say all this growth is changing the region's climate. Heat rising from developed areas is spawning thunderstorms. Notice how the storms in these weather images begin to coalesce directly over the hottest parts of town. As the city grows, so grow the thunderheads. 3D Heat Signature Using a specially outfitted Lear Jet, NASA researchers collected thermal data about the Atlanta metro area. As shown here, that aircraft data is lined up with a larger image, taken from the orbiting Landsat 5 satellite. The image starts in "natural" color and immediately transitions to a daytime temperature reading, with white and red indicating highest temperatures, respectively, and blues indicating cooler temperatures. Notice how the buildings themselves help keep small areas cool, casting shadows across the pavement and walls of surrounding structures. As the city rotates, the data fades to a nighttime reading. Using the same color scale, you can see how much heat remains locked in the developed areas of the city, a phenomena which becomes instantly apparent as the picture zooms out again to show the long stripe of data draped across the terrain.
 Images and Movies These data were collected May 11 and 12, 1997. While daytime air temperatures on that date were only about 80 degrees, surface temperatures reached as much as 118 (F); nighttime air temperatures hovered between 50 and 55, but due to the heat sink, surface temperatures hung on as high as 75 degrees. Patterns of Urban Growth
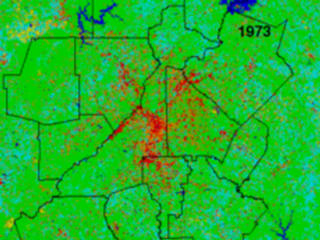
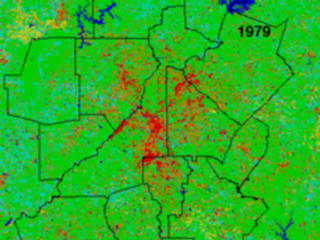
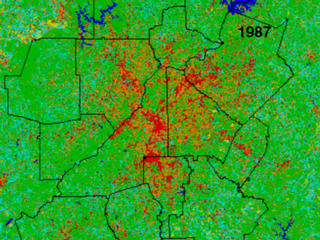
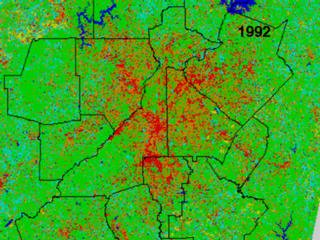
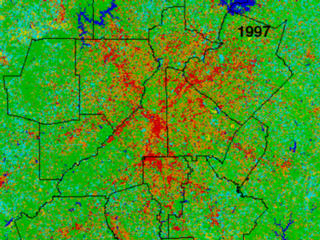
 Images and Movies In the past 17 years, urban growth in Atlanta has spread and blossomed, but not without dramatic changes to the surrounding area. Large patches of crop land have given way to commercial and residential developments, and industrialization along some of the main roadways have dramatically altered the face of Georgia's largest city. In this visualization, red and orange points indicate areas of highest urban growth. Researchers assembled data from Landsat satellites in the early 70's to the late 90's and created plots of growth over time, providing valuable context for more detailed studies of air quality, climate changes, and urban planning. This series of images, green and light blue spaces yield to ever spreading red and orange points. Cloud Formation Atlanta's strong urban growth is being studied for a variety
of reasons. One of the most dramatic areas of study concerns the way intense
development may be affecting the region's climate. In the following animation,
we see the outlines of Atlanta and Hartsfield Airport; the tiny dot in
the lower left corner of Atlanta is the downtown skyline. As observed
by one of the Geostationary Operational Environmental Satellite (GOES),
clouds begin forming over the city and pick up strength and size as they
develop, moving east. Research suggests that as the city holds onto heat
at night, it creates a low pressure system, with hot air rising and cooler
surrounding air rushing in to replace it. That cooler air condenses and
forms thunderclouds. But now there's evidence suggesting the phenomenon
may be more intense over heavily urbanized areas than in naturally occurring
places. In the animation, red indicates the heaviest concentration of
precipitation with thick, high clouds; green are less intense storm areas,
and the thick white areas are dense surrounding clouds. CITY LIGHTS
OFFER CLUES ON
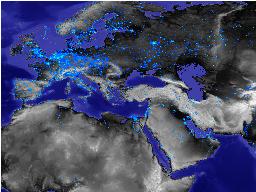
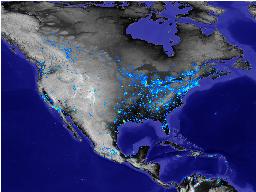
Images Growth in "mega-cities" is altering the landscape and the atmosphere in such a way as to curtail normal photosynthesis. By using data from The Defense Meteorological Satellite Program's Operational Linescan System, researchers have been able to look at urban sprawl from monitoring the emission of light from cities at night. By overlaying these "light maps" onto other data such as soil and vegetation maps, the research shows that urbanization can have a variable but measurable impact on photosynthetic productivity. Annual photosynthetic productivity can be reduced by as much as 20 days in some areas where urbanization is intense. This is not unlike turning the lights off in a greenhouse for 20 days out of the growing season. The findings are rich with information. In some areas with limited resources, the research shows that human activity can increase productivity by altering the environment. This was the case for arid and semi-arid areas where lawn irrigation and planting changed the ecosystems from shrub vegetation and desert to deciduous forests. Another interesting discovery was that urbanization seems to elongate the growing season while still reducing overall productivity. Vegetation greens up earlier in the spring and takes longer to fade out in the fall but it tends to have lower peak-season productivity than nearby areas unaffected by urbanization. This could be demonstrating a profound link to the urban heat island effect, and it has implications in climate change, particularly in the Northern Hemisphere where urban development is most intense. As more people urbanize highly productive land, this research should help planners make the difficult but vital decisions necessary for responsible and sustainable growth strategies.
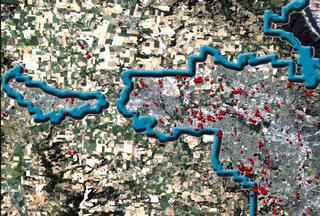
CITY ZONING AND URBAN GROWTH - A COMPARISON Urbanization is as much a function of planning as it is of economic vitality. From space, two large U.S. metro areas show dramatically different signals of urban sprawl and growth, largely the result of different zoning strategies. Portland, Oregon and the Washington, D.C. metro have both benefited from the robust economy, with growth propelling construction and development in both areas. But the greater Washington metro is a complex combination of The District and municipalities in two bordering states and hasn't regulated growth by a uniform standard. Portland on the other hand has strictly limited urban sprawl, largely confining it to areas within city boundaries. It's not so simple to say that one way of managing an urban area is better than another; cities have varied personalities and needs just like people. But many scientists hope that this research will help urban planners make better decisions about the futures of what are coming to be known as mega-cities.Portland, Oregon and Metro Area The city of Portland has strictly controlled how urbanization can spread. As a result, the vast majority of new construction has taken place inside the city boundaries, largely preserving the patchwork pattern found outside the blue border you see on the screen. Across the Columbia River along the northern border of the city, signs of wide spread growth in Washington State appear immediately from the red points sprouting all through town. These images were created from one set of data and shows progressive growth from 1986-1996.
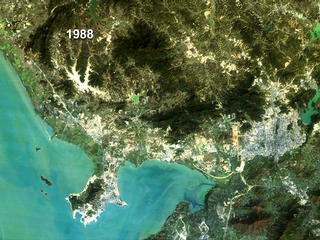
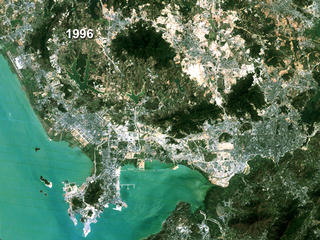
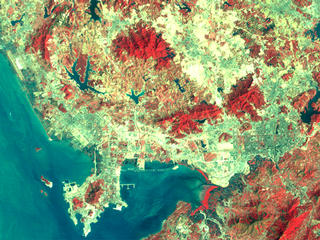
Washington, D.C and Metro Area The city limits are highlighted in purple. Surrounding it in blue is the infamous Washington Beltway, a heavily traveled, highly interconnected loop of road that runs around city. As the visualization flies over various locations, notice how growth progresses over time. These images were created from three sets of data and show progressive growth from 1973 to 1996. There appears to be little in the way of a unified plan for construction, with red points seeming to appear at random locations over three time intervals. It's partially as a result of this explosive growth that population and total number of vehicles in the D.C. area have increased roughly 13% and 22% respectively since 1990.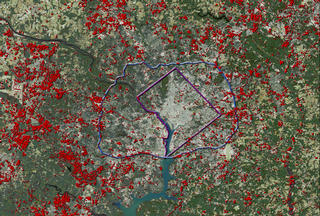 Images and Movies Shenzhen, China: Explosive Growth Changes the Shape of the Continent The People's Republic of China is one of the fastest growing economies in the world. Much of the Chinese political and cultural landscape is in a state of transition, and economic development is remarkably strong, particularly in southern industrial cities. As seen by Landsat, Shenzhen, China practically transforms from a regional urban center to a metropolitan powerhouse in the space of roughly ten years. Notice how dramatically the coast changes around the peninsula in the center of your screen. Huge structures emerge in the waters off-shore.
Images and Movies On land, note the massive signs of construction and land conversion, with large tracts of geography being developed. By combining economic and land use data, researches hope to better understand the relationship between economic activity and land use change. Spreading Urbanization These Landsat 5 images show rapid growth around Shenzhen. Notice how
roads, bridges, and massive construction projects transform the landscape.
New structures appear off the southern coast, and highways grow less distinct
against the background as think construction projects spread along the
sides of the roads. Also notice how the massive growth alters lakes and
mountains in the area, adding sediment to the water and changing borders
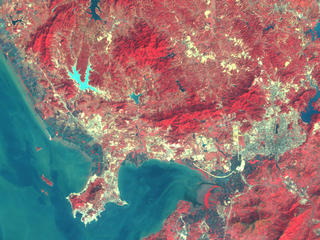
of natural features. Changes in Vegetation As construction goes up, something has to come down. In these images,
the same scenes are presented in a way that highlights vegetation concentration.
Red indicates density of plant life, and as becomes immediately apparent,
vegetation all but disappears across the region over the last ten years.
By using data like this, researchers can better understand the causes
of environmental changes they find in cities like Shenzhen. By better
understanding the causes, researchers and policy makers hope to be able
to better monitor a region's overall health. LANDSAT AND GOES - The Satellites LandsatLandsat 7 Movie Landsat 7 is the latest in a highly successful series of satellites. The program has been monitoring the Earth for over 25 years. It roared into orbit aboard a Boeing Delta II rocket, launched on April 15, 1999 from Vandenberg Air Force Base in California. Managed and developed by NASA's Goddard Space Flight Center, Landsat 7 was constructed by Lockheed Martin at their facility in Valley Forge, Pennsylvania. Data is available to researchers through a browsable internet interface, and can be delivered at a relatively low cost to users.
The Geostationary Operational Environmental Satellite (GOES) is actually one of a constellation of instruments positioned in fixed orbits over North America. The GOES satellites monitor large scale weather systems, as well as other aspects of the changing planet beneath. For More Information on the GOES Satellite This multimedia project is the work of a dedicated team of researchers, animators, and media specialists. A companion video to this web site is available from NASA-TV. Below are a list of agencies, departments, and researchers who provided expertise and data for this production: NASA - Goddard Space Flight Center Scientific Visualization Studio Television Production NASA-TV/GSFC
|
