Earth
Sun
ID: 13557
GLOBAL OBSERVATIONS OF EARTH’S ENERGY BALANCE
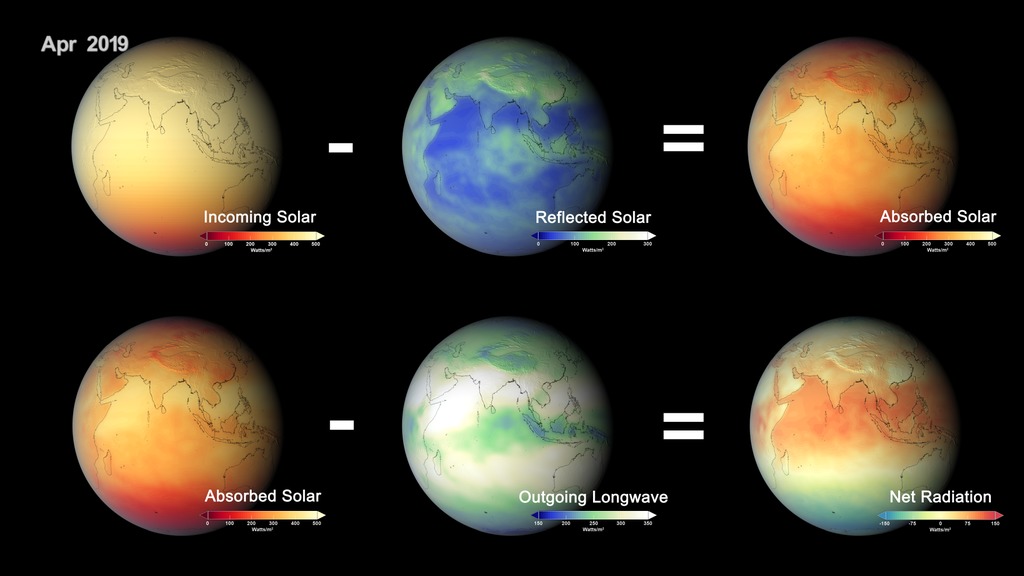
With the launch of NASA’s Terra Satellite Earth Observing System on Dec. 18, 1999, and subsequent ‘first light’ of the Cloud’s and the Earth’s Energy Radiant System (CERES) instrument on February 26, 2000, NASA gave birth to what ultimately would become the first long-term global observational record of Earth’s energy balance. This key indicator of the climate system describes the delicate and complex balance between how much of the sun’s energy reaching Earth is absorbed and how much thermal infrared radiation is emitted back to space.
“Absorbed solar radiation fuels the climate system and life on our planet,” said Norman Loeb, CERES Principal Investigator. “The Earth sheds heat by emitting outgoing radiation.”
For Earth’s temperature to be stable over long periods of time, absorbed solar and emitted thermal radiation must be equal. Increases in greenhouse gases, like carbon dioxide and methane, trap emitted thermal radiation from the surface and reduce how much is lost to space, resulting in a net surplus of energy into the Earth system. Most of the extra energy ends up being stored as heat in the ocean and the remainder warms the atmosphere and land, and melts snow and ice. As a consequence, global mean surface temperature increases and sea levels rise.
Much like a pulse or heartbeat, CERES monitors reflected solar and emitted thermal infrared radiation, which together with solar irradiance measurements is one of Earth’s ‘vital signs’. Better understanding Earth’s energy balance enables us to be informed and adapt to a changing world.
Though CERES on Terra marked the first global measurements of Earth’s energy balance, the CERES Pathfinder Mission on the Tropical Rainfall Measuring Mission (TRMM) began measuring the Earth’s radiant energy system in 1997. CERES is a key component of NASA’s Earth Observing System, with six active CERES instruments on satellites orbiting Earth and taking data.
A GLOBAL WARMING ‘HIATUS’
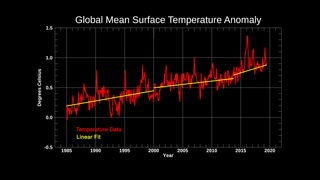
A global warming hiatus is a period of relatively modest rise in global average surface temperature. During a hiatus, the jagged edges of surface temperature plots appear to level out or display less of an incline in a normally rising trend. This pause is not a part of the long-term trend of consistently increasing warmth.
Climate models show that hiatuses are fairly common and can easily last 10 or more years. The most recent hiatus occurred during the first part of the 21st century and ended just prior to the 2015/2016 El Niño, when the global mean surface temperature showed a major increase. Launched during the early part of the hiatus period, the Terra mission has provided scientists with unprecedented observations of the hiatus, the 2015/2016 El Niño, and the current warming period.
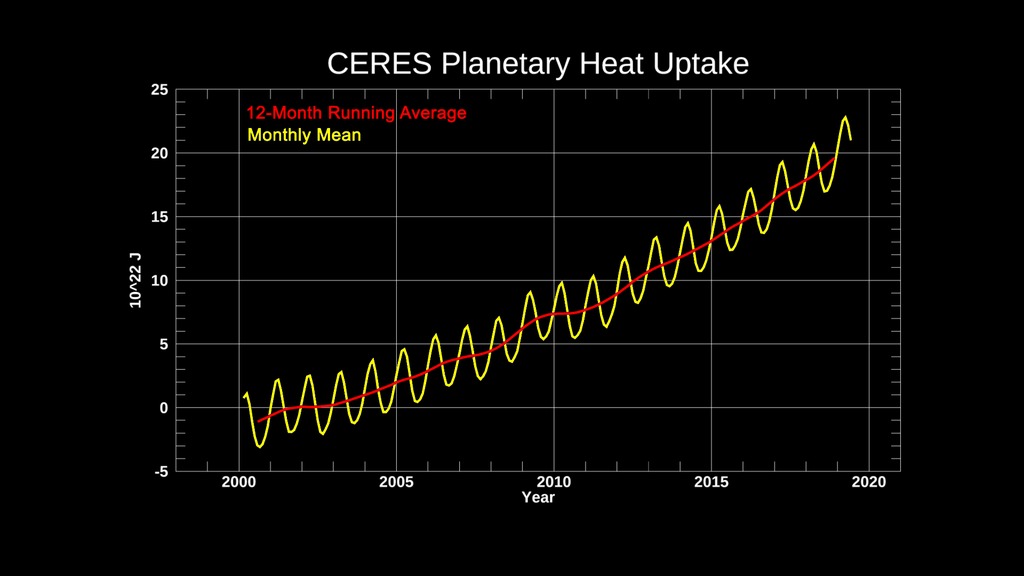
In contrast to global mean surface temperature, when we look at the Earth’s energy balance from CERES, we still see a continual steady rise in heat uptake, even during the hiatus.
“The change in planetary heat uptake provides a better indication of how Earth’s climate is changing than surface temperature,” said Loeb.
The ‘hiatus’ was a surface temperature phenomenon.
FLUCTUATIONS EXPLAINED
Over short time intervals, surface temperatures can be quite erratic. Natural fluctuations in atmospheric wind patterns and ocean currents result in vertical mixing in the oceans that can temporarily warm or cool the ocean surface and air immediately above the surface.
During La Niña events, stronger easterly winds blowing across the tropical Pacific enhance vertical mixing in the ocean, bringing cooler water to the surface, a slowdown in surface warming, and an increase in ocean heat uptake at depths below 100 dbar (approximately 100 m). During El Niño conditions, easterly winds weaken, causing less vertical mixing in the ocean and warmer surface temperatures.
The recent hiatus period was characterized predominantly by La Niña conditions, explaining the weaker rise in global mean surface temperature. Following the hiatus, El Niño conditions prevailed with substantial surface warming.
Hiatus periods notwithstanding, the extra heat that is being added to the Earth system is driving the observed long-term increase in global mean surface temperature. Because the oceans take a long time to warm up, the oceans introduce a delay or lag in the warming, but the warming is eventually realized. This delay is sometimes referred to by scientists as the ‘warming commitment’ or ‘warming in the pipeline.’
Scientists are constantly looking for ways to better monitor changes in Earth’s Energy Balance. Loeb is working with colleagues at the National Oceanic and Atmospheric Administration (NOAA) to combine continued satellite observations with Argo, a global array of 3,800 free-drifting profiling floats that measure the temperature and salinity of the upper 2,000 meters of the ocean. The CERES satellite data provide vital measurements of the energy entering and leaving Earth while the Argo data indicate where energy is stored in the ocean, both geographically and vertically.
We rely on climate models to make projections of future climate so that we can make informed decisions about societal adaptation in a rapidly changing world. Climate modelers in turn rely on having quality long-term global measurements available to test and refine their models.
Continuing the CERES record, which has enabled global measurements of Earth’s Energy Balance, is certainly a part of the plan.
Placing the Recent Hiatus Period in an Energy Balance Perspective
With the launch of NASA’s Terra Satellite Earth Observing System on Dec. 18, 1999, and subsequent ‘first light’ of the Cloud’s and the Earth’s Energy Radiant System (CERES) instrument on February 26, 2000, NASA gave birth to what ultimately would become the first long-term global observational record of Earth’s energy balance. This key indicator of the climate system describes the delicate and complex balance between how much of the sun’s energy reaching Earth is absorbed and how much thermal infrared radiation is emitted back to space.
“Absorbed solar radiation fuels the climate system and life on our planet,” said Norman Loeb, CERES Principal Investigator. “The Earth sheds heat by emitting outgoing radiation.”
For Earth’s temperature to be stable over long periods of time, absorbed solar and emitted thermal radiation must be equal. Increases in greenhouse gases, like carbon dioxide and methane, trap emitted thermal radiation from the surface and reduce how much is lost to space, resulting in a net surplus of energy into the Earth system. Most of the extra energy ends up being stored as heat in the ocean and the remainder warms the atmosphere and land, and melts snow and ice. As a consequence, global mean surface temperature increases and sea levels rise.
Much like a pulse or heartbeat, CERES monitors reflected solar and emitted thermal infrared radiation, which together with solar irradiance measurements is one of Earth’s ‘vital signs’. Better understanding Earth’s energy balance enables us to be informed and adapt to a changing world.
Though CERES on Terra marked the first global measurements of Earth’s energy balance, the CERES Pathfinder Mission on the Tropical Rainfall Measuring Mission (TRMM) began measuring the Earth’s radiant energy system in 1997. CERES is a key component of NASA’s Earth Observing System, with six active CERES instruments on satellites orbiting Earth and taking data.
A GLOBAL WARMING ‘HIATUS’
A global warming hiatus is a period of relatively modest rise in global average surface temperature. During a hiatus, the jagged edges of surface temperature plots appear to level out or display less of an incline in a normally rising trend. This pause is not a part of the long-term trend of consistently increasing warmth.
Climate models show that hiatuses are fairly common and can easily last 10 or more years. The most recent hiatus occurred during the first part of the 21st century and ended just prior to the 2015/2016 El Niño, when the global mean surface temperature showed a major increase. Launched during the early part of the hiatus period, the Terra mission has provided scientists with unprecedented observations of the hiatus, the 2015/2016 El Niño, and the current warming period.
In contrast to global mean surface temperature, when we look at the Earth’s energy balance from CERES, we still see a continual steady rise in heat uptake, even during the hiatus.
“The change in planetary heat uptake provides a better indication of how Earth’s climate is changing than surface temperature,” said Loeb.
The ‘hiatus’ was a surface temperature phenomenon.
FLUCTUATIONS EXPLAINED
Over short time intervals, surface temperatures can be quite erratic. Natural fluctuations in atmospheric wind patterns and ocean currents result in vertical mixing in the oceans that can temporarily warm or cool the ocean surface and air immediately above the surface.
During La Niña events, stronger easterly winds blowing across the tropical Pacific enhance vertical mixing in the ocean, bringing cooler water to the surface, a slowdown in surface warming, and an increase in ocean heat uptake at depths below 100 dbar (approximately 100 m). During El Niño conditions, easterly winds weaken, causing less vertical mixing in the ocean and warmer surface temperatures.
The recent hiatus period was characterized predominantly by La Niña conditions, explaining the weaker rise in global mean surface temperature. Following the hiatus, El Niño conditions prevailed with substantial surface warming.
Hiatus periods notwithstanding, the extra heat that is being added to the Earth system is driving the observed long-term increase in global mean surface temperature. Because the oceans take a long time to warm up, the oceans introduce a delay or lag in the warming, but the warming is eventually realized. This delay is sometimes referred to by scientists as the ‘warming commitment’ or ‘warming in the pipeline.’
Scientists are constantly looking for ways to better monitor changes in Earth’s Energy Balance. Loeb is working with colleagues at the National Oceanic and Atmospheric Administration (NOAA) to combine continued satellite observations with Argo, a global array of 3,800 free-drifting profiling floats that measure the temperature and salinity of the upper 2,000 meters of the ocean. The CERES satellite data provide vital measurements of the energy entering and leaving Earth while the Argo data indicate where energy is stored in the ocean, both geographically and vertically.
We rely on climate models to make projections of future climate so that we can make informed decisions about societal adaptation in a rapidly changing world. Climate modelers in turn rely on having quality long-term global measurements available to test and refine their models.
Continuing the CERES record, which has enabled global measurements of Earth’s Energy Balance, is certainly a part of the plan.
Source Material
Related

Credits
Trent L. Schindler (USRA): Lead Visualizer
Jonathan Gleason (NASA/LARC): Lead Producer
Denise Lineberry (NASA/LARC): Lead Writer
Norman Loeb (NASA/LRC): Lead Scientist
Jefferson Beck (USRA): Producer
Ellen T. Gray (ADNET Systems, Inc.): Producer
Jonathan Gleason (NASA/LARC): Lead Producer
Denise Lineberry (NASA/LARC): Lead Writer
Norman Loeb (NASA/LRC): Lead Scientist
Jefferson Beck (USRA): Producer
Ellen T. Gray (ADNET Systems, Inc.): Producer
Please give credit for this item to:
NASA's Goddard Space Flight Center
NASA's Goddard Space Flight Center
Short URL to share this page:
https://svs.gsfc.nasa.gov/13557
Data Used:
Note: While we identify the data sets used in these visualizations, we do not store any further details nor the data sets themselves on our site.
Keywords:
SVS >> Climate
GCMD >> Earth Science >> Atmosphere >> Atmospheric Radiation >> Radiative Flux
SVS >> Climate Change
NASA Science >> Earth
NASA Science >> Sun
GCMD keywords can be found on the Internet with the following citation: Olsen, L.M., G. Major, K. Shein, J. Scialdone, S. Ritz, T. Stevens, M. Morahan, A. Aleman, R. Vogel, S. Leicester, H. Weir, M. Meaux, S. Grebas, C.Solomon, M. Holland, T. Northcutt, R. A. Restrepo, R. Bilodeau, 2013. NASA/Global Change Master Directory (GCMD) Earth Science Keywords. Version 8.0.0.0.0
https://svs.gsfc.nasa.gov/13557
Data Used:
Terra/CERES
The CERES instrument aboard many Earth-orbiting satellites records the flow of reflected Solar radiation and reprocessed longwave radiation in the Earth's radiation budget.
Aqua/CERES/Incoming Solar Radiation
Data from SORCE for the flux magnitude at the Earth's orbit, coupled with solar incidence angles based on CERES measurement locations and times
Terra/CERES/Outgoing Longwave Radiation
Terra/CERES/Reflected Solar Radiation
Terra/CERES/Shortwave Radiation
Keywords:
SVS >> Climate
GCMD >> Earth Science >> Atmosphere >> Atmospheric Radiation >> Radiative Flux
SVS >> Climate Change
NASA Science >> Earth
NASA Science >> Sun
GCMD keywords can be found on the Internet with the following citation: Olsen, L.M., G. Major, K. Shein, J. Scialdone, S. Ritz, T. Stevens, M. Morahan, A. Aleman, R. Vogel, S. Leicester, H. Weir, M. Meaux, S. Grebas, C.Solomon, M. Holland, T. Northcutt, R. A. Restrepo, R. Bilodeau, 2013. NASA/Global Change Master Directory (GCMD) Earth Science Keywords. Version 8.0.0.0.0


