Clouds 101
- Visualizations by:
- Jenny McElligott
- Scientific consulting by:
- Norman Loeb
- Produced by:
- Kathleen Gaeta
- View full credits
Movies
- Clouds_101_Lock.mp4 (1920x1080) [974.5 MB]
- Clouds_101_Lock.webm (1920x1080) [13.4 MB]
Captions
- Clouds_101_audio_otter_ai.en_US.srt [9.6 KB]
- Clouds_101_audio_otter_ai.en_US.vtt [9.6 KB]
Images
- Screen_Shot_2022-10-19_at_1.52.39_PM_print.jpg (1024x578) [66.1 KB]
- Screen_Shot_2022-10-19_at_1.52.39_PM.png (2844x1607) [3.9 MB]
- Screen_Shot_2022-10-19_at_1.52.39_PM_thm.png (80x40) [8.7 KB]
- Clouds_101_Lock.00001_searchweb.png (320x180) [34.8 KB]
- Screen_Shot_2022-10-19_at_1.52.39_PM_web.png (320x180) [66.4 KB]
- Screen_Shot_2022-10-19_at_1.52.39_PM_searchweb.png (320x180) [66.0 KB]
Complete transcript available.
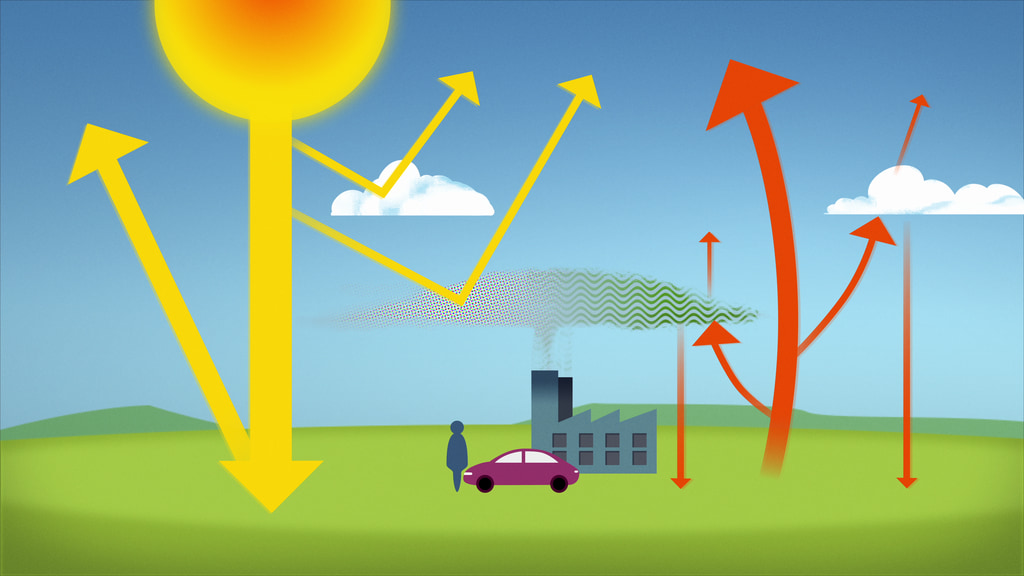
Clouds can tell us a lot about what weather we might expect to see, but they’re actually quite mysterious. The question is: Because clouds are produced by the climate, how will a changing climate impact clouds? And, conversely, clouds have an impact on our climate, so how will changing clouds affect a changing climate? Welcome to Clouds 101.
Credits
Please give credit for this item to:
NASA's Goddard Space Flight Center
Animator
- Jenny McElligott (AIMM) [Lead]
Scientist
- Norman Loeb (NASA/LRC) [Lead]
Producer
- Kathleen Gaeta (AIMM) [Lead]
Missions
This visualization is related to the following missions:Series
This visualization can be found in the following series:Related pages
IMPACTS 2022: NASA Planes Fly into Snowstorms to Study Snowfall
Feb. 10th, 2022
Read moreNASA’s Investigation of Microphysics and Precipitation for Atlantic Coast-Threatening Storms (IMPACTS) mission, which began in January and is planned to wrap up at the end of February, has seen upwards of 10 flights so far. Ultimately, what the IMPACTS team learns about snowstorms will improve meteorological models and our ability to use satellite data to predict how much snow will fall and where.Music credit: “Struggles” and “Natural Time Cycles” from Universal Production MusicComplete transcript available. On February 3rd, NASA’s P-3 took off at 8:00 am from the Wallops Flight Facility in Virginia. With ground operations coordinating its route with the ER-2, the IMPACTS team flew straight into a snowstorm, taking three passes at different elevations— 20,000 ft, 13,000 ft, and 11,000 ft. Both the ground team and the in-flight team kept a close eye on the weather forecast to ensure the best flight path for the aircraft and the instruments on board. On February 3rd, NASA’s P-3 took off at 8:00 am from the Wallops Flight Facility in Virginia. With ground operations coordinating its route with the ER-2, the IMPACTS team flew straight into a snowstorm, taking three passes at different elevations— 20,000 ft, 13,000 ft, and 11,000 ft. Both the ground team and the in-flight team kept a close eye on the weather forecast to ensure the best flight path for the aircraft and the instruments on board. Scientists flying on the P-3 on Thursday, February 3, 2022 study images of aggregated ice crystals taken by on-board instruments. IMPACTS team member keeps the P-3 aircraft’s flight path up-to-date with Air Traffic Control at the Wallops Flight Facility in Virginia on Friday, February 4, 2022. IMPACTS team members on board the P-3 aircraft monitor incoming data on Thursday, February 3, 2022 NASA’s P-3 aircraft is getting loaded up for its flight on February 4, 2022 out of Wallops Flight Facility in Virginia. IMPACTS scientist works from within the cockpit to coordinate flight plans with the pilots on Thursday, February 3, 2022. NASA pilots flying the P-3 aircraft navigate turbulence, bad weather, and flight coordination with the ER-2 on Thursday, February 3, 2022. NASA’s P-3 aircraft has been retrofitted for scientific instruments to fly with the IMPACTS mission on Thursday, February 3, 2022. The P-3 flies through a snowstorm somewhere between Kentucky and Indiana on Thursday, February 3, 2022. The P-3 nears the end of its flight close to Wallops Island, Virginia on Thursday, February 3, 2022. NASA’s Investigation of Microphysics and Precipitation for Atlantic Coast-Threatening Storms (IMPACTS) mission, which began in January and is planned to wrap up at the end of February, has seen upwards of 10 flights so far. The planes, a P-3 aircraft from NASA’s Wallops Flight Facility in Virginia and a high-flying ER-2 jet out of the Pope Army Airfield near Fayetteville, North Carolina, are chasing down snowstorms. Scientists are looking to better understand snowstorms, particularly how narrow structures called snow bands form, why some storms don’t have snow bands, and how snow bands can be used to predict snowfall. The data collected from the instruments on board the aircrafts will help the team relate properties of the snow particles and their environment to large-scale processes – such as the structure of clouds and precipitation patterns. Ultimately, what the IMPACTS team learns about snowstorms will improve meteorological models and our ability to use satellite data to predict how much snow will fall and where. For More InformationSee [https://www.nasa.gov/feature/esnt/2022/nasa-planes-fly-into-snowstorms-to-study-snowfall](https://www.nasa.gov/feature/esnt/2022/nasa-planes-fly-into-snowstorms-to-study-snowfall) Related pages
CERES Radiation Balance (Planetary Heat Uptake 2021 Update)
April 15th, 2021
Read moreA plotted view of planetary heat uptake since the beginning of the CERES data record showing an oscillating, monthly mean (yellow) and twelve-month running average (red line). These data show how much energy is added (absorbed) by Earth during the CERES period. The Clouds and the Earth’s Energy Radiant System (CERES) instrument is a key component of NASA’s Earth Observing System, with six active CERES instruments on satellites orbiting Earth and taking data. For Earth’s temperature to be stable over long periods of time, absorbed solar and emitted thermal radiation must be equal. Increases in greenhouse gases, like carbon dioxide and methane, trap emitted thermal radiation from the surface and reduce how much is lost to space, resulting in a net surplus of energy into the Earth system. Most of the extra energy ends up being stored as heat in the ocean and the remainder warms the atmosphere and land, and melts snow and ice. As a consequence, global mean surface temperature increases and sea levels rise. Much like a pulse or heartbeat, CERES monitors reflected solar and emitted thermal infrared radiation, which together with solar irradiance measurements is one of Earth’s ‘vital signs.’ Better understanding Earth’s energy balance enables us to be informed and adapt to a changing world. Related pages
Radiative Forcing
March 25th, 2021
Read moreWe now have the first continuous, near-real-time observations of how humans are increasing Earth’s greenhouse effect, developed by NASA and university partners. The research directly demonstrates how human activities are responsible for changing the climate. In the long run, all planets balance the energy they receive and the energy they emit back to space. Most of the energy coming from the Sun is shortwave radiation, or visible light. Energy absorbed by Earth warms the planet and longer wave (heat) energy is emitted back to space. Some light isn't absorbed by Earth because it is reflected by the atmosphere, particles, and clouds, or light colored surfaces. Some heat heading to space is trapped by clouds and the atmosphere and gets re-radiated back down — the greenhouse effect — causing more warming. This study filters out variations in Earth’s energy budget due to feedback processes to show changes from aerosols (reflective particles in the atmosphere) and increases in the greenhouse effect caused by emissions of gases like carbon dioxide — the energy changes caused by humans. A simplified animation of Earth's planetary energy balance: A planet’s energy budget is balanced between incoming (yellow) and outgoing radiation (red); On Earth, natural and human-caused processes affect the amount of energy received as well as emitted back to space; This study filters out variations in Earth’s energy budget due to feedback processes, revealing the energy changes caused by aerosols and greenhouse gas emissions. Related pages
Placing the Recent Hiatus Period in an Energy Balance Perspective
Feb. 24th, 2020
Read morepreview images GLOBAL OBSERVATIONS OF EARTH’S ENERGY BALANCE With the launch of NASA’s Terra Satellite Earth Observing System on Dec. 18, 1999, and subsequent ‘first light’ of the Cloud’s and the Earth’s Energy Radiant System (CERES) instrument on February 26, 2000, NASA gave birth to what ultimately would become the first long-term global observational record of Earth’s energy balance. This key indicator of the climate system describes the delicate and complex balance between how much of the sun’s energy reaching Earth is absorbed and how much thermal infrared radiation is emitted back to space. “Absorbed solar radiation fuels the climate system and life on our planet,” said Norman Loeb, CERES Principal Investigator. “The Earth sheds heat by emitting outgoing radiation.”For Earth’s temperature to be stable over long periods of time, absorbed solar and emitted thermal radiation must be equal. Increases in greenhouse gases, like carbon dioxide and methane, trap emitted thermal radiation from the surface and reduce how much is lost to space, resulting in a net surplus of energy into the Earth system. Most of the extra energy ends up being stored as heat in the ocean and the remainder warms the atmosphere and land, and melts snow and ice. As a consequence, global mean surface temperature increases and sea levels rise. Much like a pulse or heartbeat, CERES monitors reflected solar and emitted thermal infrared radiation, which together with solar irradiance measurements is one of Earth’s ‘vital signs’. Better understanding Earth’s energy balance enables us to be informed and adapt to a changing world. Though CERES on Terra marked the first global measurements of Earth’s energy balance, the CERES Pathfinder Mission on the Tropical Rainfall Measuring Mission (TRMM) began measuring the Earth’s radiant energy system in 1997. CERES is a key component of NASA’s Earth Observing System, with six active CERES instruments on satellites orbiting Earth and taking data. A GLOBAL WARMING ‘HIATUS’ A global warming hiatus is a period of relatively modest rise in global average surface temperature. During a hiatus, the jagged edges of surface temperature plots appear to level out or display less of an incline in a normally rising trend. This pause is not a part of the long-term trend of consistently increasing warmth. Climate models show that hiatuses are fairly common and can easily last 10 or more years. The most recent hiatus occurred during the first part of the 21st century and ended just prior to the 2015/2016 El Niño, when the global mean surface temperature showed a major increase. Launched during the early part of the hiatus period, the Terra mission has provided scientists with unprecedented observations of the hiatus, the 2015/2016 El Niño, and the current warming period.In contrast to global mean surface temperature, when we look at the Earth’s energy balance from CERES, we still see a continual steady rise in heat uptake, even during the hiatus. “The change in planetary heat uptake provides a better indication of how Earth’s climate is changing than surface temperature,” said Loeb.The ‘hiatus’ was a surface temperature phenomenon. FLUCTUATIONS EXPLAINED Over short time intervals, surface temperatures can be quite erratic. Natural fluctuations in atmospheric wind patterns and ocean currents result in vertical mixing in the oceans that can temporarily warm or cool the ocean surface and air immediately above the surface.During La Niña events, stronger easterly winds blowing across the tropical Pacific enhance vertical mixing in the ocean, bringing cooler water to the surface, a slowdown in surface warming, and an increase in ocean heat uptake at depths below 100 dbar (approximately 100 m). During El Niño conditions, easterly winds weaken, causing less vertical mixing in the ocean and warmer surface temperatures. The recent hiatus period was characterized predominantly by La Niña conditions, explaining the weaker rise in global mean surface temperature. Following the hiatus, El Niño conditions prevailed with substantial surface warming.Hiatus periods notwithstanding, the extra heat that is being added to the Earth system is driving the observed long-term increase in global mean surface temperature. Because the oceans take a long time to warm up, the oceans introduce a delay or lag in the warming, but the warming is eventually realized. This delay is sometimes referred to by scientists as the ‘warming commitment’ or ‘warming in the pipeline.’Scientists are constantly looking for ways to better monitor changes in Earth’s Energy Balance. Loeb is working with colleagues at the National Oceanic and Atmospheric Administration (NOAA) to combine continued satellite observations with Argo, a global array of 3,800 free-drifting profiling floats that measure the temperature and salinity of the upper 2,000 meters of the ocean. The CERES satellite data provide vital measurements of the energy entering and leaving Earth while the Argo data indicate where energy is stored in the ocean, both geographically and vertically.We rely on climate models to make projections of future climate so that we can make informed decisions about societal adaptation in a rapidly changing world. Climate modelers in turn rely on having quality long-term global measurements available to test and refine their models. Continuing the CERES record, which has enabled global measurements of Earth’s Energy Balance, is certainly a part of the plan. Related pages