NASA and Agriculture
Overview
NASA's fleet of satellites has been watching over Earth for more than half a century, collecting valuable data about the crops that make up our food supply and the water it takes to grow them. This wealth of information allows scientists to monitor farmland – tracking the overall food supply, where specific crops are grown, and how much water it takes to grow them with data from the Landsat satellites and others.
Visualizations
- ID: 4972 Visualization
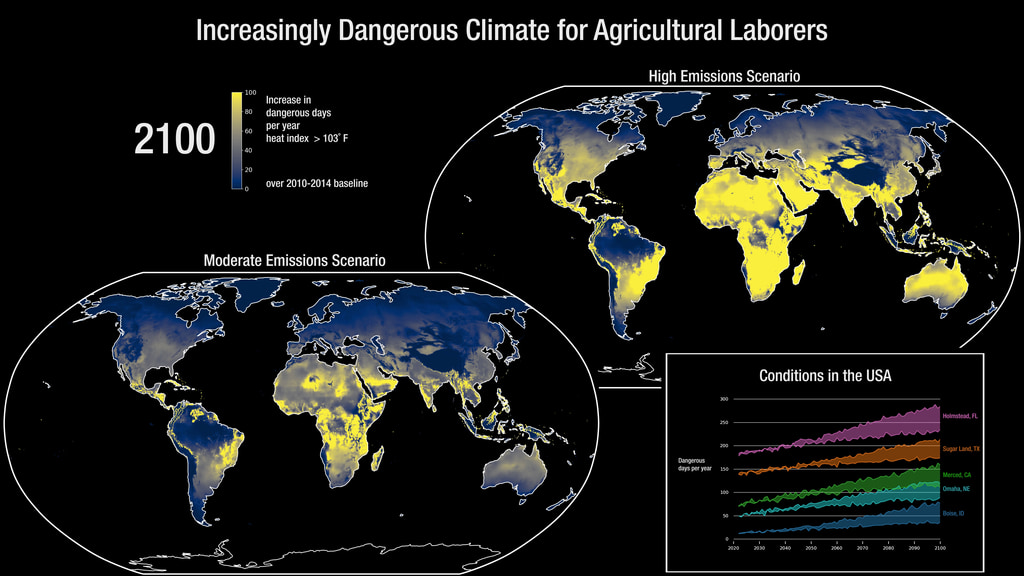
Increasingly Dangerous Climate for Agricultural Workers
Go to this pageA warming climate will create challenges for agricultural workers. This visualization shows the increased number of days per year that are expected to have a NOAA Heat Index greater than 103 degrees Fahrenheit based on two different climate scenarios (SSP2-4.5 and SSP5-8.5). The visualization also plots the number of days exceeding this threshold for five select locations in the United States. The map projection in Robinson and the color map is cividis. || AgWorkerClimateGraph_4k.00899_print.jpg (1024x576) [152.0 KB] || AgWorkerClimateGraph_4k.00899_searchweb.png (180x320) [57.1 KB] || AgWorkerClimateGraph_4k.00899_thm.png (80x40) [5.8 KB] || AgWorkerClimateGraph_HD.mp4 (1920x1080) [13.8 MB] || AgWorkerClimateGraph_HD.webm (1920x1080) [3.4 MB] || AgWorkerClimateGraph_4k.mp4 (3840x2160) [37.3 MB] || AgWorkerClimateGraph_HD.mp4.hwshow [189 bytes] ||
- ID: 4968 Visualization
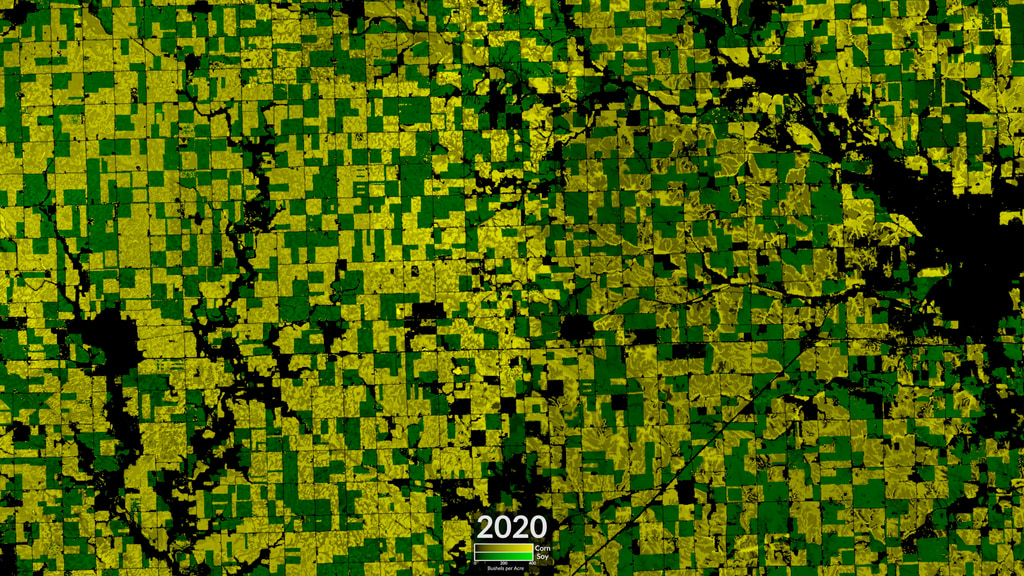
Iowa Cropland 2001-2020
Go to this pageModeled Iowa corn (yellow) and soybean (green) yields from 2001-2020. || IowaCrops_2022-02-17_1606.01240_print.jpg (1024x576) [479.4 KB] || IowaCrops_2022-02-17_1606.01240_searchweb.png (320x180) [124.0 KB] || IowaCrops_2022-02-17_1606.01240_web.png (320x180) [124.0 KB] || IowaCrops_2022-02-17_1606.01240_thm.png (80x40) [7.7 KB] || IowaCrops_2022-02-17_1606_1080p30.webm (1920x1080) [12.7 MB] || IowaCrops_2022-02-17_1606_1080p30.mp4 (1920x1080) [267.3 MB] || main (3840x2160) [0 Item(s)] || IowaCrops_2022-02-17_1606.mp4 (3840x2160) [491.4 MB] || IowaCrops_2022-02-17_1606_1080p30.mp4.hwshow [199 bytes] ||
- ID: 4974 Visualization
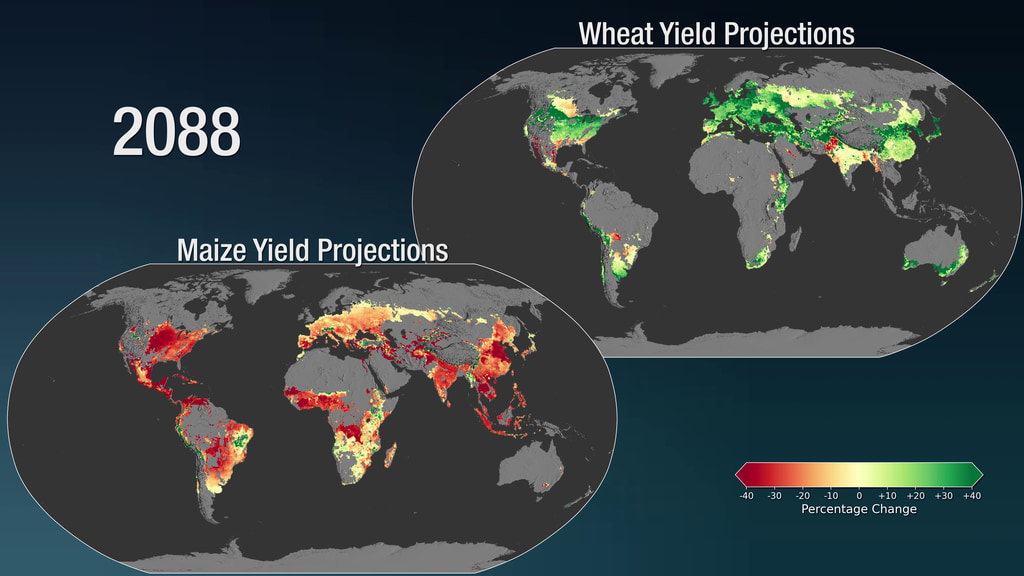
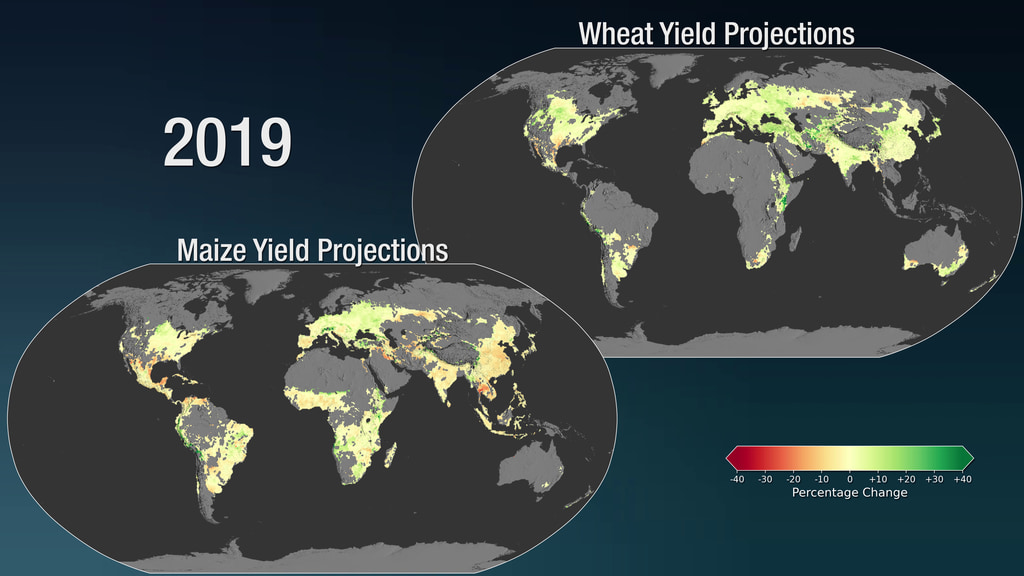
Impact of Climate Change on Global Agricultural Yields
Go to this pageData visualization of predicted wheat and maize yields through the end of this centaury based on an ensemble of crop and climate models. || AgMapMaize.00900_print.jpg (1024x576) [125.5 KB] || AgMapMaize.00900_searchweb.png (180x320) [54.2 KB] || AgMapMaize.00900_thm.png (80x40) [5.7 KB] || AgMapMaize.mp4 (3840x2160) [48.0 MB] || maize (3840x2160) [0 Item(s)] || AgMapMaize.webm (3840x2160) [5.7 MB] ||
- ID: 4925 Visualization
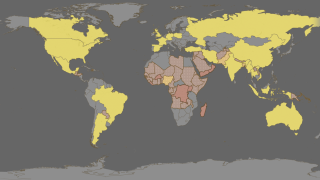
Impact of Climate Change on Global Maize Yields
Go to this pageData visualization of predicted maize yields through the end of this centaury based on an ensemble of crop and climate models. || MaizeMapFuture.01000_print.jpg (1024x576) [134.0 KB] || MaizeMapFuture.01000_searchweb.png (320x180) [55.5 KB] || MaizeMapFuture.01000_web.png (320x180) [55.5 KB] || MaizeMapFuture.01000_thm.png (80x40) [5.5 KB] || MaizeMapFuture_1080p.mp4 (1920x1080) [34.9 MB] || MaizeMapFuture_1080p.webm (1920x1080) [3.8 MB] || MaizeMapFuture.mp4 (3840x2160) [78.9 MB] ||
- ID: 4914 Visualization
Impact of Climate Change on Global Wheat Yields
Go to this pageData visualization of predicted Wheat yields through the end of this centaury based on an ensemble of crop and climate models. || WheatMapFuture.01000_print.jpg (1024x576) [123.1 KB] || WheatMapFuture.01000_searchweb.png (320x180) [54.6 KB] || WheatMapFuture.01000_web.png (320x180) [54.6 KB] || WheatMapFuture.01000_thm.png (80x40) [5.4 KB] || WheatMapFuture_1080p.mp4 (1920x1080) [21.7 MB] || WheatMapFuture.mp4 (3840x2160) [79.7 MB] || WheatMapFuture.webm (3840x2160) [6.4 MB] ||
- ID: 4915 Visualization
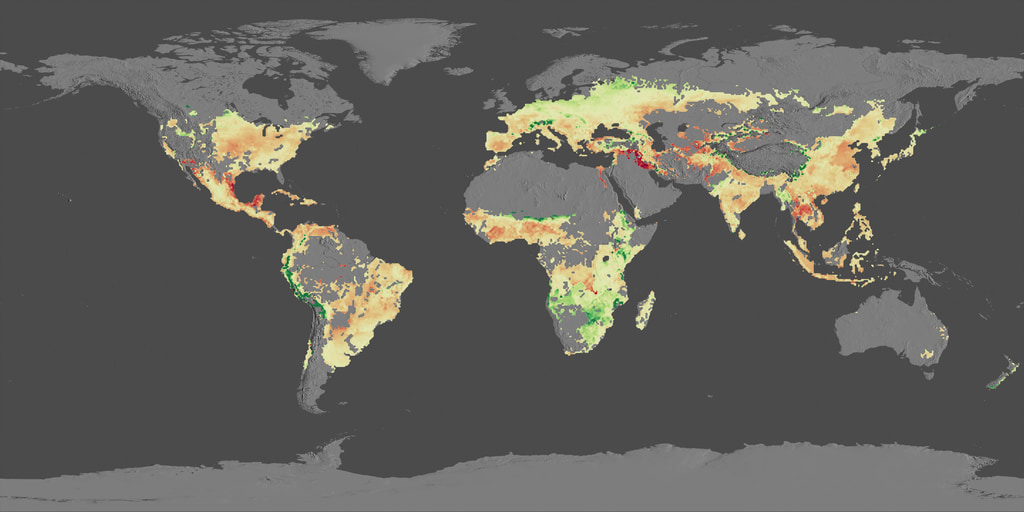
A Global view of Normalized Difference Vegetation Index (NDVI) Anomaly in crop-growing regions from 2000 to 2021
Go to this pageThis visualization shows the NDVI anomaly from the year 2000 to 2021 in areas where maize, rice, soybeans, spring wheat or winter wheat are grown. Green colors indicate more than average vegetatation while orange colors indicate less productive areas.Coming soon to our YouTube channel. || NDVI_anomaly_2000-2021.11770.png (1920x1080) [897.2 KB] || NDVI_anomaly_2000-2021.11770_print.jpg (1024x576) [79.6 KB] || NDVI_anomaly_2000-2021.11770_searchweb.png (320x180) [39.8 KB] || NDVI_anomaly_2000-2021.11770_thm.png (80x40) [4.5 KB] || 1920x1080_16x9_30p (1920x1080) [0 Item(s)] || NDVI_anomaly_2000-2021_1080p30.webm (1920x1080) [60.4 MB] || NDVI_anomaly_2000-2021_1080p30.mp4 (1920x1080) [146.7 MB] || 3840x2160_16x9_30p (3840x2160) [0 Item(s)] || captions_silent.31356.en_US.srt [43 bytes] || NDVI_Anomaly_2000_2021_4k_2160p30.mp4 (3840x2160) [608.3 MB] || NDVI_anomaly_2000-2021_1080p30.mp4.hwshow [196 bytes] ||
- ID: 4916 Visualization
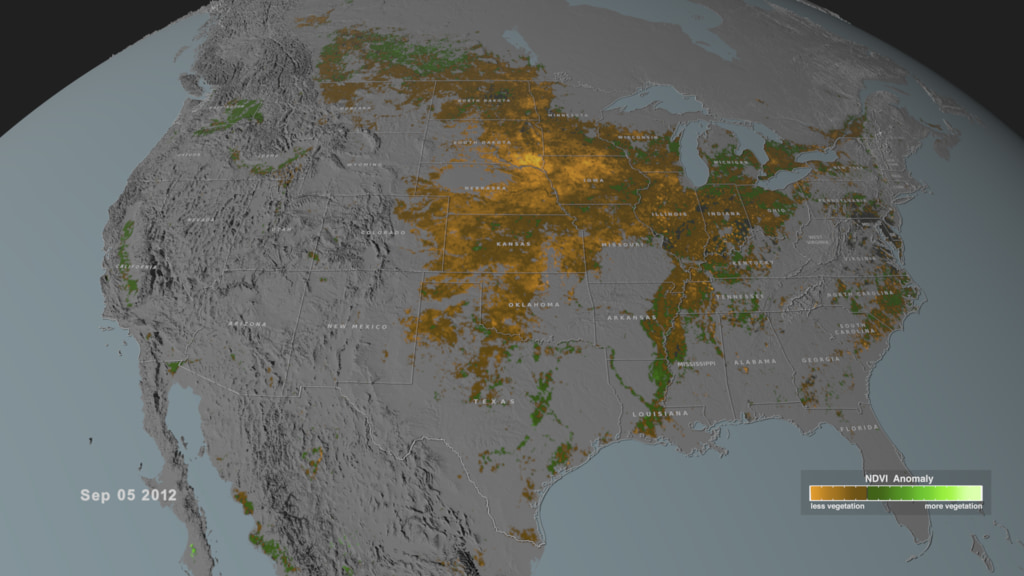
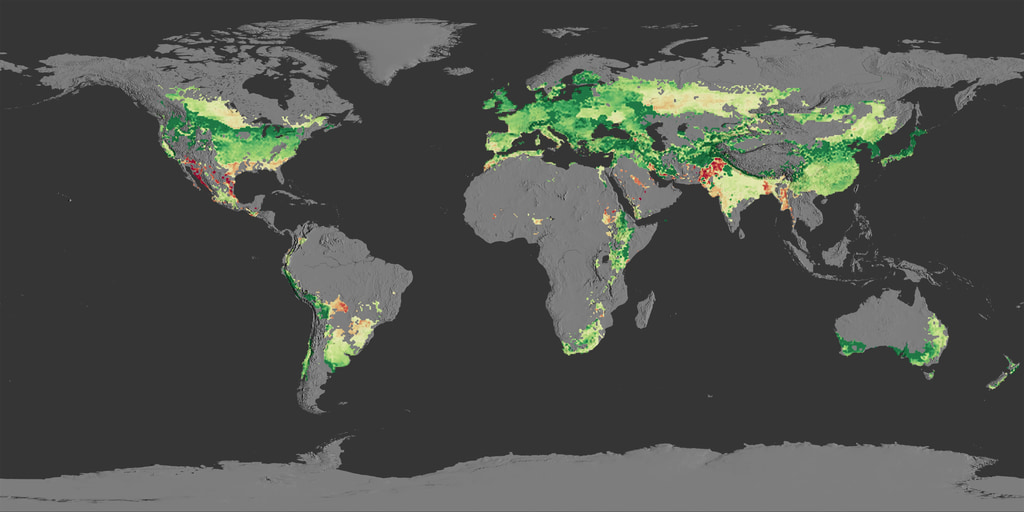
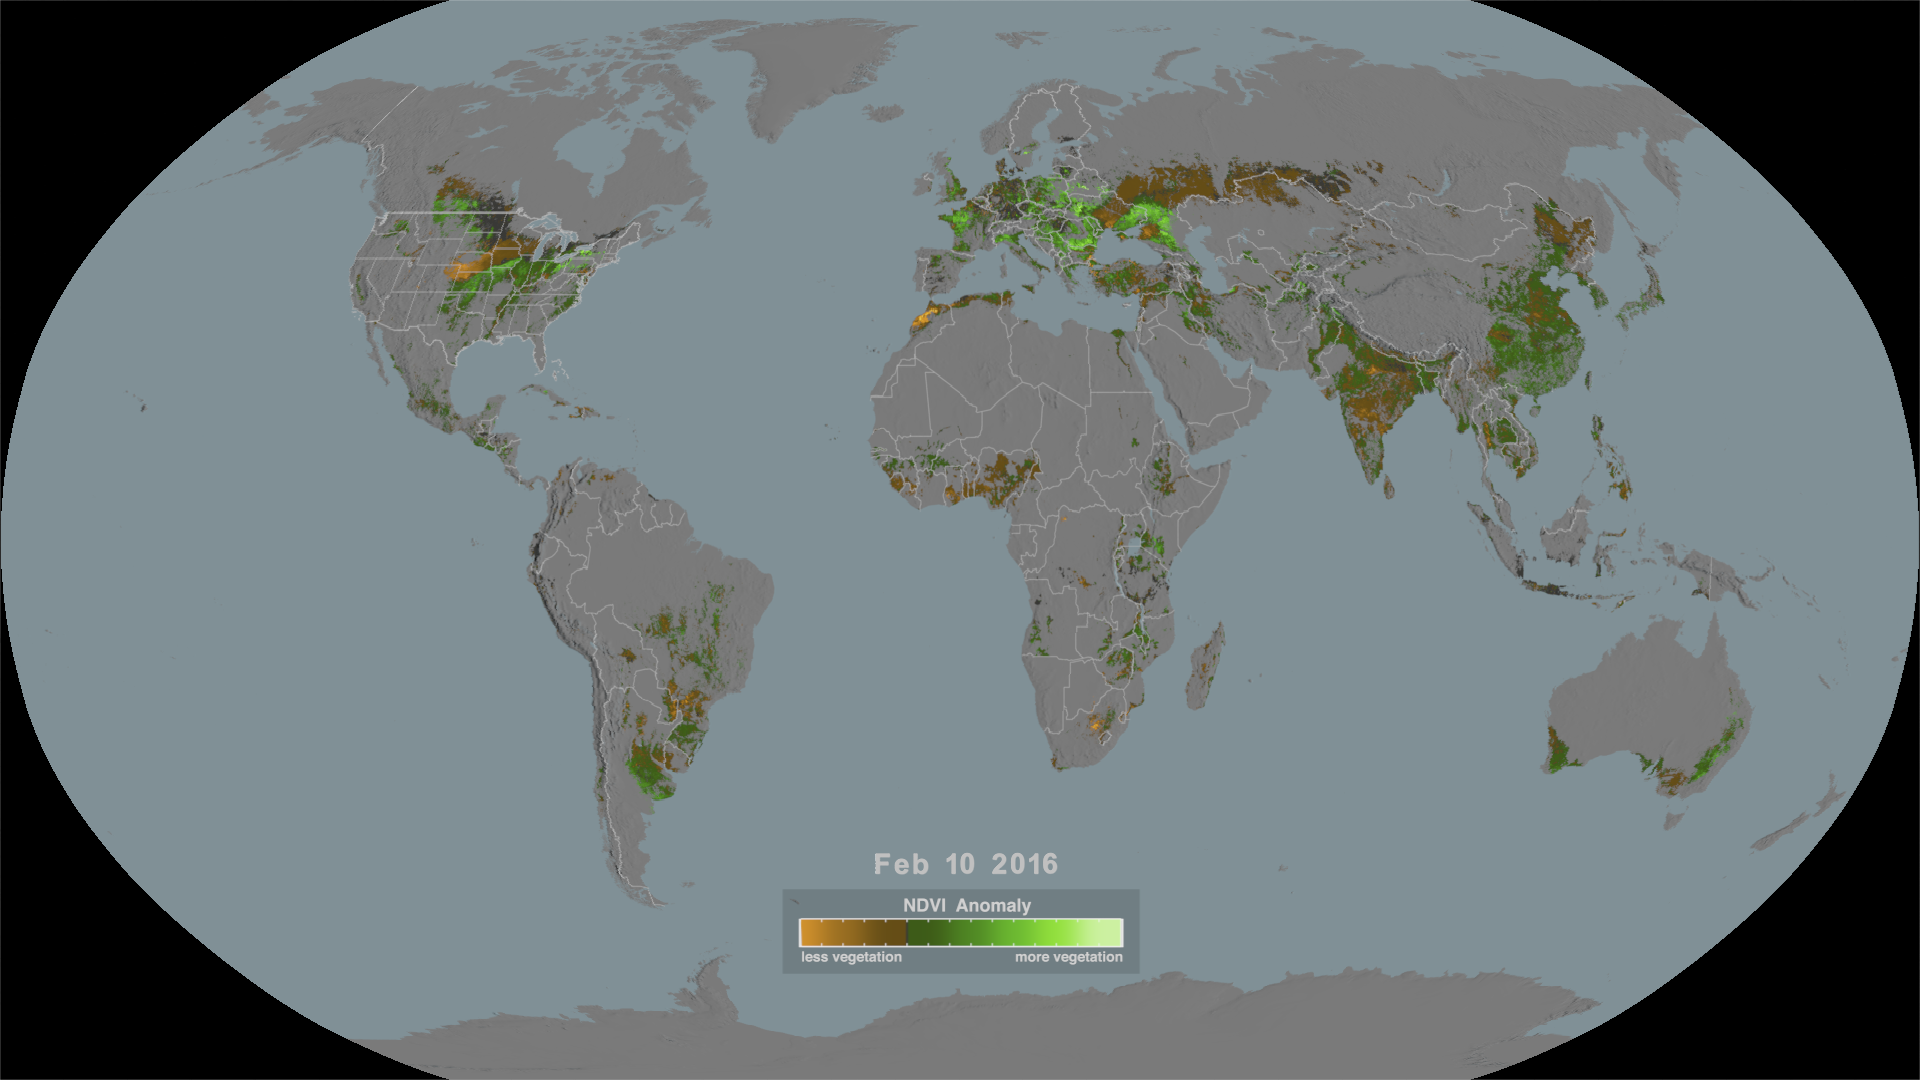
Normalized Difference Vegetation Index (NDVI) Anomaly in crop-growing regions for selected years
Go to this pageThis visualization shows the NDVI anomaly in areas where maize, rice, soybeans, spring wheat or winter wheat are grown over the United States, Australia, Russia, Europe and southern Africa during certain years. Green colors indicate more than average vegetatation while orange colors indicate less productive areas.Coming soon to our YouTube channel. || NDVI_anomaly_regions.1020_print.jpg (1024x576) [140.2 KB] || NDVI_anomaly_regions.1020_searchweb.png (320x180) [72.6 KB] || NDVI_anomaly_regions.1020_thm.png (80x40) [5.9 KB] || 1920x1080_16x9_30p (1920x1080) [0 Item(s)] || NDVI_anomaly_regions_1080p30.mp4 (1920x1080) [110.9 MB] || captions_silent.31363.en_US.srt [43 bytes] || NDVI_anomaly_regions_1080p30.mp4.hwshow [194 bytes] ||
- ID: 4523 Visualization
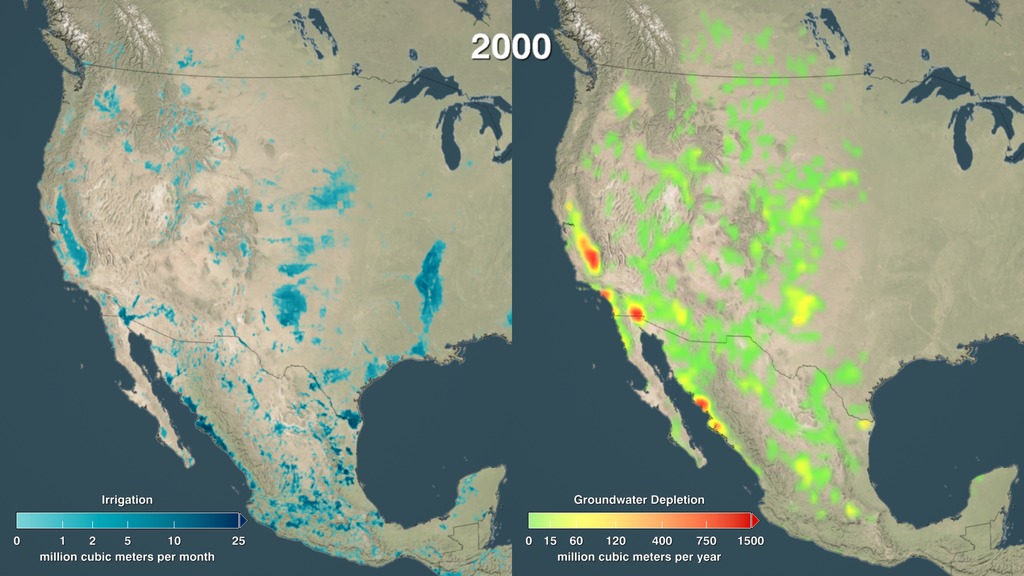
Irrigation and Groundwater Depletion
Go to this pageA time series of global irrigation and groundwater depletion maps reveals geographical patterns in the use of fresh water for agriculture.The amount of water involved is enormous. Worldwide, the irrigation of farmland accounts for about 70% of the fresh water diverted by human activity. We might each drink only a few liters (quarts) of water per day, but the food we eat can require a thousand times as much water to produce. Some of the underground aquifers tapped for irrigation replenish so slowly that they are considered a non-renewable resource. The overuse of this groundwater could have long-term consequences for food security and the stability of global markets in food, cotton, and other agricultural products.A new study by researchers at University College London and NASA's Goddard Institute of Space Studies in New York City combines trade data and a global water usage model to determine which crops are grown with non-renewable groundwater and where those crops are consumed. The study appears in the March 30, 2017 issue of Nature. ||
- Section
Agriculture Yield Projections
Go to this sectionNASA has the world’s largest Earth observing fleet and has an uninterrupted record and observed evidence of climate change. Increased greenhouse gases trap heat in the Earth’s atmosphere.
Trapped atmospheric greenhouse gases warm the planet – our land, ocean, and atmosphere. Most of the global warming goes into the ocean, delaying the full impact of global warming. Ocean currents move the heat around the globe, impacting your local weather and climate. Warmer oceans accelerate melting of ice sheets in Greenland and Antarctica. Rising seas are a major consequence of climate change, impacting coastal communities, infrastructure, and economy. Warmer climate amplifies Earth’s water cycle. Dry areas are getting drier and wet areas are getting wetter. Wet areas are experiencing more flooding and extreme storms, such as typhoons and hurricanes. Drought prone areas will see less rainfall, effecting agriculture. NASA data are used for projections that can help inform actions for the future. More extreme conditions are occurring due to climate change, such as wildfires. NASA data and knowledge are open and free, enabling informed decision-making. NASA information aids preparation and recovery from natural hazards around the world
Produced Pieces
- ID: 13979 Produced Video
![Music: Futurity by Lee Groves [PRS] and Peter George Marett [PRS]Complete transcript available.](/vis/a010000/a013900/a013979/Screen_Shot_2021-10-28_at_2.29.18_PM.png)
Climate Change Could Affect Global Agriculture within 10 Years
Go to this pageAverage global crop yields for maize, or corn, may see a decrease of 24% by late century, with the declines becoming apparent by 2030, with high greenhouse gas emissions, according to a new NASA study. Wheat, in contrast, may see an uptick in crop yields by about 17%. The change in yields is due to the projected increases in temperature, shifts in rainfall patterns and elevated surface carbon dioxide concentrations due to human-caused greenhouse gas emissions, making it more difficult to grow maize in the tropics and expanding wheat’s growing range. ||
- ID: 13910 Produced Video

Snack Time with NASA
Go to this pageSnack Time with NASA digs into the science behind what’s on your plate from a tasty cheese board, to seafood, to fresh produce, to chips and dip.Food can bring us a sense of home, and it connects people all around the world. With observations from space and aircraft, combined with high-end computer modeling, NASA scientists work together with partner agencies, organizations, farmers, ranchers, fishermen, and decision makers to understand the relationship between the Earth system and the environments that provide us food. ||
- ID: 13894 Produced Video
![Music: Building Ideas [Instrumental] by Todd James Carlin BakerComplete transcript available.](/vis/a010000/a013800/a013894/GLAM_thumbnail.png)
Keeping Track of Food Production From Space
Go to this pageMusic: Building Ideas [Instrumental] by Todd James Carlin BakerComplete transcript available. || GLAM_thumbnail.png (1280x720) [796.0 KB] || GLAM_thumbnail_print.jpg (1024x576) [133.6 KB] || GLAM_thumbnail_searchweb.png (320x180) [57.4 KB] || GLAM_thumbnail_thm.png (80x40) [5.1 KB] || GLAM_FINAL.mov (1280x720) [887.4 MB] || GLAM_FINAL.mp4 (1280x720) [122.3 MB] || GLAM_FINAL.webm (1280x720) [13.1 MB] || GLAM_Captions.en_US.srt [2.3 KB] || GLAM_Captions.en_US.vtt [2.3 KB] ||
- ID: 13592 Produced Video
![Complete transcript available.Music credits: “Billy” by Rob Jager [BUMA]; “Perfect Space” by Anthony Edwin Phillips [PRS], Samuel Karl Bohn [PRS]; “Games Show Spheres 07” by Anselm Kreuzer [GEMA]; “Hope Will Save Us” by Christopher John Hutchings [PRS]
Additional imagery credit: University of Washington Watch this video on the NASA Goddard YouTube channel.](/vis/a010000/a013500/a013592/13592_FarmersGPM_YouTube.00001_print.jpg)
Guiding Farmers with NASA Satellites
Go to this pageAgriculture in Pakistan is dependent on irrigation from the Indus River, but over the years, these freshwater resources have become scarce. Today, it is one of the world’s most depleted basins. To tackle this, farmers are attempting to predict and track freshwater resources with the help of NASA satellites and cell phones. ||
- ID: 13543 Produced Video
![Landsat satellites have been gathering data for 48 years, equipping scientists and farmers to answer big questions about how to improve agriculture around the world. From tracking crop production, assessing crop health, and monitoring water use, Landsat data provides tangible benefits to the USA and the world. Landsat satellites are built and lauched by NASA, and operated by USGS. Complete transcript available.Music: "Lines of Enquiry" by Theo Golding [PRS], published by Atmosphere Music [PRS]Watch this video on the NASA Goddard YouTube channel.](/vis/a010000/a013500/a013543/LandsatAg-Thumbnail.png)
Landsat: Farming Data From Space
Go to this pageLandsat satellites have been gathering data for 48 years, equipping scientists and farmers to answer big questions about how to improve agriculture around the world. From tracking crop production, assessing crop health, and monitoring water use, Landsat data provides tangible benefits to the USA and the world. Landsat satellites are built and lauched by NASA, and operated by USGS. Complete transcript available.Music: "Lines of Enquiry" by Theo Golding [PRS], published by Atmosphere Music [PRS]Watch this video on the NASA Goddard YouTube channel. || LandsatAg-Thumbnail.png (1920x1080) [4.0 MB] || LandsatAg-Thumbnail_print.jpg (1024x576) [166.3 KB] || LandsatAg-Thumbnail_searchweb.png (320x180) [109.3 KB] || LandsatAg-Thumbnail_thm.png (80x40) [6.6 KB] || LandsatAg-FINAL.mov (1920x1080) [3.2 GB] || LandsatAg-FINAL_youtube_1080.mp4 (1920x1080) [148.1 MB] || LandsatAg-FINAL_facebook_720.mp4 (1280x720) [110.9 MB] || LandsatAg-FINAL_twitter_720.mp4 (1280x720) [20.1 MB] || LandsatAg-FINAL.webm (960x540) [39.3 MB] || LandsatAg-FINAL-captions.en_US.srt [1.8 KB] || LandsatAg-FINAL-captions.en_US.vtt [1.8 KB] ||
- ID: 13254 Produced Video
Connect the Drops with NASA Data
Go to this pageComplete transcript available.Wathc this video on the NASA Goddard YouTube channel. || Modeling_freshwater_updated_Final.00010_print.jpg (1024x576) [153.0 KB] || Modeling_freshwater_updated_Final.00010_searchweb.png (320x180) [114.2 KB] || Modeling_freshwater_updated_Final.00010_web.png (320x180) [114.2 KB] || Modeling_freshwater_updated_Final.00010_thm.png (80x40) [7.6 KB] || Modeling_freshwater_updated_Final.mov (1920x1280) [7.9 GB] || Modeling_freshwater_updated_Final.mp4 (1920x1080) [371.0 MB] || Modeling_freshwater_updated_Final.webm (1920x1280) [45.5 MB] || Modeling_freshwater_updated_Final.en_US.srt [4.6 KB] || Modeling_freshwater_updated_Final.en_US.vtt [4.6 KB] ||
- ID: 13417 Produced Video
![The U.S. Department of Agriculture tracks how many acres and the annual yield for every crop produced. One method used to estimate crop acreage and yield is remote-sensing data from the NASA-USGS Landsat satellite program. The program started in 1997,with North Dakota, and by 2008 covered the entire lower 48 states and the District of Columbia. Music: "Downloading Landscapes" by Andrew Michael Britton [PRS] and David Stephen Goldsmith [PRS]. Published by Atmosphere Music Ltd [PRS].Complete transcript available.Watch this video on the NASA Goddard YouTube channel.](/vis/a010000/a013400/a013417/13417_Landsat_Croplands_print.jpg)
Landsat Croplands Data Overview
Go to this pageThe U.S. Department of Agriculture tracks how many acres and the annual yield for every crop produced. One method used to estimate crop acreage and yield is remote-sensing data from the NASA-USGS Landsat satellite program. The program started in 1997,with North Dakota, and by 2008 covered the entire lower 48 states and the District of Columbia. Music: "Downloading Landscapes" by Andrew Michael Britton [PRS] and David Stephen Goldsmith [PRS]. Published by Atmosphere Music Ltd [PRS].Complete transcript available.Watch this video on the NASA Goddard YouTube channel. || 13417_Landsat_Croplands_print.jpg (1920x1080) [940.0 KB] || 13417_Landsat_Croplands_print_searchweb.png (180x320) [52.1 KB] || 13417_Landsat_Croplands_print_thm.png (80x40) [4.6 KB] || 13417_Landsat_Croplands.webm (1920x1080) [19.7 MB] || 13417_Landsat_Croplands.mp4 (1920x1080) [292.2 MB] || 13417_Landsat_Croplands-captions.en_US.srt [3.0 KB] || 13417_Landsat_Croplands-captions.en_US.vtt [3.0 KB] || 13417_Landsat_Croplands.mov (1920x1080) [4.8 GB] || 13417_Landsat_Croplands.mp4.hwshow [423 bytes] ||
Older Visuals
- ID: 40027 Gallery