ICON
Overview
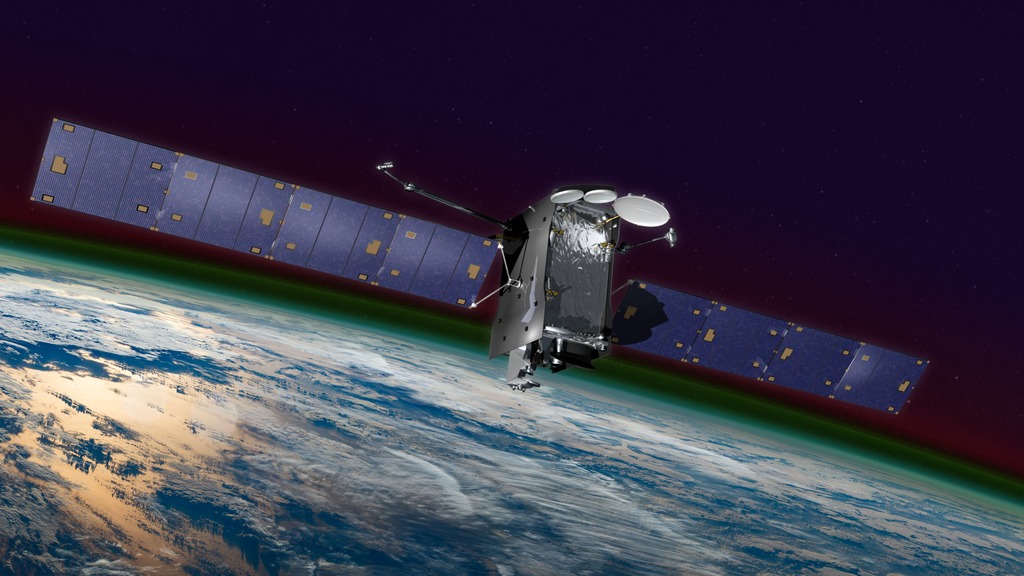
The Ionospheric Connection Explorer, or ICON, is a low-Earth orbiting satellite that will give us new information about how Earth’s atmosphere interacts with near-Earth space — a give-and-take that plays a major role in the safety of our satellites and reliability of communications signals.
Specifically, ICON investigates the connections between the neutral atmosphere — which extends from near Earth’s surface to far above us, at the edge of space— and the electrically charged part of the atmosphere, called the ionosphere. The particles of the ionosphere carry electrical charge that can disrupt communications signals, cause satellites in low-Earth orbit to become electrically charged, and, in extreme cases, cause power outages on the ground.
The Mission
- ID: 20265 Animation
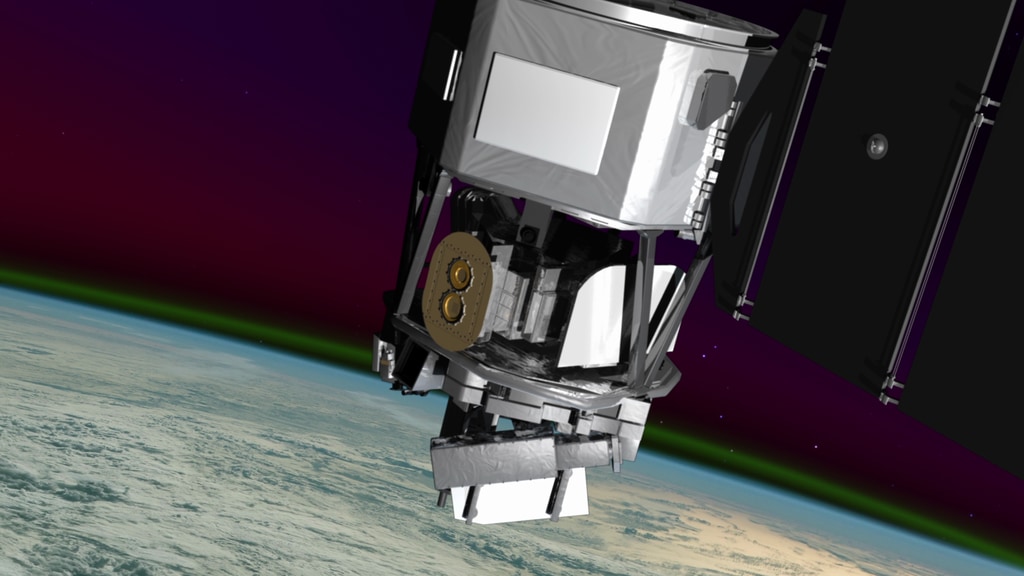
ICON Beauty Pass
Go to this pageBeauty pass showing ICON observing the ionosphere. Credit: NASA/GSFC/CIL || AirGlow_final_ProRes.00001_print.jpg (1024x576) [87.7 KB] || AirGlow_final_ProRes.00001_web.png (320x180) [74.1 KB] || AirGlow_final_ProRes.00001_searchweb.png (180x320) [74.1 KB] || AirGlow_final_ProRes.00001_thm.png (80x40) [6.0 KB] || AirGlow_final_H264.mov (1920x1080) [19.5 MB] || 1920x1080_16x9_60p (1920x1080) [0 Item(s)] || AirGlow_final_ProRes.webm (1920x1080) [1.0 MB] || AirGlow_final_ProRes.mov (1920x1080) [304.3 MB] ||
- ID: 12699 Produced Video

Meet ICON: NASA’s Airglow Explorer
Go to this pageMusic credit: Design Principle by Wayne RobertsComplete transcript available. || iss_composite_test_182.jpg (4256x2832) [12.8 MB] || iss_composite_test_182_searchweb.png (320x180) [99.0 KB] || iss_composite_test_182_thm.png (80x40) [6.2 KB] || LARGE_MP4-12699_ICON_Overview_V2__large.mp4 (1920x1080) [148.3 MB] || NASA_TV-12699_ICON_Overview_V2_.mpeg (1280x720) [494.2 MB] || APPLE_TV-12699_ICON_Overview_V2__appletv.m4v (1280x720) [75.3 MB] || YOUTUBE_1080-12699_ICON_Overview_V2__youtube_1080.mp4 (1920x1080) [234.8 MB] || PRORES_B-ROLL-12699_ICON_Overview_V2__prores.mov (1280x720) [1.9 GB] || YOUTUBE_HQ-12699_ICON_Overview_V2__youtube_hq.mov (1920x1080) [539.3 MB] || 12699_ICON_Overview_V2_.mov (1920x1080) [3.7 GB] || LARGE_MP4-12699_ICON_Overview_V2__large.webm (1920x1080) [16.3 MB] || APPLE_TV-12699_ICON_Overview_V2__appletv_subtitles.m4v (1280x720) [75.3 MB] || 12699_ICON_Overview_V2.en_US.srt [2.4 KB] || 12699_ICON_Overview_V2.en_US.vtt [2.5 KB] || NASA_PODCAST-12699_ICON_Overview_V2__ipod_sm.mp4 (320x240) [25.4 MB] || 12699_ICON_Overview_V2__lowres.mp4 (480x272) [20.3 MB] ||
- ID: 4594 Visualization
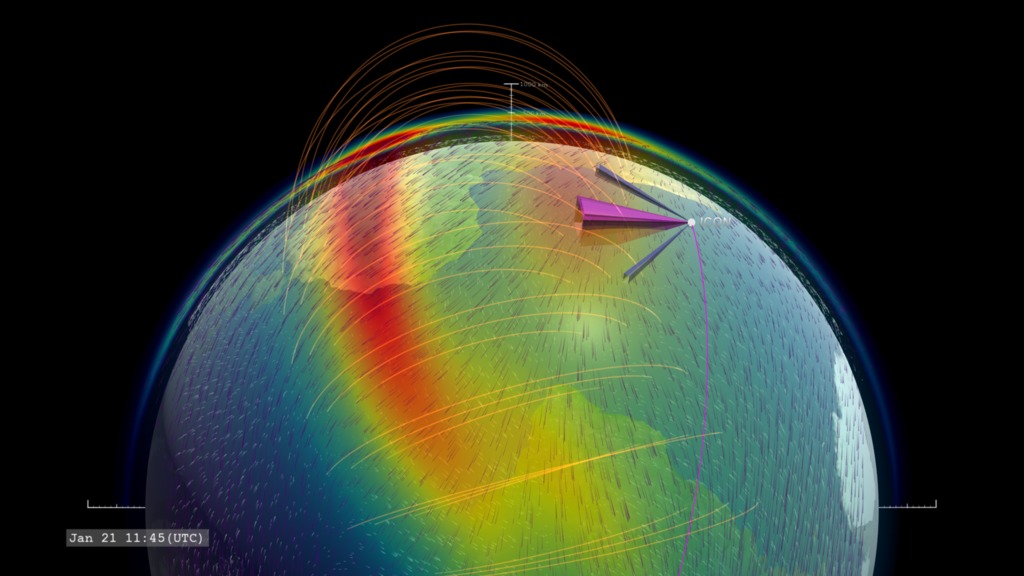
ICON Scans the Ionosphere
Go to this pageICON orbits Earth at 575 kilometers altitude, measuring the composition and motions of the ionosphere. || IRIDaily.limbwICON_OionHwindIGRF.clockSlate_CRTT.HD1080i.000870_print.jpg (1024x576) [105.7 KB] || IRIDaily.limbwICON_OionHwindIGRF.clockSlate_CRTT.HD1080i.000870_searchweb.png (320x180) [63.8 KB] || IRIDaily.limbwICON_OionHwindIGRF.clockSlate_CRTT.HD1080i.000870_thm.png (80x40) [5.0 KB] || 1920x1080_16x9_30p (1920x1080) [0 Item(s)] || IRIDaily.limbwICON_OionHwindIGRF.HD1080i_p30.mp4 (1920x1080) [76.4 MB] || IRIDaily.limbwICON_OionHwindIGRF.HD1080i_p30.webm (1920x1080) [10.9 MB] || 3840x2160_16x9_30p (3840x2160) [0 Item(s)] || IRIDaily.limbwICON_OionHwindIGRF.UHD3840_2160p30.mp4 (3840x2160) [217.4 MB] || IRIDaily.limbwICON_OionHwindIGRF.HD1080i_p30.mp4.hwshow [210 bytes] ||
- ID: 12971 Produced Video
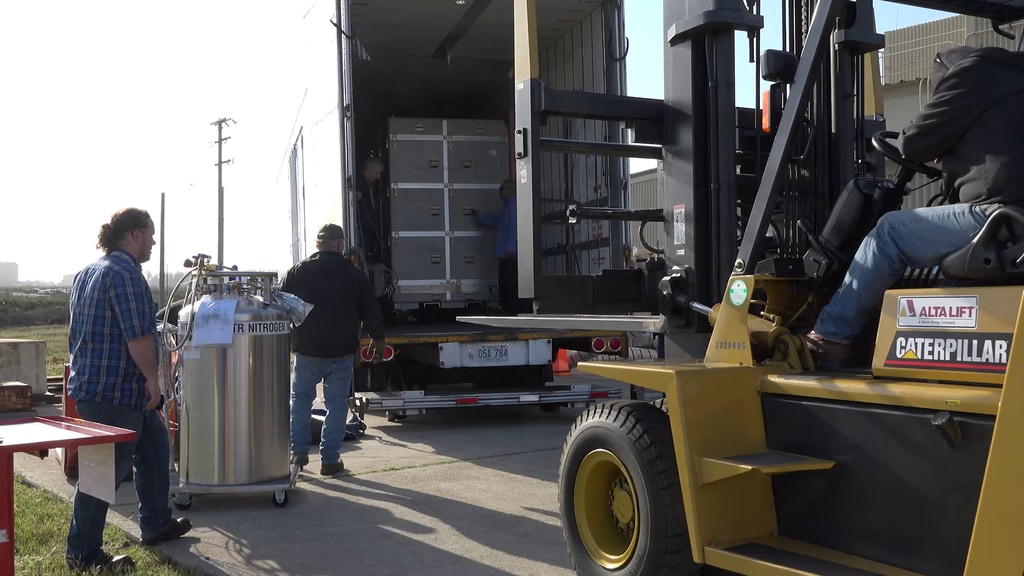
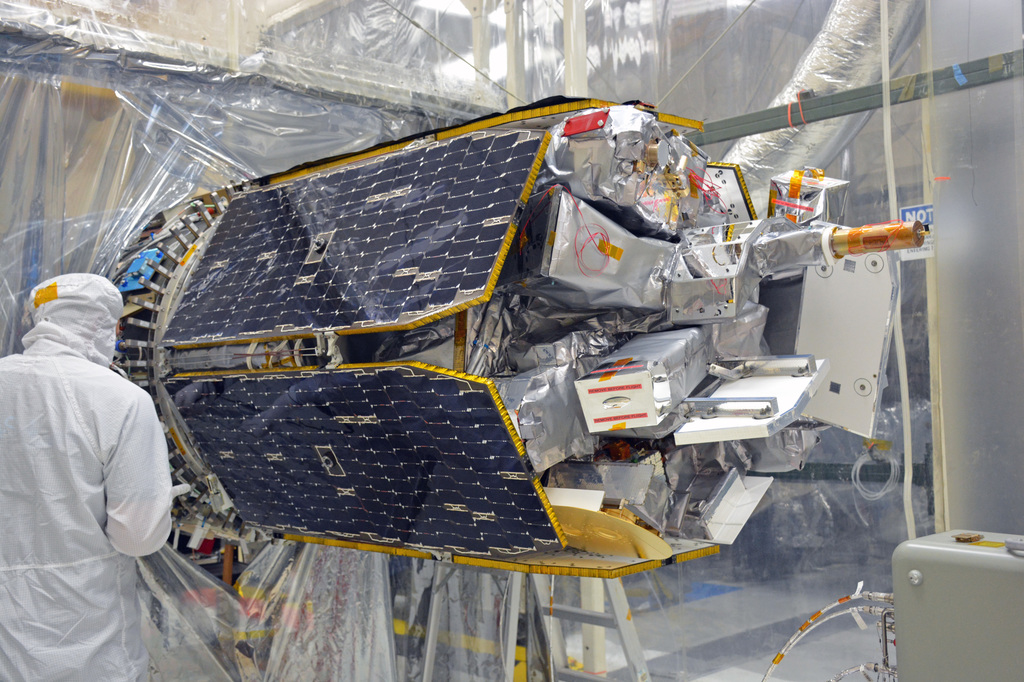
Unboxing a New NASA Spacecraft
Go to this pageGo behind the scenes as we unbox NASA’s Ionospheric Connection Explorer, or ICON, after its arrival at Vandenberg Air Force Base in California. Northrop Grumman engineer Steve Turek and NASA EDGE’s Chris Giersch walk us through the whole process of unboxing a spacecraft – from the instrument that records every tiny bump on its journey to the special crane used to lift the spacecraft to its new home.ICON launches in fall 2018 from NASA's Kennedy Space Center in Florida to study Earth’s interface to space. Read more about the ICON mission: nasa.gov/icon ||
- ID: 13106 Produced Video
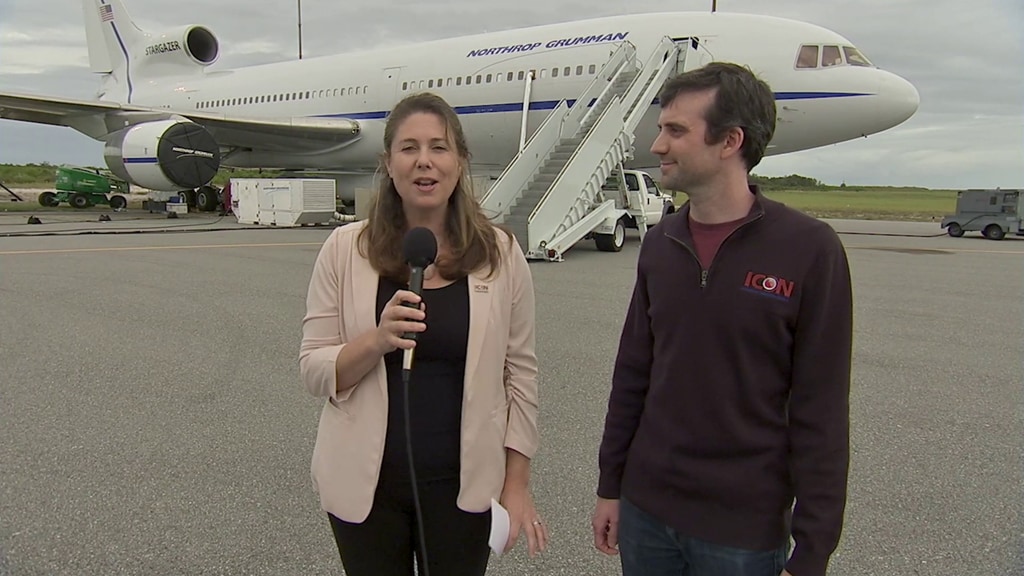
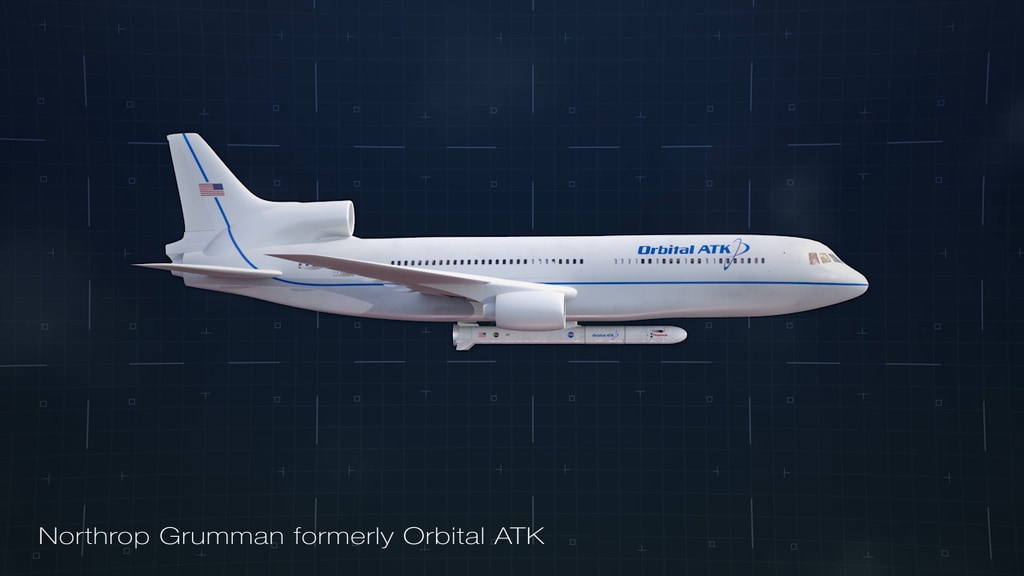
Tour the Plane Giving NASA’s ICON a Ride to Space
Go to this pageEarly in the morning of Nov. 7, 2018, NASA launches the Ionospheric Connection Explorer, or ICON, a spacecraft that will explore the dynamic region where Earth meets space. ICON launches on a Northrop Grumman Pegasus XL rocket, which is carried aloft by the Stargazer L-1011 aircraft.Join NASA on a behind-the-scenes tour of this plane, once a jet airliner and now uniquely retrofitted to boost spacecraft into low-Earth orbit. Learn about ICON’s science and meet the people — including an engineer, technician, and pilot — who will help launch the spacecraft into orbit.Learn more at: nasa.gov/icon ||
The Ionosphere
- ID: 12532 Produced Video
Welcome to the Ionosphere
Go to this pageMusic credit: Foxy Trot by Luis Enriquez Bacalov Complete transcript available.Watch this video on the NASA Goddard YouTube channel. || ionosphere_thumb.jpg (1920x1080) [69.9 KB] || ionosphere_thumb_searchweb.png (320x180) [57.3 KB] || ionosphere_thumb_thm.png (80x40) [6.3 KB] || APPLE_TV-12532_Welcome_to_the_ionosphere_bsideV4_appletv.webm (1280x720) [24.0 MB] || APPLE_TV-12532_Welcome_to_the_ionosphere_bsideV4_appletv.m4v (1280x720) [116.4 MB] || APPLE_TV-12532_Welcome_to_the_ionosphere_bsideV4_appletv_subtitles.m4v (1280x720) [116.5 MB] || YOUTUBE_1080-12532_Welcome_to_the_ionosphere_bsideV4_youtube_1080.mp4 (1920x1080) [346.2 MB] || NASA_TV-12532_Welcome_to_the_ionosphere_bsideV4.mpeg (1280x720) [691.7 MB] || 12532_Welcome_to_the_ionosphere_bsideV2_lowres.en_US.srt [3.8 KB] || 12532_Welcome_to_the_ionosphere_bsideV2_lowres.en_US.vtt [3.8 KB] || 12532_Welcome_to_the_ionosphere_bsideV4_lowres.mp4 (480x272) [29.2 MB] || LARGE_MP4-12532_Welcome_to_the_ionosphere_bsideV4_large.mp4 (3840x2160) [220.8 MB] || NASA_PODCAST-12532_Welcome_to_the_ionosphere_bsideV4_ipod_sm.mp4 (320x240) [37.3 MB] || 12532_Welcome_to_the_ionosphere_bsideV4.mov (3840x2160) [10.1 GB] ||
- ID: 12902 Produced Video
![Music: "Nature Daydream" by Laurent Dury [SACEM], "Grape Picking" by Laurent Dury [SACEM] from Killer TracksComplete transcript available.Watch this video on the NASA Goddard YouTube channel.](/vis/a010000/a012900/a012902/12902_Airglow_VX-919658_large.00320_print.jpg)
The Secrets behind Earth’s Multi-colored Glow
Go to this pageWhat does our planet look like from space? Most are familiar with the beloved images of the blue marble or pale blue dot — Earth from 18,000 and 3.7 billion miles away, respectively. But closer to home, within the nearest region of space, you might encounter an unfamiliar sight. If you peer down on Earth from just 300 miles above the surface, near the orbit of the International Space Station, you can see vibrant swaths of red and green or purple and yellow light emanating from the upper atmosphere. This is airglow. Airglow occurs when atoms and molecules in the upper atmosphere, excited by sunlight, emit light in order to shed their excess energy. Or, it can happen when atoms and molecules that have been ionized by sunlight collide with and capture a free electron. In both cases, they eject a particle of light — called a photon — in order to relax again. The phenomenon is similar to auroras, but where auroras are driven by high-energy particles originating from the solar wind, airglow is energized by day-to-day solar radiation. ||
- ID: 4540 Visualization
Exploring Earth's Ionosphere: Limb view
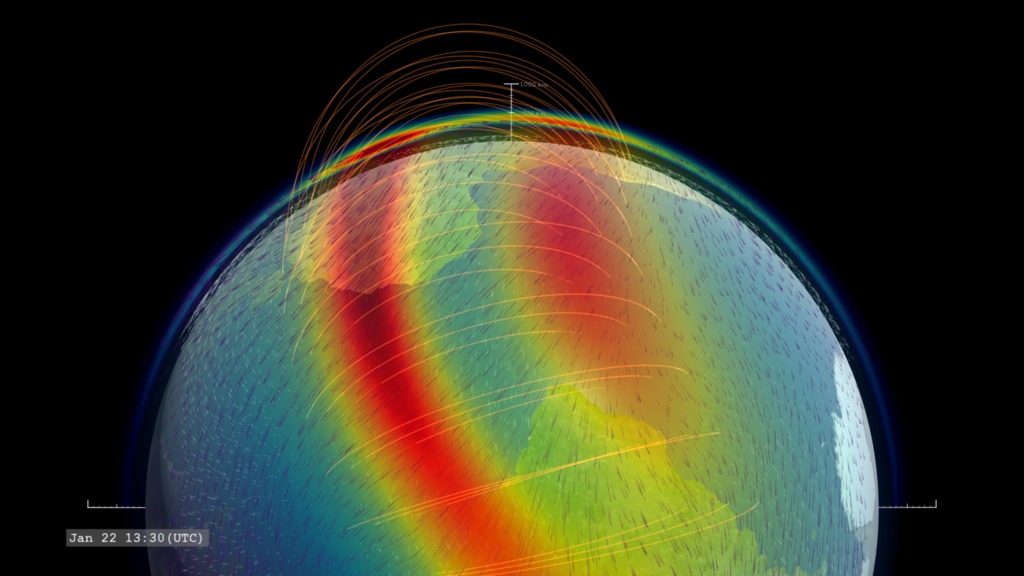
Go to this pageThis visualization presents data on the concentration of the singly-ionized oxygen atom (rainbow color table, red is highest concentration), the low-latitude geomagnetic field (gold field lines) and the ionospheric winds at two altitude levels, 100km (white) and 350 km (violet). || IRIDaily.limb_OionHwindIGRF.clockSlate_CRTT.HD1080i.000750_print.jpg (1024x576) [101.4 KB] || IRIDaily.limb_OionHwindIGRF.clockSlate_CRTT.HD1080i.000750_thm.png (80x40) [5.0 KB] || IRIDaily.limb_OionHwindIGRF.clockSlate_CRTT.HD1080i.000750_searchweb.png (320x180) [62.5 KB] || IRIDaily.limb_OionHwindIGRF.HD1080i_p30.mp4 (1920x1080) [88.3 MB] || OionHwindIGRF (1920x1080) [0 Item(s)] || OionHwindIGRF (3840x2160) [0 Item(s)] || IRIDaily.limb_OionHwindIGRF.2160p30.webm (3840x2160) [12.4 MB] || IRIDaily.limb_OionHwindIGRF.2160p30.mp4 (3840x2160) [274.0 MB] || IRIDaily.limb_OionHwindIGRF.HD1080i_p30.mp4.hwshow [205 bytes] ||
- ID: 4504 Visualization

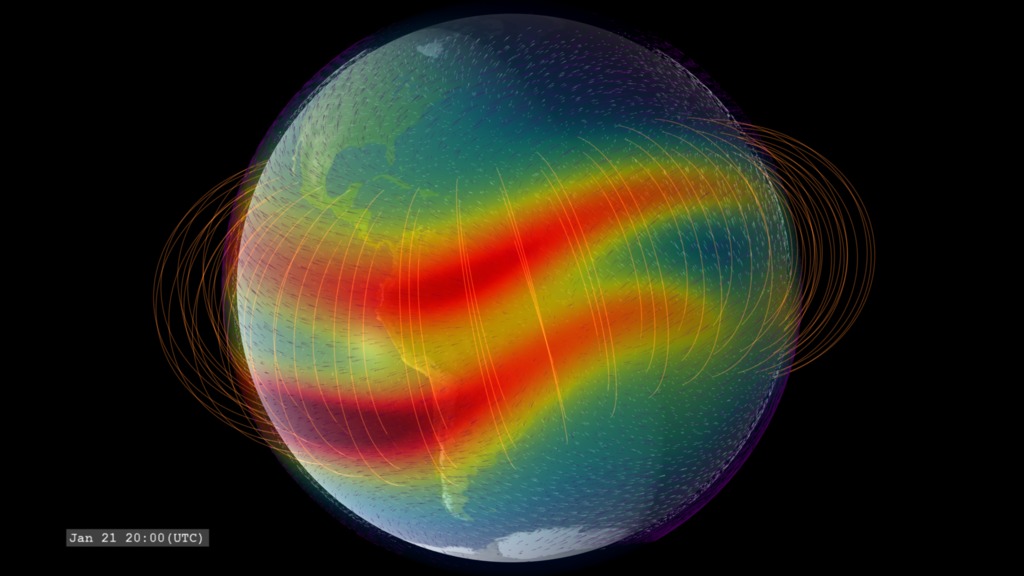
Exploring the Ionosphere: The Dayside Ionosphere
Go to this pageA view of the singly-ionizing oxygen atom on the dayside of Earth. This represents the variation of the enhancments due to variation in the geomagnetic field. This version interpolates the IRI model to a higher time cadence for a smoother animation. || IRIDaily.sunward_O+ion.clockSlate_CRTT.UHD3840.001001_print.jpg (1024x576) [58.1 KB] || IRIDaily.sunward_O+ion.IRIinterp.HD1080i_p30.mp4 (1920x1080) [50.1 MB] || IRI.interpolated (1920x1080) [0 Item(s)] || IRIDaily.sunward_O+ion.IRIinterp.HD1080i_p30.webm (1920x1080) [17.1 MB] || IRIDaily.sunward_O+ion.IRIinterp.UHD3840_2160p30.mp4 (3840x2160) [72.7 MB] || IRI.interpolated (3840x2160) [0 Item(s)] || IRIDaily.sunward_O+ion.IRIinterp_4504.key [51.9 MB] || IRIDaily.sunward_O+ion.IRIinterp_4504.pptx [51.6 MB] || exploring-the-ionosphere-the-dayside-ionosphere.hwshow [308 bytes] ||
- ID: 4539 Visualization
Exploring Earth's Ionosphere: Limb view with approach
Go to this pageOxygen ion enhancements at 350km altitude, ionospheric winds at altitudes of 100 km (white) and 350 km (violet) and the low-latitude geomagnetic field. || IRIDaily.zoom2limb_OionHwindIGRF.clockSlate_CRTT.HD1080i.000400_print.jpg (1024x576) [92.1 KB] || IRIDaily.zoom2limb_OionHwindIGRF.clockSlate_CRTT.HD1080i.000400_searchweb.png (320x180) [58.1 KB] || IRIDaily.zoom2limb_OionHwindIGRF.clockSlate_CRTT.HD1080i.000400_thm.png (80x40) [4.9 KB] || IRIDaily.zoom2limb_OionHwindIGRF.HD1080i_p30.mp4 (1920x1080) [89.8 MB] || OionHwindIGRF (1920x1080) [0 Item(s)] || IRIDaily.zoom2limb_OionHwindIGRF.HD1080i_p30.webm (1920x1080) [8.6 MB] || OionHwindIGRF (3840x2160) [0 Item(s)] || IRIDaily.zoom2limb_OionHwindIGRF.2160p30.mp4 (3840x2160) [274.0 MB] || IRIDaily.zoom2limb_OionHwindIGRF.HD1080i_p30.mp4.hwshow [210 bytes] ||
- ID: 30179 Hyperwall Visual
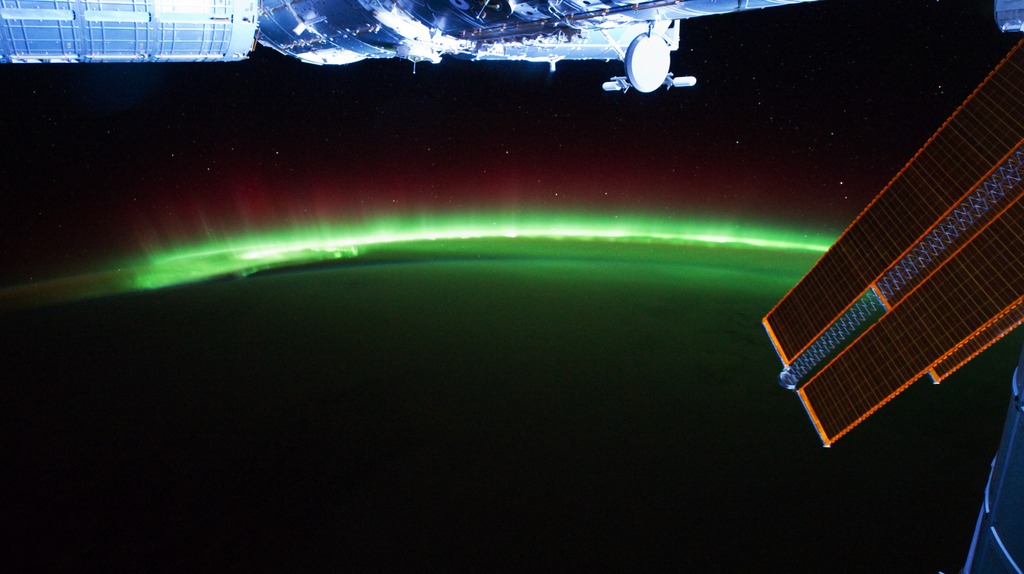
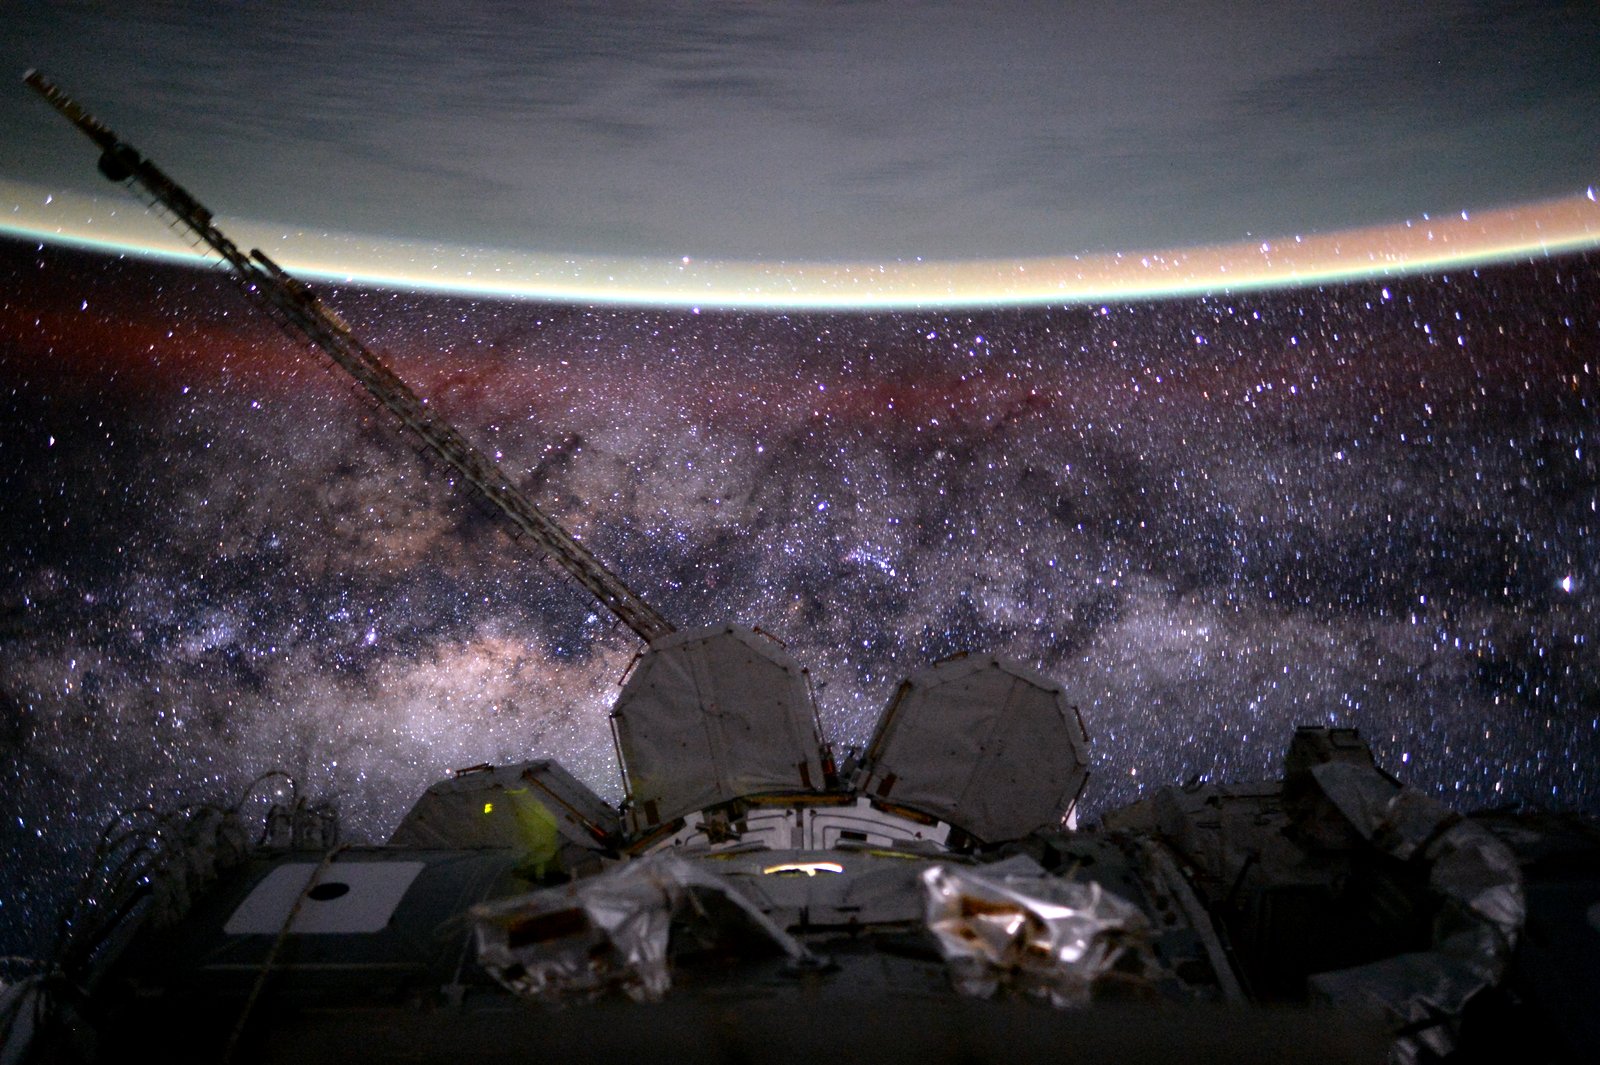
ISS Timelapse: Aurora Australis
Go to this pageThe photographs used to make this video were taken on September 17, 2011 from 17:22:27 to 17:37:21 GMT from the International Space Station (ISS). This image sequence begins over the Indian Ocean halfway between Madagascar and Antarctica. Aurora Australis is present for the first 2/3rds of the video, then Australis comes into view. Yellow lights near the coast show the presence of cities, while interior oragne lights indicate brush fires.http://eol.jsc.nasa.gov ||
- ID: 4617 Visualization
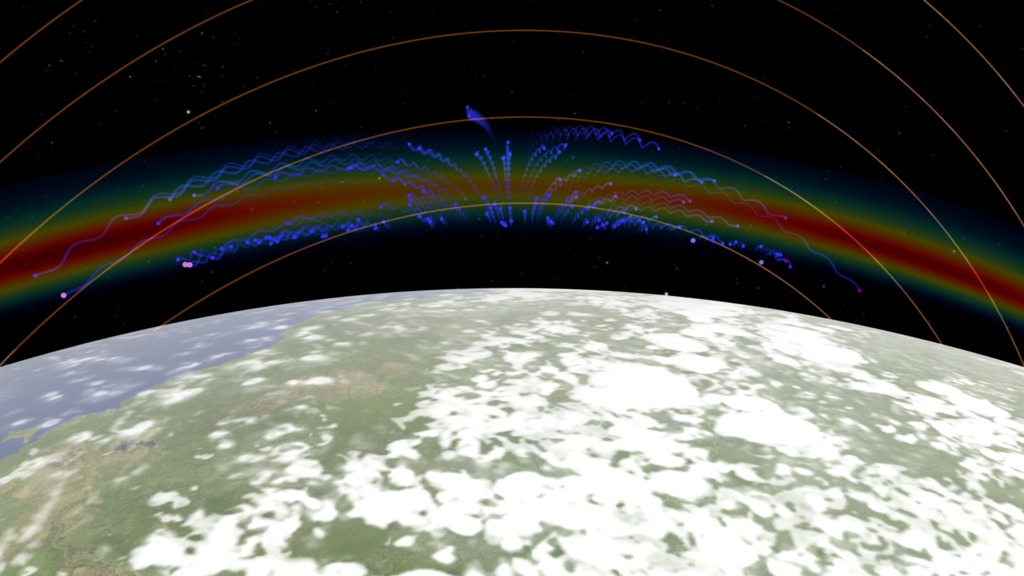
Interface to Space: The Equatorial Fountain
Go to this pageVisualization illustrating the Fountain Effect of ions in the near-Earth electric and magnetic fields. || IRIConceptual.Limb2PullOut_OionFountainIGRF.noslate_CRTT.HD1080i.000660_print.jpg (1024x576) [114.5 KB] || IRIConceptual.Limb2PullOut_OionFountainIGRF.noslate_CRTT.HD1080i.000660_searchweb.png (320x180) [87.8 KB] || IRIConceptual.Limb2PullOut_OionFountainIGRF.noslate_CRTT.HD1080i.000660_thm.png (80x40) [7.2 KB] || 1920x1080_16x9_30p (1920x1080) [0 Item(s)] || IRIConceptual.Limb2PullOut_OionFountainIGRF.HD1080i_p30.mp4 (1920x1080) [32.1 MB] || IRIConceptual.Limb2PullOut_OionFountainIGRF.HD1080i_p30.webm (1920x1080) [4.2 MB] || 3840x2160_16x9_30p (3840x2160) [0 Item(s)] || IRIConceptual.Limb2PullOut_OionFountainIGRF_2160p30.mp4 (3840x2160) [96.1 MB] || IRIConceptual.Limb2PullOut_OionFountainIGRF.HD1080i_p30.mp4.hwshow [221 bytes] ||
- ID: 12523 Produced Video
Aurora Imagery from Poker Flats
Go to this pageThe northern lights were seen over Alaska the night of Feb. 16, 2017 at the the Poker Flat Research Range north of Fairbanks. Credit: NASA/Terry Zaperach || PFAurora2.gif (1200x800) [1.5 MB] || PFAurora2_searchweb.png (320x180) [57.6 KB] || PFAurora2_thm.png (80x40) [4.7 KB] ||
- ID: 12963 Produced Video
Airglow Imagery
Go to this pageAirglow occurs when atoms and molecules in the upper atmosphere, excited by sunlight, emit light in order to shed their excess energy. The phenomenon is similar to auroras, but where auroras are driven by high-energy particles originating from the solar wind, airglow is sparked by day-to-day solar radiation. Airglow carries information on the upper atmosphere’s temperature, density, and composition, but it also helps us trace how particles move through the region itself. Vast, high-altitude winds sweep through the ionosphere, pushing its contents around the globe — and airglow’s subtle dance follows their lead, highlighting global patterns. ||
ICON Launch
- ID: 12910 Produced Video
ICON Launch Sequence
Go to this pageThe Ionospheric Connection Explorer, or ICON, will study the frontier of space: the dynamic zone high in our atmosphere where Earth weather and space weather meet. In fall 2018, the mission launches on an Northrop Grumman (formerly Orbital ATK) Pegasus XL rocket from NASA's Kennedy Space Center in Florida. ||
- ID: 12974 Produced Video
ICON's Launch Site
Go to this pageThe Ionospheric Connection Explorer, or ICON, will study the frontier of space: the dynamic zone high in our atmosphere where Earth weather and space weather meet. In fall 2018, the mission launches on an Northrop Grumman (formerly Orbital ATK) Pegasus XL rocket from NASA's Kennedy Space Center in Florida. ||
About ICON and GOLD
- ID: 12817 Produced Video
![Complete transcript available.Music credits: 'Faint Glimmer' by Andrew John Skeet [PRS], Andrew Michael Britton [PRS], David Stephen Goldsmith [PRS], 'Ocean Spirals' by Andrew John Skeet [PRS], Andrew Michael Britton [PRS], David Stephen Goldsmith [PRS] from Killer Tracks.Watch this video on the NASA Goddard YouTube channel.](/vis/a010000/a012800/a012817/GOLDOverview_YouTube.00001_print.jpg)
Why NASA Is Exploring The Edge Of Our Planet
Go to this pageThe Global-scale Observations of the Limb and Disk, or GOLD, instrument launches aboard a commercial communications satellite in January 2018 to inspect the dynamic intermingling of space and Earth’s uppermost atmosphere. Together, GOLD and another NASA mission, Ionospheric Connection Explorer spacecraft, or ICON, will provide the most comprehensive of Earth’s upper atmosphere we’ve ever had.Above the ozone layer, the ionosphere is a part of Earth’s atmosphere where particles have been cooked into a sea of electrically-charged electrons and ions by the Sun’s radiation. The ionosphere is co-mingled with the very highest — and quite thin — layers of Earth’s neutral upper atmosphere, making this region an area that is constantly in flux undergoing the push-and-pull between Earth’s conditions and those in space. Increasingly, these layers of near-Earth space are part of the human domain, as it’s home not only to astronauts, but to radio signals used to guide airplanes and ships, and satellites that provide our communications and GPS systems. Understanding the fundamental processes that govern our upper atmosphere and ionosphere is crucial to improve situational awareness that helps protect astronauts, spacecraft and humans on the ground.GOLD, in geostationary orbit over the Western Hemisphere, will build up a full-disk view of the ionosphere and upper atmosphere every half hour, providing detailed large-scale measurements of related processes — a cadence which makes it the first mission to be able to monitor the true weather of the upper atmosphere. GOLD is also able to focus in on a tighter region and scan more quickly, to complement additional research plans as needed. ||
- ID: 4527 Visualization
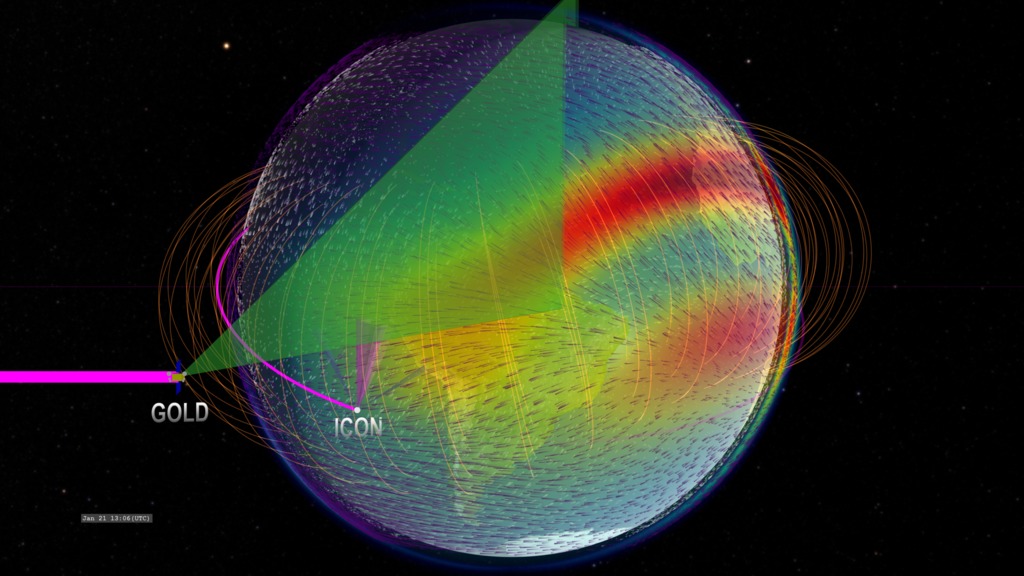
ICON and GOLD: Instrument Scanning Coverage
Go to this pageVisualization of ICON and GOLD orbiting Earth with image scanning. This version presents several geospace models, including the singly-ionized oxygen density, the low-latitude geomagnetic field, and the high-altitude winds (100km and 350km altitudes). || IRIGOLDscan.GOLDview3_OionHwindIGRF.clockSlate_CRTT.UHD3840.001140_print.jpg (1024x576) [130.5 KB] || IRIGOLDscan.GOLDview3_OionHwindIGRF.clockSlate_CRTT.UHD3840.001140_searchweb.png (320x180) [85.0 KB] || IRIGOLDscan.GOLDview3_OionHwindIGRF.clockSlate_CRTT.UHD3840.001140_thm.png (80x40) [5.9 KB] || IRIGOLDscan.GOLDview3_OionHwindIGRF.HD1080i_p30.mp4 (1920x1080) [82.0 MB] || IRIGOLDscan.GOLDview3_OionHwindIGRF (1920x1080) [0 Item(s)] || IRIGOLDscan.GOLDview3_OionHwindIGRF.HD1080i_p30.webm (1920x1080) [7.6 MB] || IRIGOLDscan.GOLDview3_OionHwindIGRF (3840x2160) [0 Item(s)] || IRIGOLDscan.GOLDview3_OionHwindIGRF_2160p30.mp4 (3840x2160) [258.1 MB] ||
- ID: 4498 Visualization
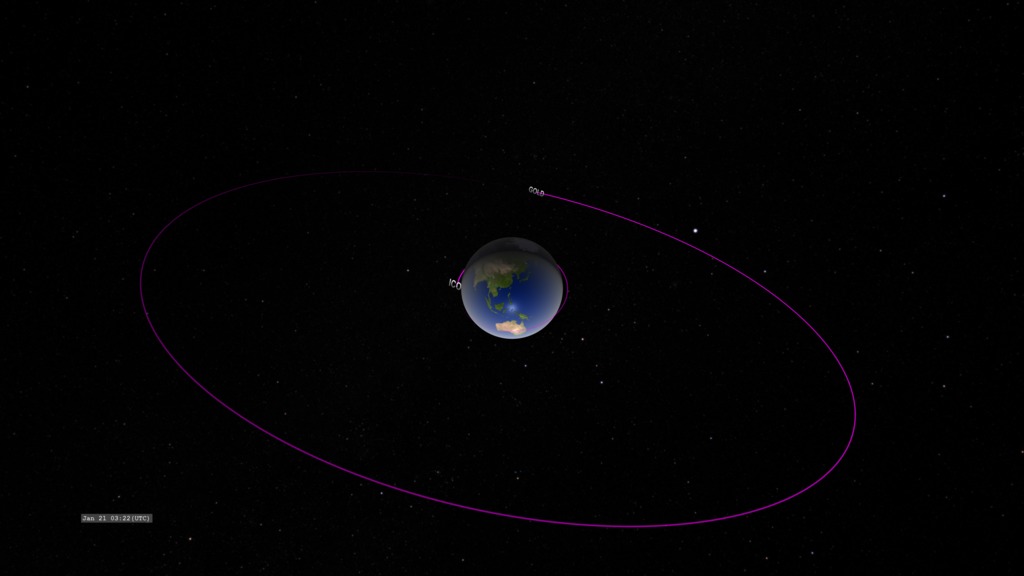
ICON and GOLD: Exploring the Interface to Space
Go to this pageA basic view of the orbits for ICON (Ionospheric Connections Explorer) and GOLD (Global-scale Observations of the Limb and Disk). These missions will conduct measurements of ionospheric composition, ionization, and winds to better understand the connection between space weather and its terrestrial impacts.In this visualization, we present GOLD (in geostationary orbit around Earth) and ICON (in low Earth orbit). The colors over Earth represent model data from the IRI (International Reference Ionosphere) model of the density of the singly-ionized oxygen atom at an altitude of 350 kilometers. Red represents high density. The ion density is enhanced above and below the geomagnetic equator (not perfectly aligned with the geographic equator) on the dayside due to the ionizing effects of solar ultraviolet radiation combined with the effects of high-altitude winds and the geomagnetic field. ||
- ID: 40345 Gallery
GOLD – Global-scale Observations of the Limb and Disk
Go to this pageNASA’s Global-scale Observations of the Limb and Disk (GOLD) mission focuses on two parts of Earth’s upper atmosphere stretching from about 50 to 400 miles in altitude — the neutral layer called the thermosphere, and the electrically charged particles that make up the ionosphere. From its vantage point on a commercial communications satellite in geostationary orbit, the GOLD instrument makes hemisphere-wide observations of the ionosphere about every 30 minutes. This unprecedented birds-eye view is giving scientists new insights into how this region changes. GOLD launched on Jan. 25, 2018, from the Guiana Space Centre in Kourou, French Guiana, aboard an Ariane 5 rocket as a hosted payload on the SES-14 commercial satellite. Learn more: https://science.nasa.gov/mission/gold/
Graphics
- ID: 12961 Produced Video
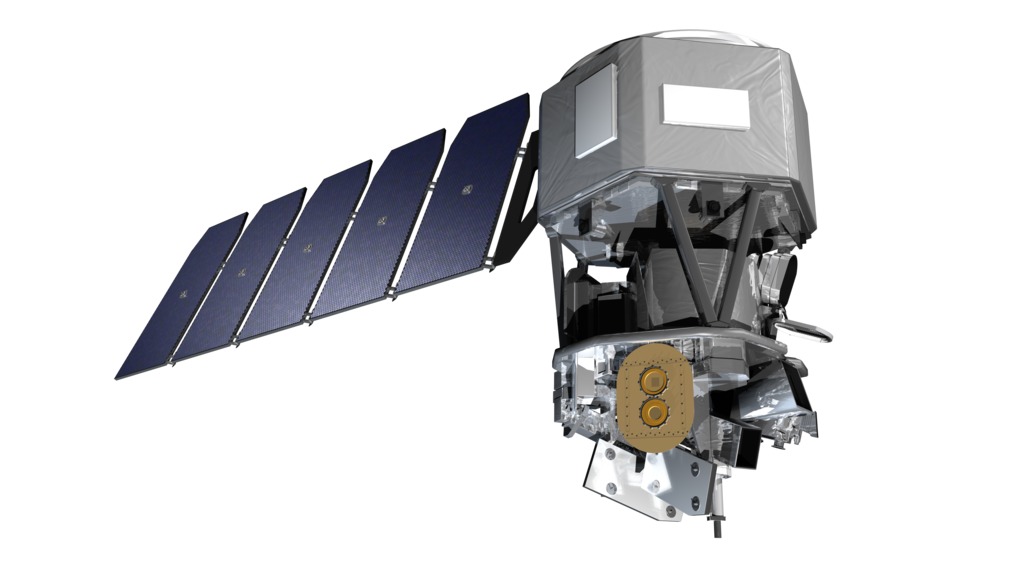
ICON Graphics
Go to this pageThe Ionospheric Connection Explorer, or ICON, is a low-Earth orbiting satellite that will give us new information about how Earth’s atmosphere interacts with near-Earth space — a give-and-take that plays a major role in the safety of our satellites and reliability of communications signals. Specifically, ICON investigates the connections between the neutral atmosphere — which extends from here near the surface to far above us, at the edge of space — and the electrically charged part of the atmosphere, called the ionosphere. The particles of the ionosphere carry electrical charge that can disrupt communications signals, cause satellites in low-Earth orbit to become electrically charged, and, in extreme cases, cause power outages on the ground. ||
- ID: 12960 Infographic
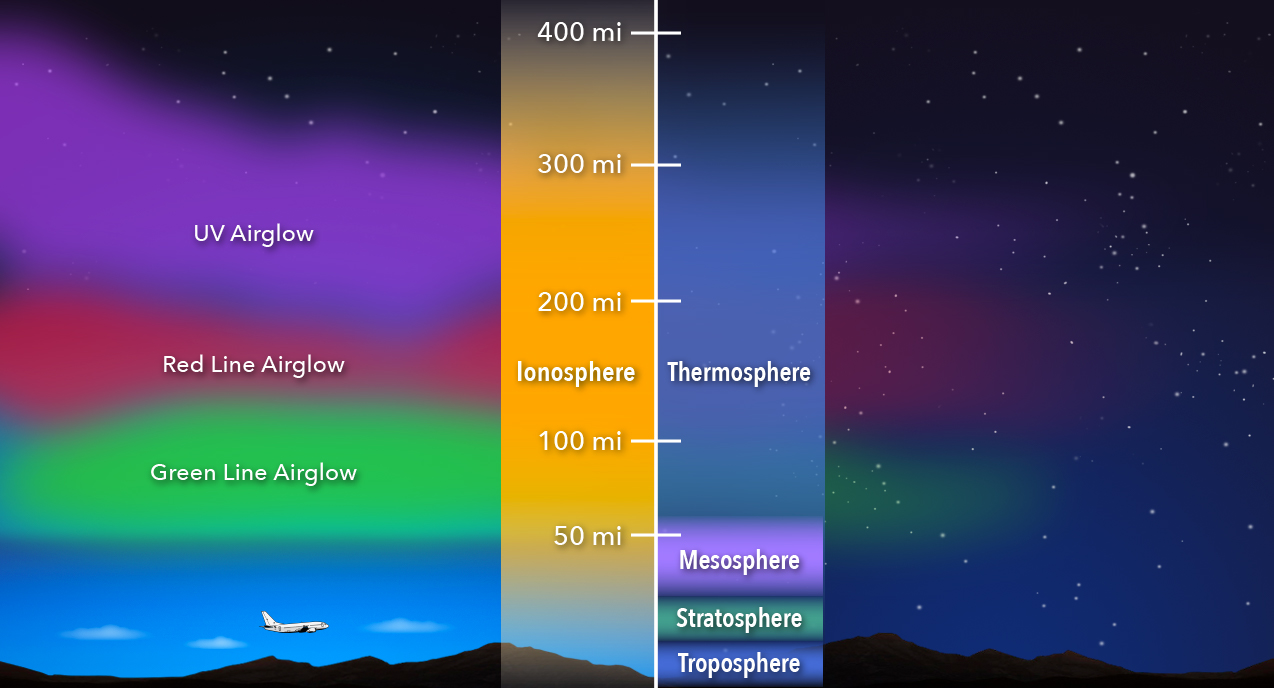
Ionosphere Graphics
Go to this pageStretching from roughly 50 to 400 miles above Earth’s surface, the ionosphere is an electrified layer of the upper atmosphere, generated by extreme ultraviolet radiation from the Sun. It’s neither fully Earth nor space, and instead, reacts to both terrestrial weather below and solar energy streaming in from above, forming a complex space weather system of its own. The particles of the ionosphere carry electrical charge that can disrupt communications signals, cause satellites in low-Earth orbit to become electrically charged, and, in extreme cases, cause power outages on the ground. Positioned on the edge of space and intermingled with the neutral atmosphere, the ionosphere’s response to conditions on Earth and in space is difficult to pin down. ||
- ID: 12973 Infographic
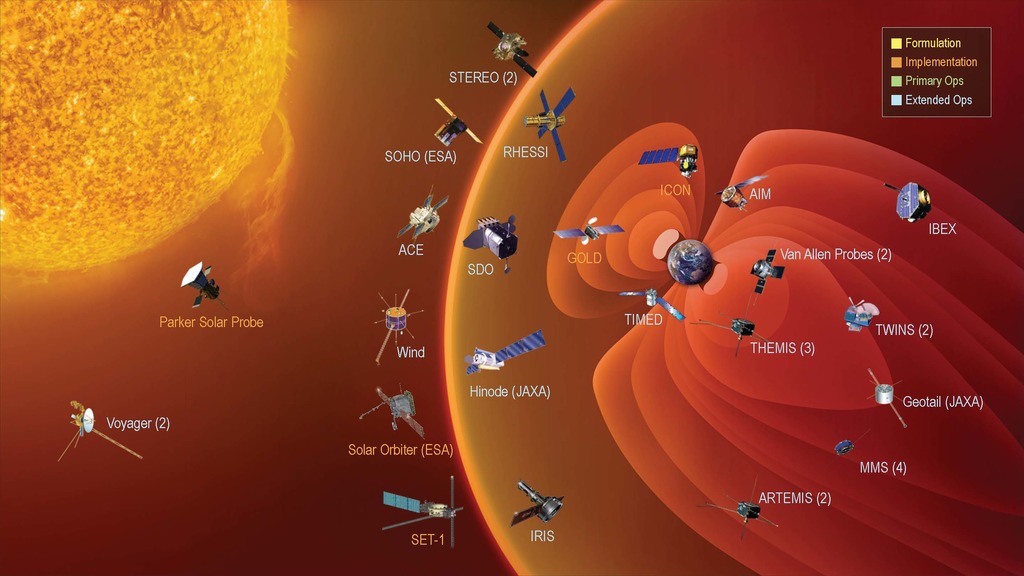
NASA's Heliophysics Fleet
Go to this pageHeliophysics encompasses science that improves our understanding of fundamental physical processes throughout the solar system, and enables us to understand how the Sun, as the major driver of the energy throughout the solar system, impacts our technological society. The scope of heliophysics is vast, spanning from the Sun’s interior to Earth’s upper atmosphere, throughout interplanetary space, to the edges of the heliosphere, where the solar wind interacts with the local interstellar medium. Heliophysics incorporates studies of the interconnected elements in a single system that produces dynamic space weather and that evolves in response to solar, planetary, and interstellar conditions. ||
- ID: 12975 Produced Video
ICON Photos
Go to this pageThe Ionospheric Connection Explorer, or ICON, is a low-Earth orbiting satellite that will give us new information about how Earth’s atmosphere interacts with near-Earth space — a give-and-take that plays a major role in the safety of our satellites and reliability of communications signals.Specifically, ICON investigates the connections between the neutral atmosphere — which extends from here near the surface to far above us, at the edge of space — and the electrically charged part of the atmosphere, called the ionosphere. The particles of the ionosphere carry electrical charge that can disrupt communications signals, cause satellites in low-Earth orbit to become electrically charged, and, in extreme cases, cause power outages on the ground. ||