GOLD – Global-scale Observations of the Limb and Disk
Overview
NASA’s Global-scale Observations of the Limb and Disk (GOLD) mission focuses on two parts of Earth’s upper atmosphere stretching from about 50 to 400 miles in altitude — the neutral layer called the thermosphere, and the electrically charged particles that make up the ionosphere. From its vantage point on a commercial communications satellite in geostationary orbit, the GOLD instrument makes hemisphere-wide observations of the ionosphere about every 30 minutes. This unprecedented birds-eye view is giving scientists new insights into how this region changes.
GOLD launched on Jan. 25, 2018, from the Guiana Space Centre in Kourou, French Guiana, aboard an Ariane 5 rocket as a hosted payload on the SES-14 commercial satellite.
Learn more: https://science.nasa.gov/mission/gold/
About the Mission
- ID: 20275 Animation
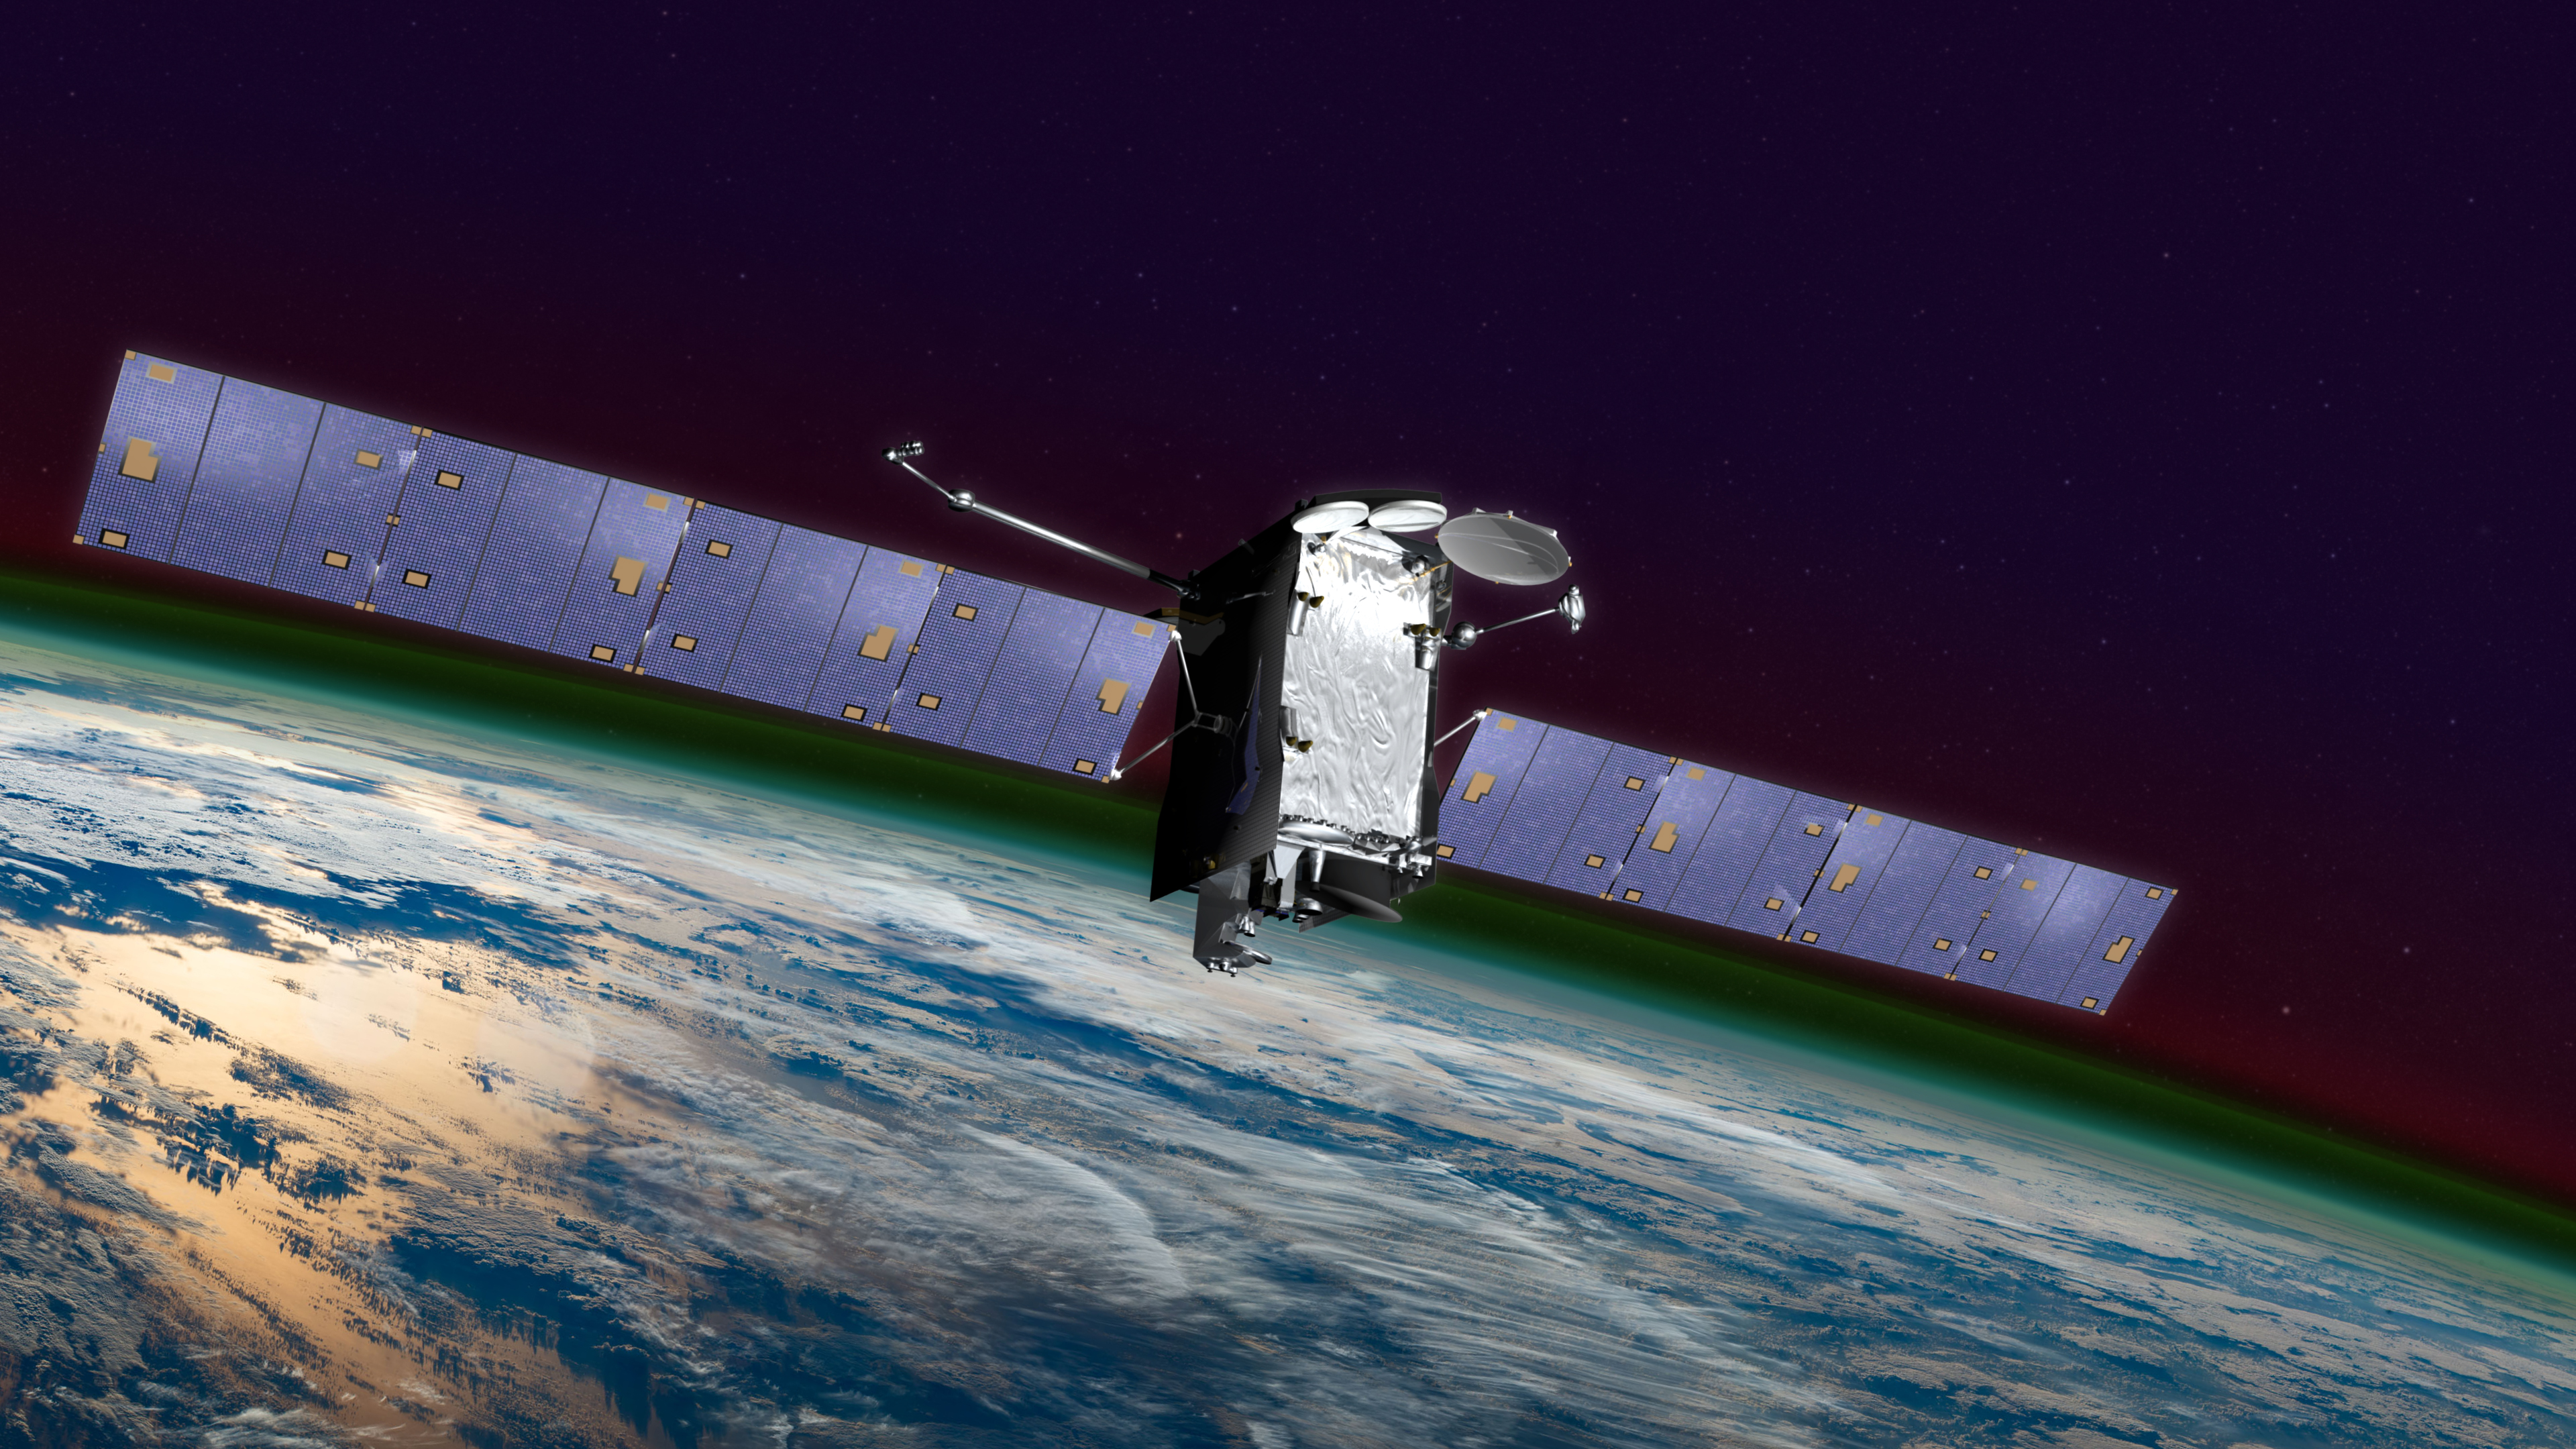
GOLD on SES-14 Animation
Go to this pageAnimation depicting GOLD on the SES-14 satellite in transit to geostationary orbit. Credit: NASA GSFC/CIL/Chris Meaney || GOLD-comp2_00502_print.jpg (1024x576) [143.6 KB] || GOLD-comp2_00502_searchweb.png (320x180) [84.3 KB] || GOLD-comp2_00502_thm.png (80x40) [5.8 KB] || GOLDv3_1080p60.mp4 (1920x1080) [9.9 MB] || Goldv3-Prores.webm (1920x1080) [1.3 MB] || Goldv3-Prores.mov (1920x1080) [342.1 MB] || Goldv3-h264.mov (1920x1080) [573.1 MB] || 1920x1080_16x9_60p (3840x2160) [0 Item(s)] ||
- ID: 12825 Infographic
GOLD Resources
Go to this pageThe Global-scale Observations of the Limb and Disk, or GOLD, mission is designed to explore the nearest reaches of space. Capturing never-before-seen images of Earth’s upper atmosphere, GOLD explores in unprecedented detail our space environment — which is home to astronauts, radio signals used to guide airplanes and ships, as well as satellites that provide communications and GPS systems. The more we know about the fundamental physics of this region of space, the more we can protect our assets there.Gathering observations from geostationary orbit above the Western Hemisphere, GOLD measures the temperature and composition of neutral gases in Earth’s thermosphere. This part of the atmosphere co-mingles with the ionosphere, which is made up of charged particles. Both the Sun from above and terrestrial weather from below can change the types, numbers, and characteristics of the particles found here — and GOLD helps track those changes.Activity in this region is responsible for a variety of key space weather events. GOLD scientists are particularly interested in the cause of dense, unpredictable bubbles of charged gas that appear over the equator and tropics, sometimes causing communication problems. As we discover the very nature of the Sun-Earth interaction in this region, the mission could ultimately lead to ways to improve forecasts of such space weather and mitigate its effects. ||
- ID: 12817 Produced Video
![Complete transcript available.Music credits: 'Faint Glimmer' by Andrew John Skeet [PRS], Andrew Michael Britton [PRS], David Stephen Goldsmith [PRS], 'Ocean Spirals' by Andrew John Skeet [PRS], Andrew Michael Britton [PRS], David Stephen Goldsmith [PRS] from Killer Tracks.Watch this video on the NASA Goddard YouTube channel.](/vis/a010000/a012800/a012817/GOLDOverview_YouTube.00001_print.jpg)
Why NASA Is Exploring The Edge Of Our Planet
Go to this pageThe Global-scale Observations of the Limb and Disk, or GOLD, instrument launches aboard a commercial communications satellite in January 2018 to inspect the dynamic intermingling of space and Earth’s uppermost atmosphere. Together, GOLD and another NASA mission, Ionospheric Connection Explorer spacecraft, or ICON, will provide the most comprehensive of Earth’s upper atmosphere we’ve ever had.Above the ozone layer, the ionosphere is a part of Earth’s atmosphere where particles have been cooked into a sea of electrically-charged electrons and ions by the Sun’s radiation. The ionosphere is co-mingled with the very highest — and quite thin — layers of Earth’s neutral upper atmosphere, making this region an area that is constantly in flux undergoing the push-and-pull between Earth’s conditions and those in space. Increasingly, these layers of near-Earth space are part of the human domain, as it’s home not only to astronauts, but to radio signals used to guide airplanes and ships, and satellites that provide our communications and GPS systems. Understanding the fundamental processes that govern our upper atmosphere and ionosphere is crucial to improve situational awareness that helps protect astronauts, spacecraft and humans on the ground.GOLD, in geostationary orbit over the Western Hemisphere, will build up a full-disk view of the ionosphere and upper atmosphere every half hour, providing detailed large-scale measurements of related processes — a cadence which makes it the first mission to be able to monitor the true weather of the upper atmosphere. GOLD is also able to focus in on a tighter region and scan more quickly, to complement additional research plans as needed. ||
- ID: 4503 Visualization
Exploring the Ionosphere: The View from GOLD
Go to this pageCloseup view of Earth from the perspective of the GOLD instrument. This version interpolates the IRI model to a higher time cadence for a smoother animation. || IRIDaily.GOLDview_O+ion_O+ionSlice.clockSlate_CRTT.UHD3840.001002_print.jpg (1024x576) [50.7 KB] || IRIDaily.GOLDview_O+ion_O+ionSlice.IRIinterp.HD1080i_p30.mp4 (1920x1080) [56.7 MB] || IRI.interpolate (1920x1080) [0 Item(s)] || IRIDaily.GOLDview_O+ion_O+ionSlice.IRIinterp.HD1080i_p30.webm (1920x1080) [17.1 MB] || IRI.interpolate (3840x2160) [0 Item(s)] || IRIDaily.GOLDview_O+ion_O+ionSlice.IRIinterp_4503.key [57.9 MB] || IRIDaily.GOLDview_O+ion_O+ionSlice.IRIinterp_4503.pptx [57.6 MB] || IRIDaily.GOLDview_O+ion_O+ionSlice.IRIinterp_2160p30.mp4 (3840x2160) [200.2 MB] ||
- ID: 4607 Visualization
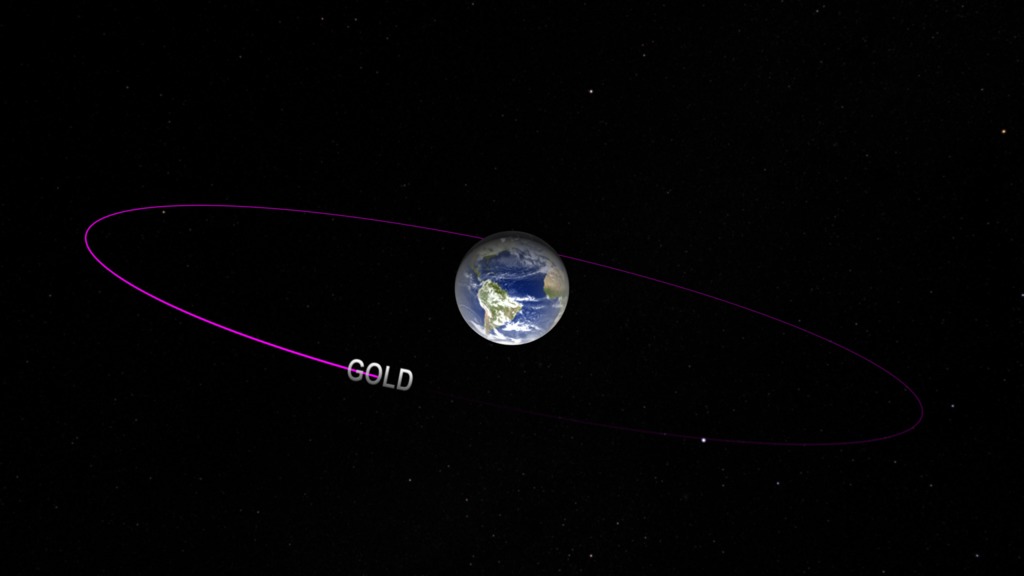
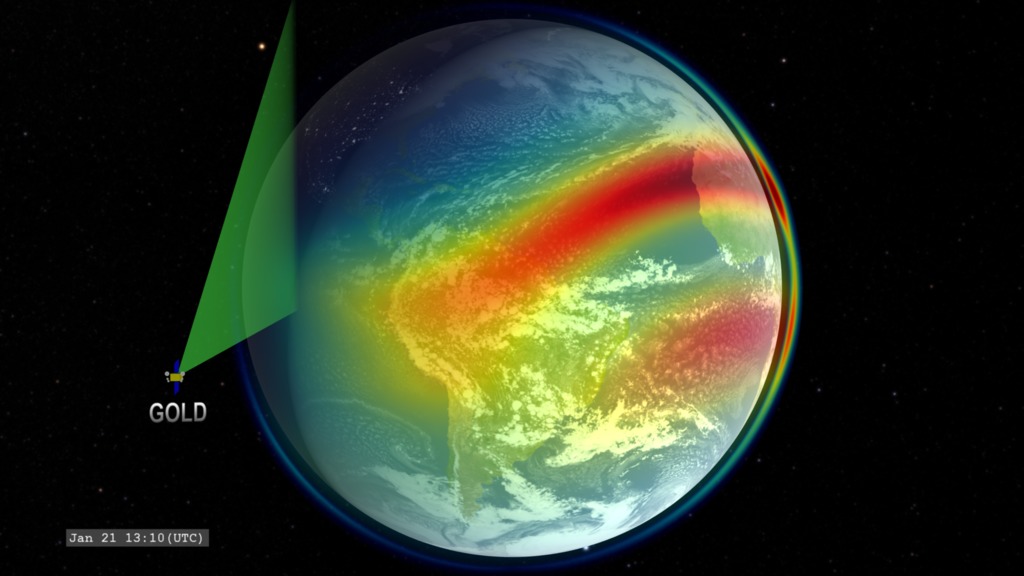
GOLD in Geostationary Orbit
Go to this pageThe GOLD instrument orbits Earth in a geostationary orbit over the western hemisphere. || IRIDaily.oblique_.noslate_CRTT.HD1080i.000450_print.jpg (1024x576) [43.8 KB] || IRIDaily.oblique_.noslate_CRTT.HD1080i.000450_searchweb.png (320x180) [44.0 KB] || IRIDaily.oblique_.noslate_CRTT.HD1080i.000450_thm.png (80x40) [2.3 KB] || 1920x1080_16x9_30p (1920x1080) [0 Item(s)] || IRIDaily.oblique_GOLD.HD1080i_p30.mp4 (1920x1080) [22.4 MB] || IRIDaily.oblique_GOLD.HD1080i_p30.webm (1920x1080) [8.5 MB] || 3840x2160_16x9_30p (3840x2160) [0 Item(s)] || IRIDaily.oblique_GOLD.UHD3840_2160p30.mp4 (3840x2160) [90.1 MB] || IRIDaily.oblique_GOLD.HD1080i_p30.mp4.hwshow [199 bytes] ||
- ID: 4610 Visualization
GOLD: Instrument Scanning Coverage
Go to this pageVisualization of GOLD orbiting Earth with image scanning. This version presents the singly-ionized oxygen density from the IRI model. || IRIGOLDscan.GOLDview3_Oion.clockSlate_CRTT.HD1080i.001400_print.jpg (1024x576) [90.3 KB] || IRIGOLDscan.GOLDview3_Oion.clockSlate_CRTT.HD1080i.001400_searchweb.png (320x180) [79.2 KB] || IRIGOLDscan.GOLDview3_Oion.clockSlate_CRTT.HD1080i.001400_thm.png (80x40) [6.1 KB] || 1920x1080_16x9_30p (1920x1080) [0 Item(s)] || IRIGOLDscan.GOLDview4_Oion.HD1080i_p30.mp4 (1920x1080) [38.5 MB] || IRIGOLDscan.GOLDview4_Oion.HD1080i_p30.webm (1920x1080) [10.0 MB] || IRIGOLDscan.GOLDview4_Oion.HD1080i_p30.mp4.hwshow [204 bytes] ||
The Ionosphere
- ID: 12532 Produced Video
Welcome to the Ionosphere
Go to this pageMusic credit: Foxy Trot by Luis Enriquez Bacalov Complete transcript available.Watch this video on the NASA Goddard YouTube channel. || ionosphere_thumb.jpg (1920x1080) [69.9 KB] || ionosphere_thumb_searchweb.png (320x180) [57.3 KB] || ionosphere_thumb_thm.png (80x40) [6.3 KB] || APPLE_TV-12532_Welcome_to_the_ionosphere_bsideV4_appletv.webm (1280x720) [24.0 MB] || APPLE_TV-12532_Welcome_to_the_ionosphere_bsideV4_appletv.m4v (1280x720) [116.4 MB] || APPLE_TV-12532_Welcome_to_the_ionosphere_bsideV4_appletv_subtitles.m4v (1280x720) [116.5 MB] || YOUTUBE_1080-12532_Welcome_to_the_ionosphere_bsideV4_youtube_1080.mp4 (1920x1080) [346.2 MB] || NASA_TV-12532_Welcome_to_the_ionosphere_bsideV4.mpeg (1280x720) [691.7 MB] || 12532_Welcome_to_the_ionosphere_bsideV2_lowres.en_US.srt [3.8 KB] || 12532_Welcome_to_the_ionosphere_bsideV2_lowres.en_US.vtt [3.8 KB] || 12532_Welcome_to_the_ionosphere_bsideV4_lowres.mp4 (480x272) [29.2 MB] || LARGE_MP4-12532_Welcome_to_the_ionosphere_bsideV4_large.mp4 (3840x2160) [220.8 MB] || NASA_PODCAST-12532_Welcome_to_the_ionosphere_bsideV4_ipod_sm.mp4 (320x240) [37.3 MB] || 12532_Welcome_to_the_ionosphere_bsideV4.mov (3840x2160) [10.1 GB] ||
- ID: 4540 Visualization
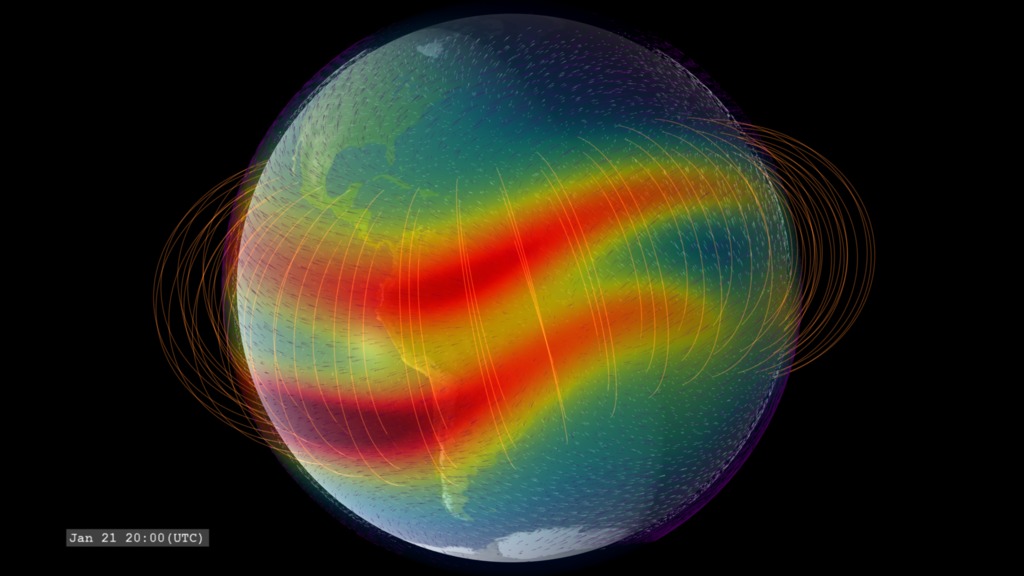
Exploring Earth's Ionosphere: Limb view
Go to this pageThis visualization presents data on the concentration of the singly-ionized oxygen atom (rainbow color table, red is highest concentration), the low-latitude geomagnetic field (gold field lines) and the ionospheric winds at two altitude levels, 100km (white) and 350 km (violet). || IRIDaily.limb_OionHwindIGRF.clockSlate_CRTT.HD1080i.000750_print.jpg (1024x576) [101.4 KB] || IRIDaily.limb_OionHwindIGRF.clockSlate_CRTT.HD1080i.000750_thm.png (80x40) [5.0 KB] || IRIDaily.limb_OionHwindIGRF.clockSlate_CRTT.HD1080i.000750_searchweb.png (320x180) [62.5 KB] || IRIDaily.limb_OionHwindIGRF.HD1080i_p30.mp4 (1920x1080) [88.3 MB] || OionHwindIGRF (1920x1080) [0 Item(s)] || OionHwindIGRF (3840x2160) [0 Item(s)] || IRIDaily.limb_OionHwindIGRF.2160p30.webm (3840x2160) [12.4 MB] || IRIDaily.limb_OionHwindIGRF.2160p30.mp4 (3840x2160) [274.0 MB] || IRIDaily.limb_OionHwindIGRF.HD1080i_p30.mp4.hwshow [205 bytes] ||
- ID: 4504 Visualization

Exploring the Ionosphere: The Dayside Ionosphere
Go to this pageA view of the singly-ionizing oxygen atom on the dayside of Earth. This represents the variation of the enhancments due to variation in the geomagnetic field. This version interpolates the IRI model to a higher time cadence for a smoother animation. || IRIDaily.sunward_O+ion.clockSlate_CRTT.UHD3840.001001_print.jpg (1024x576) [58.1 KB] || IRIDaily.sunward_O+ion.IRIinterp.HD1080i_p30.mp4 (1920x1080) [50.1 MB] || IRI.interpolated (1920x1080) [0 Item(s)] || IRIDaily.sunward_O+ion.IRIinterp.HD1080i_p30.webm (1920x1080) [17.1 MB] || IRIDaily.sunward_O+ion.IRIinterp.UHD3840_2160p30.mp4 (3840x2160) [72.7 MB] || IRI.interpolated (3840x2160) [0 Item(s)] || IRIDaily.sunward_O+ion.IRIinterp_4504.key [51.9 MB] || IRIDaily.sunward_O+ion.IRIinterp_4504.pptx [51.6 MB] || exploring-the-ionosphere-the-dayside-ionosphere.hwshow [308 bytes] ||
- ID: 4539 Visualization
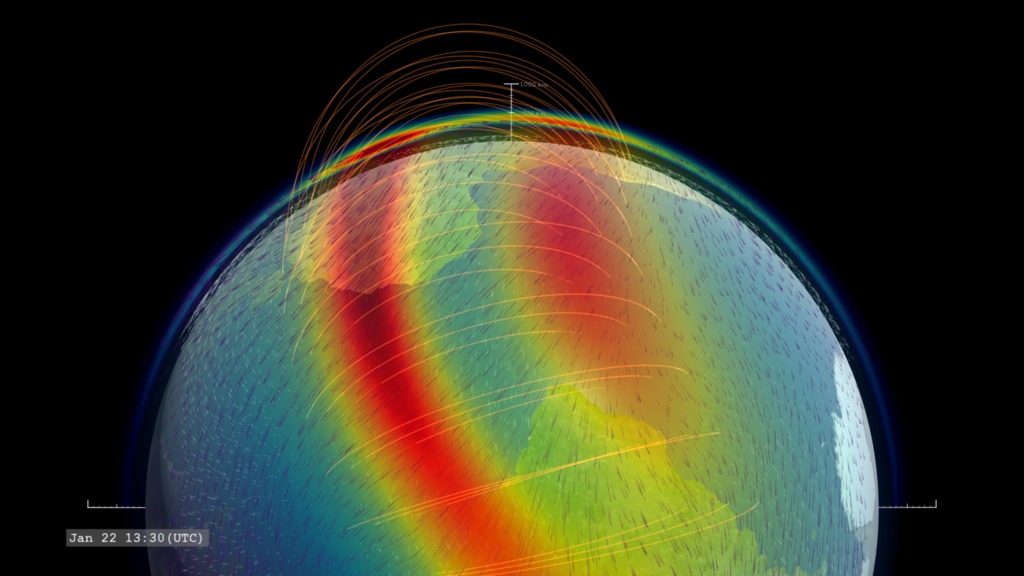
Exploring Earth's Ionosphere: Limb view with approach
Go to this pageOxygen ion enhancements at 350km altitude, ionospheric winds at altitudes of 100 km (white) and 350 km (violet) and the low-latitude geomagnetic field. || IRIDaily.zoom2limb_OionHwindIGRF.clockSlate_CRTT.HD1080i.000400_print.jpg (1024x576) [92.1 KB] || IRIDaily.zoom2limb_OionHwindIGRF.clockSlate_CRTT.HD1080i.000400_searchweb.png (320x180) [58.1 KB] || IRIDaily.zoom2limb_OionHwindIGRF.clockSlate_CRTT.HD1080i.000400_thm.png (80x40) [4.9 KB] || IRIDaily.zoom2limb_OionHwindIGRF.HD1080i_p30.mp4 (1920x1080) [89.8 MB] || OionHwindIGRF (1920x1080) [0 Item(s)] || IRIDaily.zoom2limb_OionHwindIGRF.HD1080i_p30.webm (1920x1080) [8.6 MB] || OionHwindIGRF (3840x2160) [0 Item(s)] || IRIDaily.zoom2limb_OionHwindIGRF.2160p30.mp4 (3840x2160) [274.0 MB] || IRIDaily.zoom2limb_OionHwindIGRF.HD1080i_p30.mp4.hwshow [210 bytes] ||
- ID: 30179 Hyperwall Visual
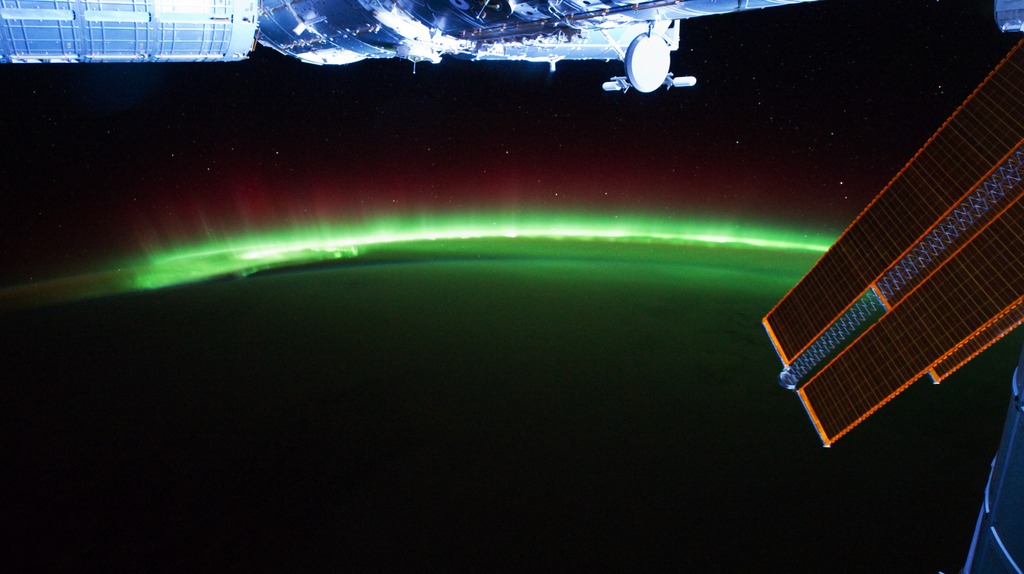
ISS Timelapse: Aurora Australis
Go to this pageThe photographs used to make this video were taken on September 17, 2011 from 17:22:27 to 17:37:21 GMT from the International Space Station (ISS). This image sequence begins over the Indian Ocean halfway between Madagascar and Antarctica. Aurora Australis is present for the first 2/3rds of the video, then Australis comes into view. Yellow lights near the coast show the presence of cities, while interior oragne lights indicate brush fires.http://eol.jsc.nasa.gov ||
GOLD and ICON
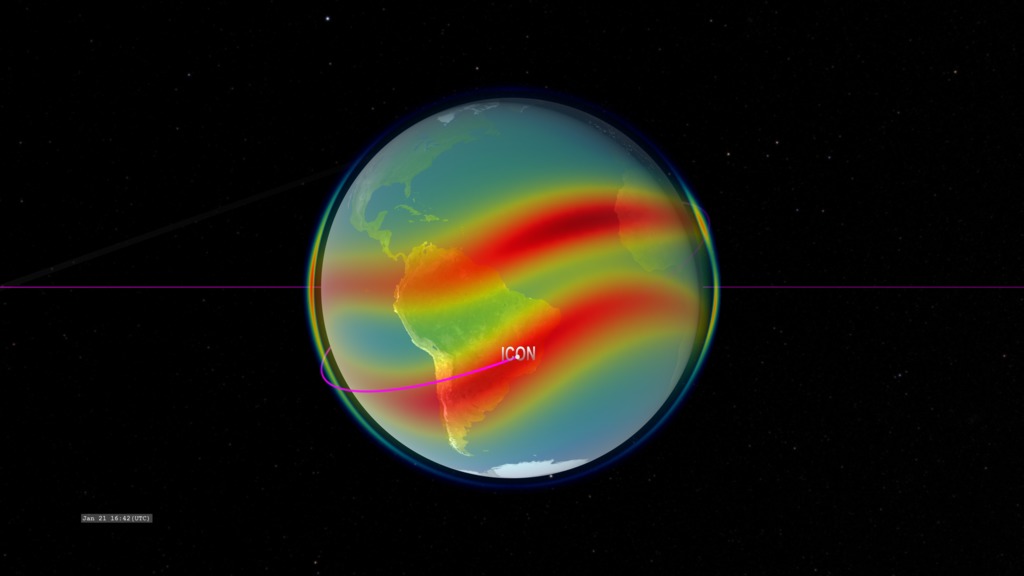
- ID: 4527 Visualization
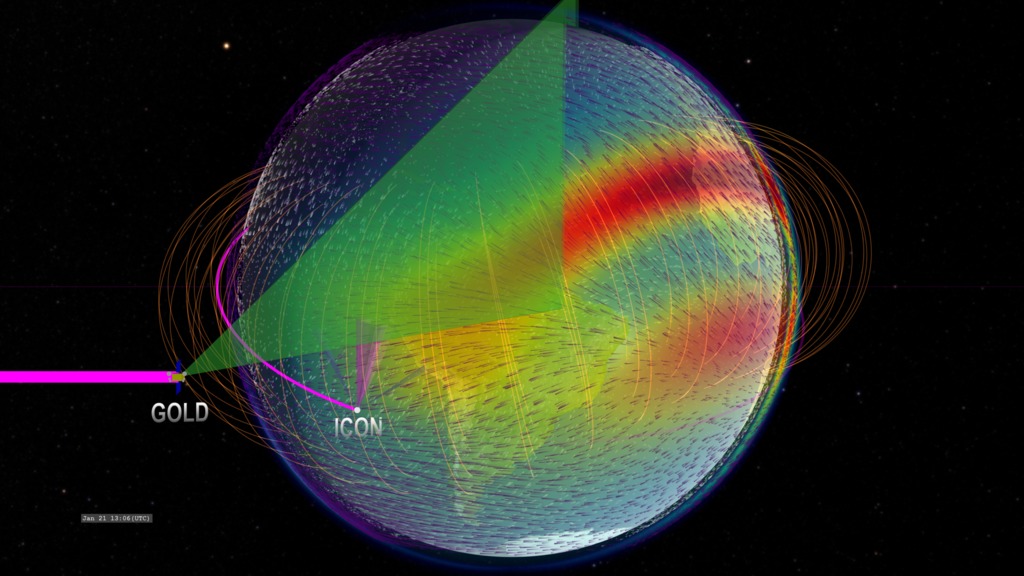
ICON and GOLD: Instrument Scanning Coverage
Go to this pageVisualization of ICON and GOLD orbiting Earth with image scanning. This version presents several geospace models, including the singly-ionized oxygen density, the low-latitude geomagnetic field, and the high-altitude winds (100km and 350km altitudes). || IRIGOLDscan.GOLDview3_OionHwindIGRF.clockSlate_CRTT.UHD3840.001140_print.jpg (1024x576) [130.5 KB] || IRIGOLDscan.GOLDview3_OionHwindIGRF.clockSlate_CRTT.UHD3840.001140_searchweb.png (320x180) [85.0 KB] || IRIGOLDscan.GOLDview3_OionHwindIGRF.clockSlate_CRTT.UHD3840.001140_thm.png (80x40) [5.9 KB] || IRIGOLDscan.GOLDview3_OionHwindIGRF.HD1080i_p30.mp4 (1920x1080) [82.0 MB] || IRIGOLDscan.GOLDview3_OionHwindIGRF (1920x1080) [0 Item(s)] || IRIGOLDscan.GOLDview3_OionHwindIGRF.HD1080i_p30.webm (1920x1080) [7.6 MB] || IRIGOLDscan.GOLDview3_OionHwindIGRF (3840x2160) [0 Item(s)] || IRIGOLDscan.GOLDview3_OionHwindIGRF_2160p30.mp4 (3840x2160) [258.1 MB] ||
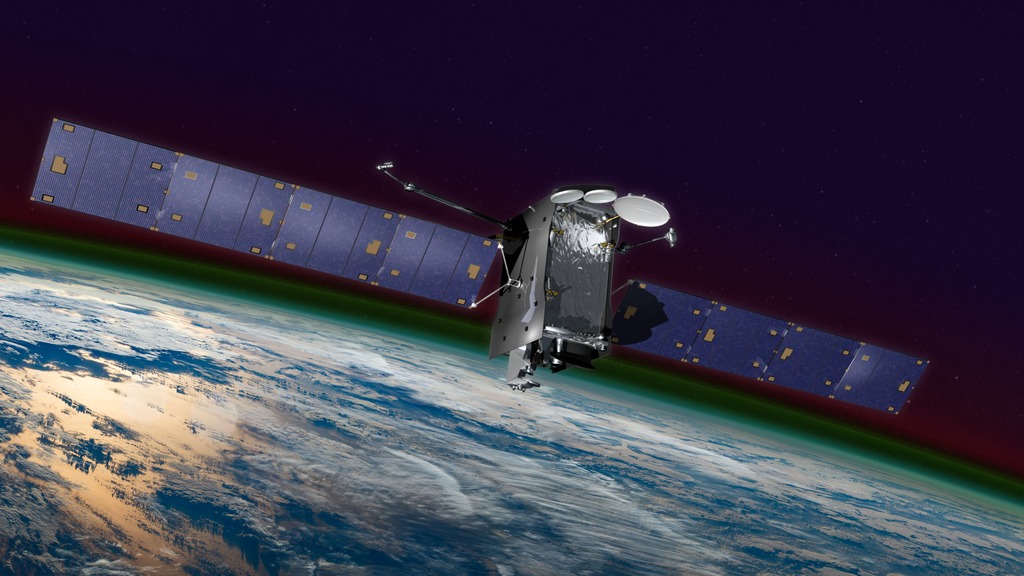
- ID: 12699 Produced Video

Meet ICON: NASA’s Airglow Explorer
Go to this pageMusic credit: Design Principle by Wayne RobertsComplete transcript available. || iss_composite_test_182.jpg (4256x2832) [12.8 MB] || iss_composite_test_182_searchweb.png (320x180) [99.0 KB] || iss_composite_test_182_thm.png (80x40) [6.2 KB] || LARGE_MP4-12699_ICON_Overview_V2__large.mp4 (1920x1080) [148.3 MB] || NASA_TV-12699_ICON_Overview_V2_.mpeg (1280x720) [494.2 MB] || APPLE_TV-12699_ICON_Overview_V2__appletv.m4v (1280x720) [75.3 MB] || YOUTUBE_1080-12699_ICON_Overview_V2__youtube_1080.mp4 (1920x1080) [234.8 MB] || PRORES_B-ROLL-12699_ICON_Overview_V2__prores.mov (1280x720) [1.9 GB] || YOUTUBE_HQ-12699_ICON_Overview_V2__youtube_hq.mov (1920x1080) [539.3 MB] || 12699_ICON_Overview_V2_.mov (1920x1080) [3.7 GB] || LARGE_MP4-12699_ICON_Overview_V2__large.webm (1920x1080) [16.3 MB] || APPLE_TV-12699_ICON_Overview_V2__appletv_subtitles.m4v (1280x720) [75.3 MB] || 12699_ICON_Overview_V2.en_US.srt [2.4 KB] || 12699_ICON_Overview_V2.en_US.vtt [2.5 KB] || NASA_PODCAST-12699_ICON_Overview_V2__ipod_sm.mp4 (320x240) [25.4 MB] || 12699_ICON_Overview_V2__lowres.mp4 (480x272) [20.3 MB] ||
Broadcasts
- ID: 12833 Produced Video
GOLD Media Telecon
Go to this pageThe Global-scale Observations of the Limb and Disk, or GOLD, mission is designed to explore the nearest reaches of space. Capturing never-before-seen images of Earth’s upper atmosphere, GOLD explores in unprecedented detail our space environment — which is home to astronauts, radio signals used to guide airplanes and ships, as well as satellites that provide communications and GPS systems. On January 25, 2018, the mission will launch as NASA's first-ever hosted payload.Speakers for the January 24, 2018 media telecon about the mission include:Richard Eastes, Principal Investigator, Laboratory for Atmospheric and Space Physics at the University of Colorado BoulderElsayed Talaat, Heliophysics Chief Scientist, NASA HeadquartersSusan Batiste, Systems Engineer, LASP/CUKatelynn Greer, Research Scientist, LASP/CUReplay information will be available until January 31, 2018 noon ET, via: Toll free, from within the U.S.: 1-866-469-5761 Toll: 203-369-1460 ||
- ID: 12820 Produced Video
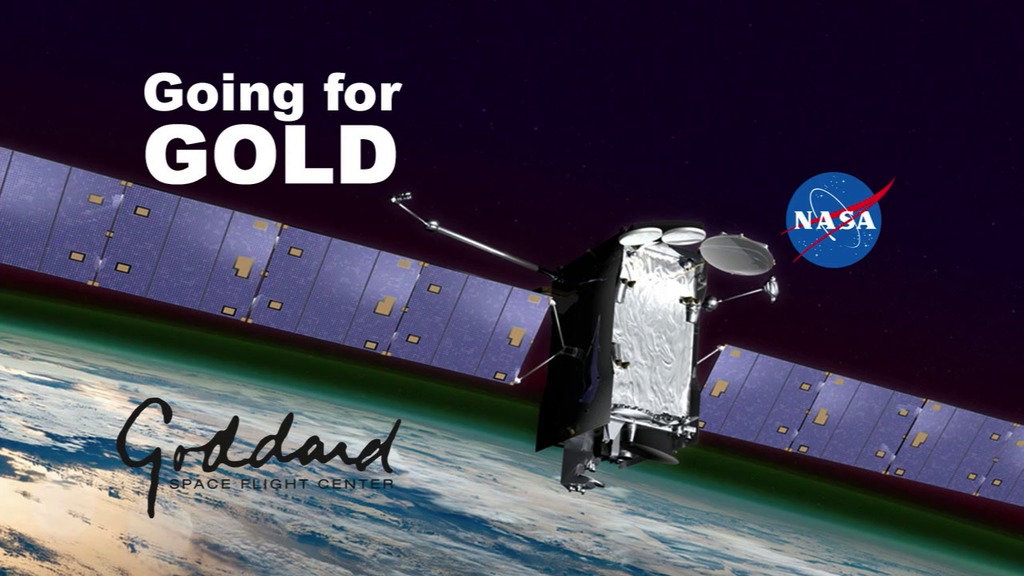
Going for GOLD: Exploring the Interface to Space
Go to this pageGoing for GOLD: Exploring the Interface to Space || 12820_GOLD_FB_Live.00001_print.jpg (1024x576) [125.3 KB] || 12820_GOLD_FB_Live.00001_searchweb.png (320x180) [84.7 KB] || 12820_GOLD_FB_Live.00001_thm.png (80x40) [6.6 KB] || 12820_GOLD_FB_Live.mp4 (1280x720) [5.1 GB] || 12820_GOLD_FB_Live.mov (1280x720) [41.9 GB] || 12820_GOLD_FB_Live.webm (960x540) [1.7 GB] || 12820_GOLD_FB_Live.en_US.srt [119.6 KB] || 12820_GOLD_FB_Live.en_US.vtt [112.9 KB] ||