GPM Outreach Event 2016
Overview
A presentation to the Museum Alliance and Solar System Ambassador Program. This event will feature a NASA scientist, two visualization specialists, and an education/communications specialist to bring you the latest on the science behind hurricanes and monsoons, as well as to share how NASA’s Global Precipitation Measurement mission is studying global precipitation.
Science on a Sphere: A Global Tour of Precipitation
- ID: 12126 Produced Video
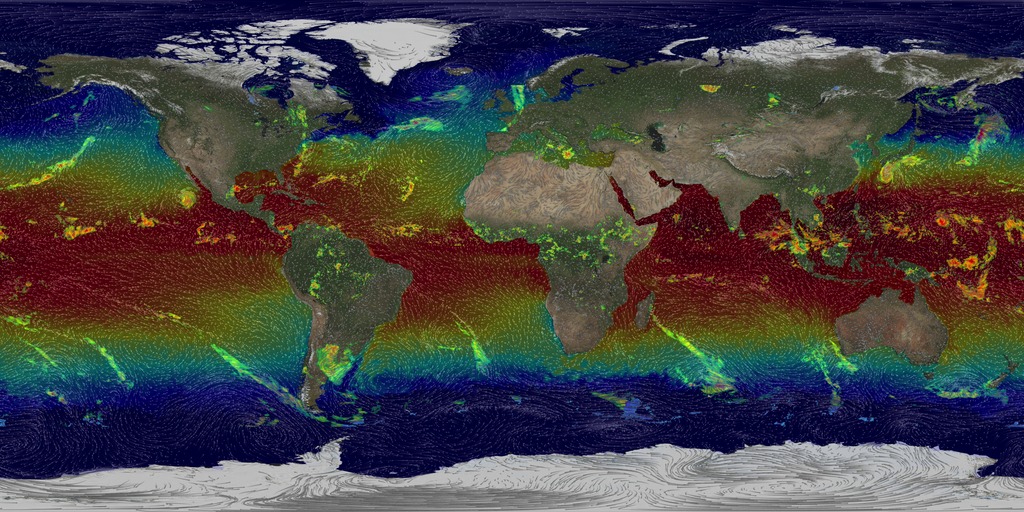
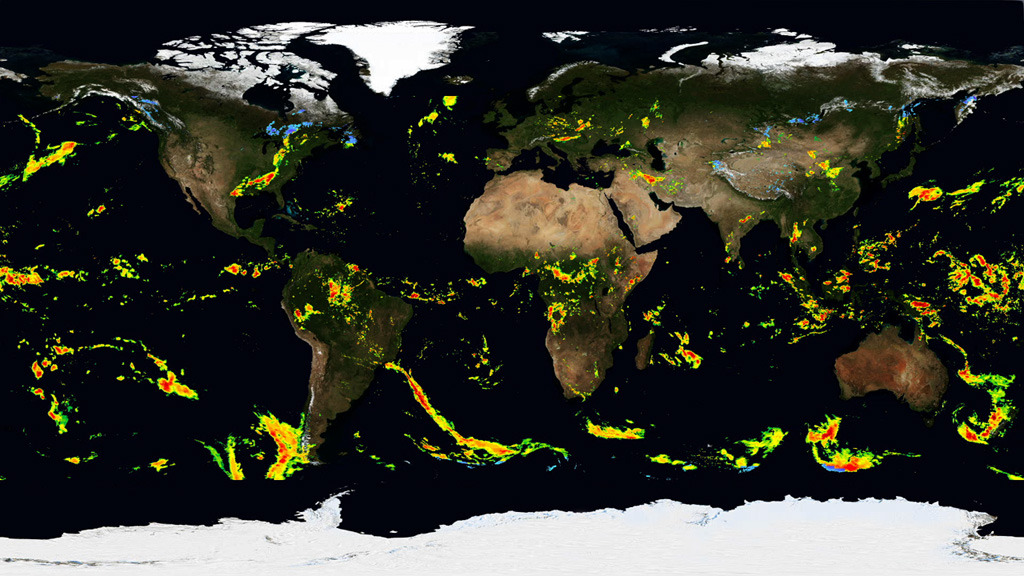
Science On a Sphere: A Global Tour of Precipitation from NASA
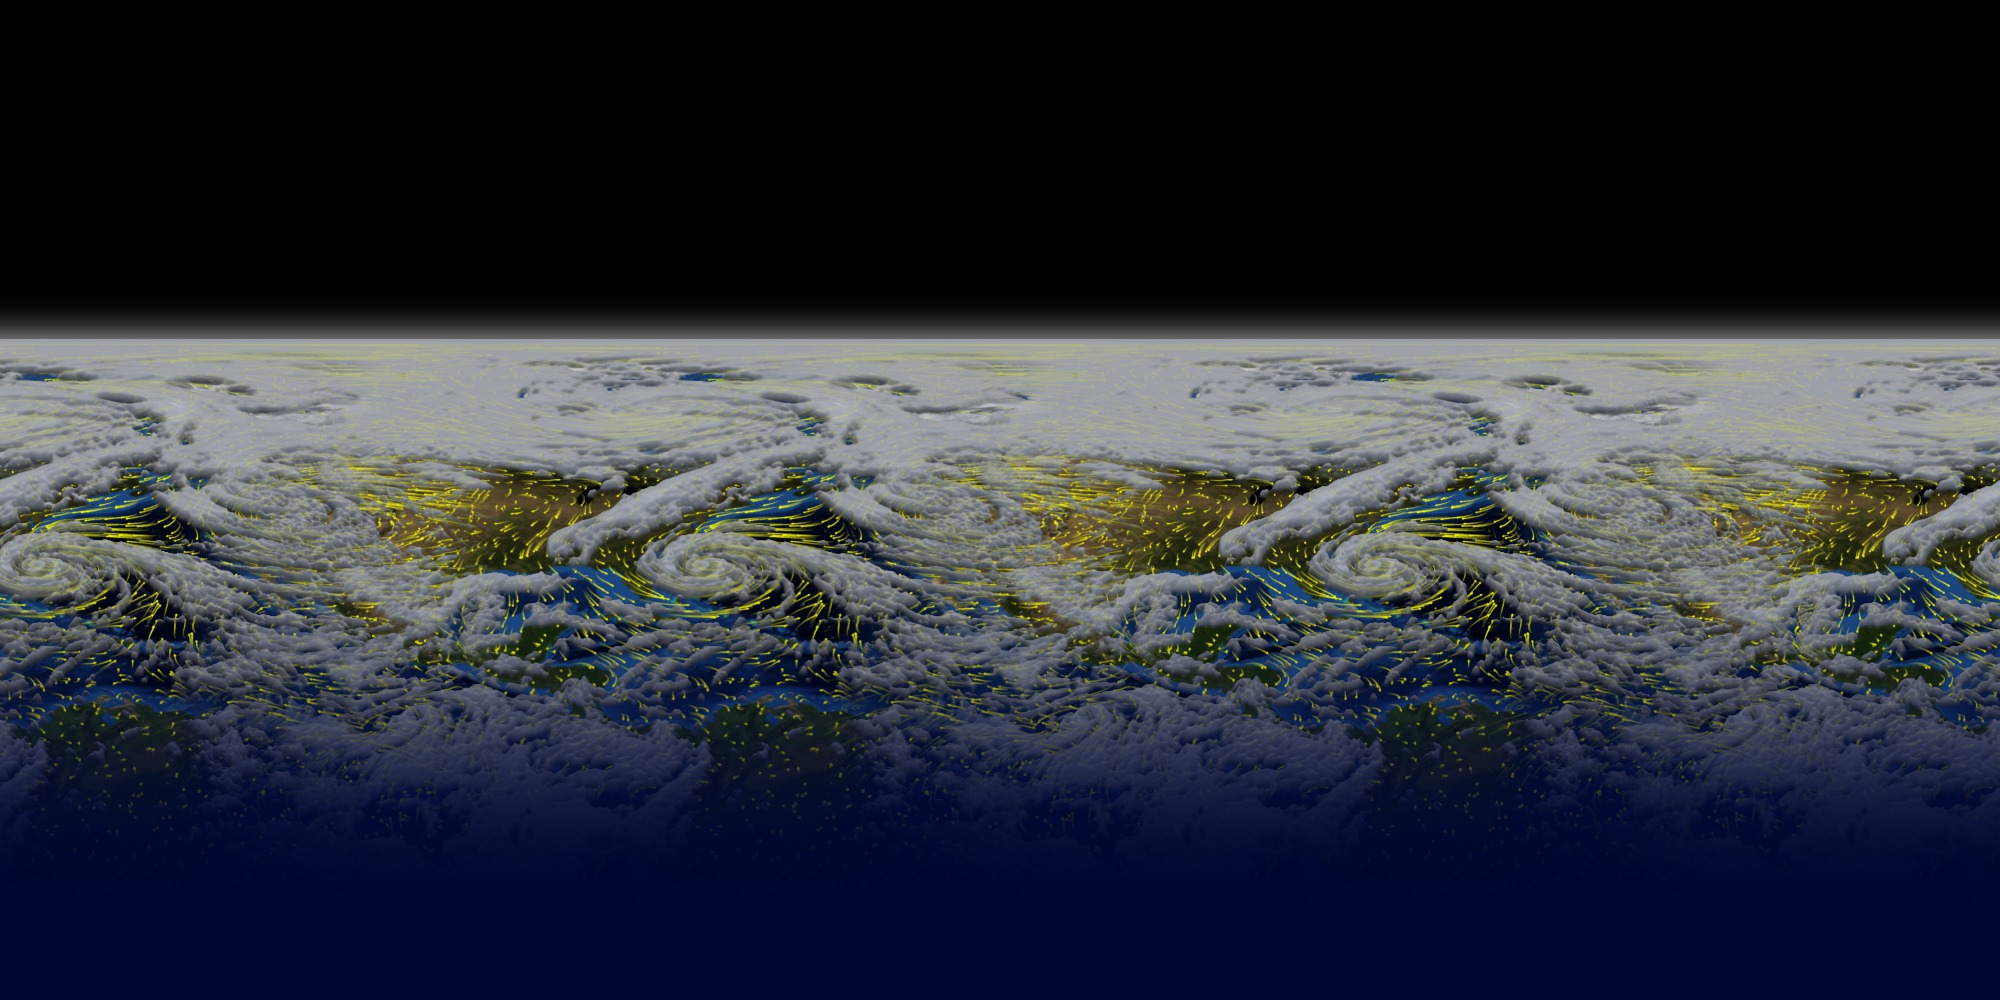
Go to this pagePrecipitation (falling rain and snow) is our fresh water reservoir in the sky and is fundamental to life on Earth. A Global Tour of Precipitation from NASA shows how rain and snowfall moves around the world from the vantage of space using measurements from the Global Precipitation Measurement Core Observatory, or GPM. This is a joint mission between NASA and the Japanese Aerospace Exploration Agency (JAXA) and offers the most detailed and worldwide view of rain and snowfall ever created.This narrated movie is created for Science On a Sphere, a platform designed by NOAA that displays movies on a spherical screen. Audiences can view the movie from any side of the sphere and can see any part of Earth. During this show viewers will be guided through a variety of precipitation patterns and display features such as the persistent band of the heaviest rainfall around the equator and tight swirls of tropical storms in the Northern Hemisphere. At subtropical latitudes in both hemispheres there are persistent dry areas and this is where most of the major deserts reside. Sea surface temperature and winds are also shown to highlight the interconnectedness of the Earth system. The movie concludes with near real-time global precipitation data from GPM, which is provided to Science On a Sphere roughly six hours after the observation.To download this movie formatted for a spherical screen, visit NOAA's official Science On a Sphere website below:• A Global Tour of Precipitation from NASA• Near Real-Time Global Precipitation Data ||
Monsoons
- ID: 12252 Produced Video
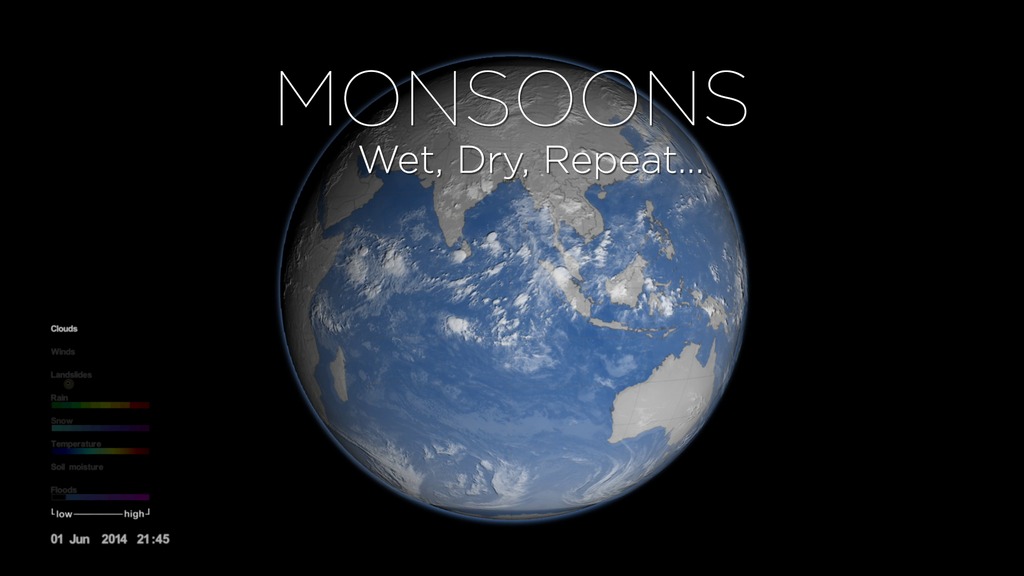
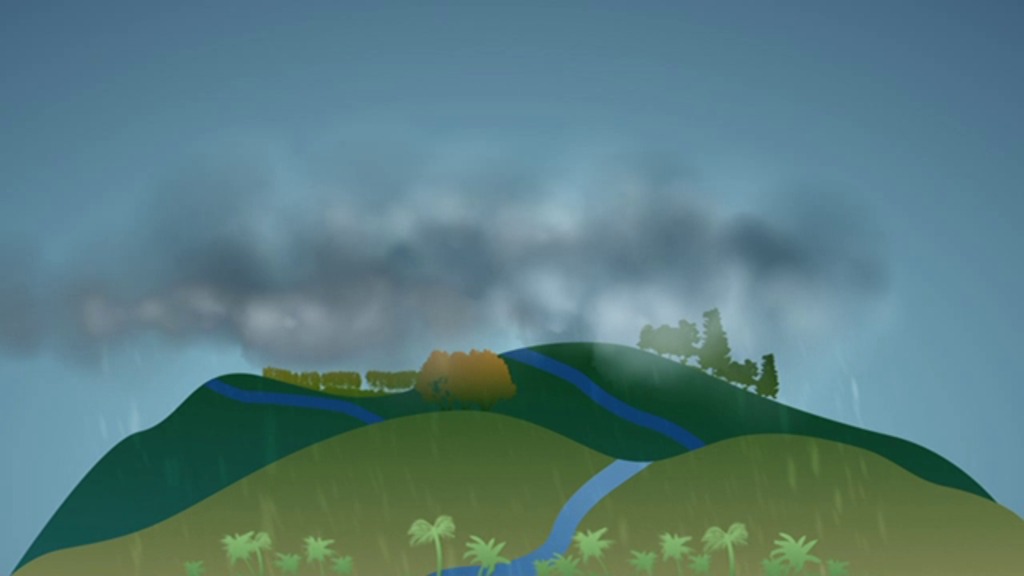
Monsoons: Wet, Dry, Repeat... Abridged Version
Go to this pageAn abridged version of "Monsoons: Wet, Dry, Repeat..."Complete transcript available.Music: Letting Go by Mario Lauer, 24 Dimensions by Christian Telford, David Travis Edwards, Matthew St. Laurent, and Robert Anthony Navarro || 12252_Monsoon_narr_abrg_youtube_hq.00190_print.jpg (1024x576) [73.1 KB] || 12252_Monsoon_narr_abrg_youtube_hq.00190_searchweb.png (320x180) [39.8 KB] || 12252_Monsoon_narr_abrg_youtube_hq.00190_thm.png (80x40) [3.6 KB] || 12252_Monsoon_narr_abrg.webm (960x540) [43.2 MB] || 12252_Monsoon_narr_abrg_ipod_sm.mp4 (320x240) [19.1 MB] || GSFC_20160516_GPM_m12252_Monsoon.en_US.srt [1.8 KB] || GSFC_20160516_GPM_m12252_Monsoon.en_US.vtt [1.8 KB] || 12252_Monsoon_narr_abrg.mov (1920x1080) [2.9 GB] || 12252_Monsoon_narr_abrg.mpeg (1280x720) [358.5 MB] || 12252_Monsoon_narr_abrg_youtube_hq.mov (1920x1080) [1.3 GB] || 12252_Monsoon_narr_abrg_large.mp4 (1920x1080) [108.2 MB] ||
- ID: 4285 Visualization
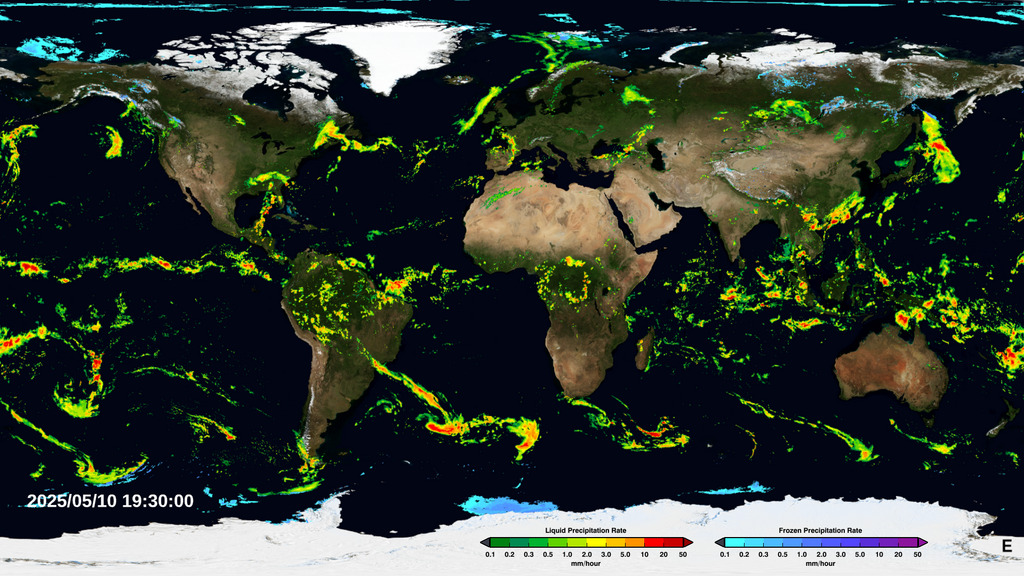
Near Real-Time Global Precipitation from the Global Precipitation Measurement Constellation
Go to this pageAn animation of the most currently available global precipitation data from IMERG.
Tropical Cyclones
- ID: 11635 Produced Video
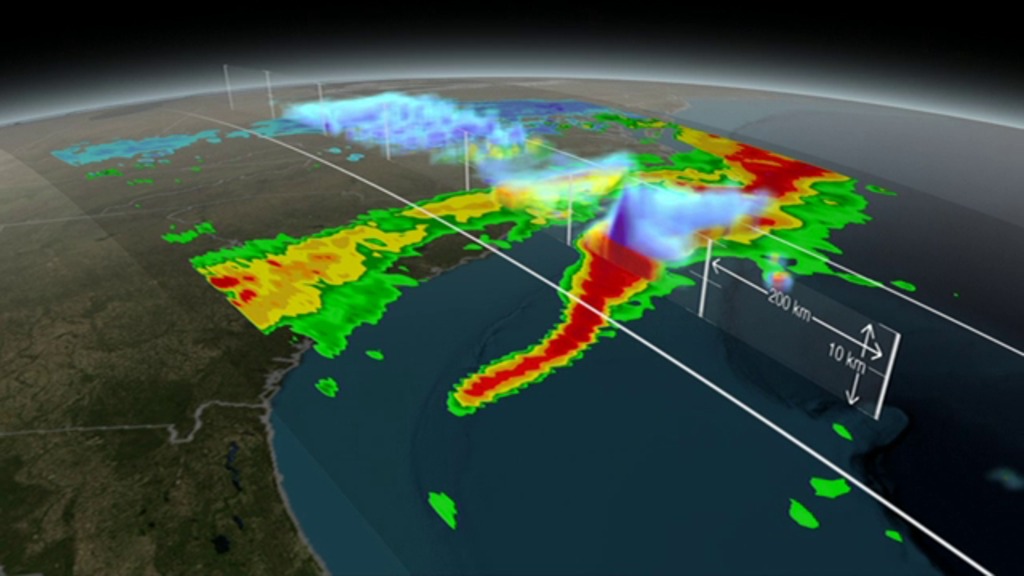
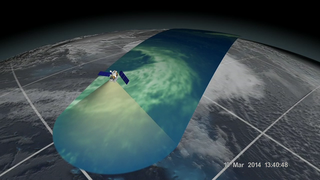
GPM Looks Inside a Snow Storm
Go to this pageOn March 17, 2014 the Global Precipitation Measurement (GPM) mission's Core Observatory flew over the East coast's last snow storm of the 2013-2014 winter season. This was also one of the first major snow storms observed by GPM shortly after it was launched on February 27, 2014.The GPM Core Observatory carries two instruments that show the location and intensity of rain and snow, which defines a crucial part of the storm structure – and how it will behave. The GPM Microwave Imager sees through the tops of clouds to observe how much and where precipitation occurs, and the Dual-frequency Precipitation Radar observes precise details of precipitation in 3-dimensions.For forecasters, GPM's microwave and radar data are part of the toolbox of satellite data, including other low Earth orbit and geostationary satellites, that they use to monitor tropical cyclones and hurricanes. ||
- ID: 12007 Produced Video
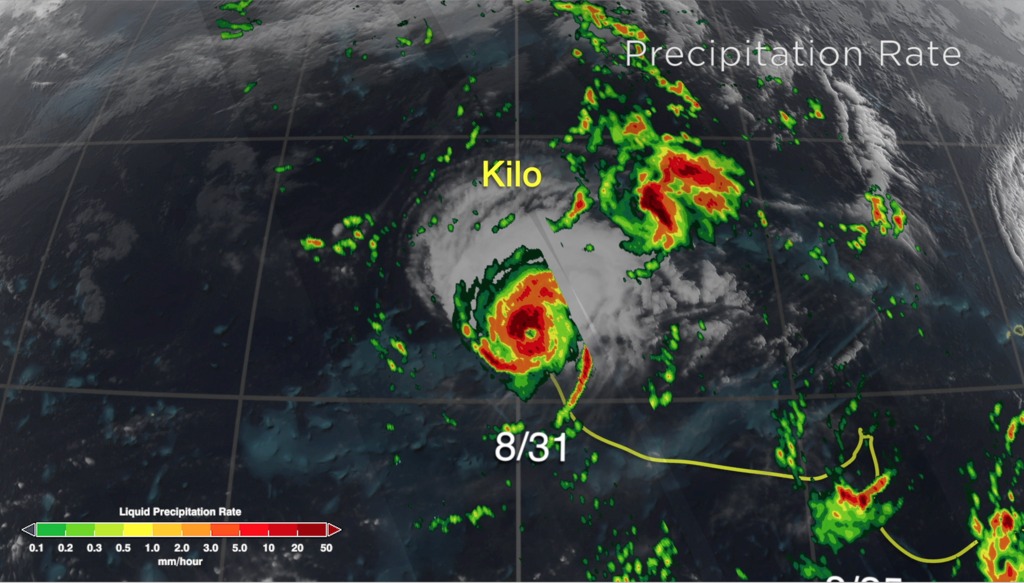
GPM Gets a Ton of Kilo
Go to this pageA narrated visualization of Hurricane/Typhoon Kilo.For complete transcript, click here. || Kilo_still_print.jpg (1024x583) [160.6 KB] || Kilo_still_searchweb.png (320x180) [110.8 KB] || Kilo_still_thm.png (80x40) [9.9 KB] || APPLE_TV_G2015-074_Kilo_master_appletv.m4v (1280x720) [48.5 MB] || WEBM_G2015-074_Kilo_master.webm (960x540) [42.5 MB] || APPLE_TV_G2015-074_Kilo_master_appletv_subtitles.m4v (1280x720) [48.5 MB] || YOUTUBE_HQ_Kilo_final_revised_youtube_hq.mov (1920x1080) [596.0 MB] || YOUTUBE_HQ_G2015-074_Kilo_master_youtube_hq.mov (1920x1080) [596.0 MB] || Kilo.en_US.srt [1.7 KB] || Kilo.en_US.vtt [1.7 KB] || NASA_PODCAST_G2015-074_Kilo_master_ipod_sm.mp4 (320x240) [17.3 MB] || G2015-074_Kilo_master_prores.mov (1920x1080) [2.8 GB] ||
- ID: 3773 Visualization
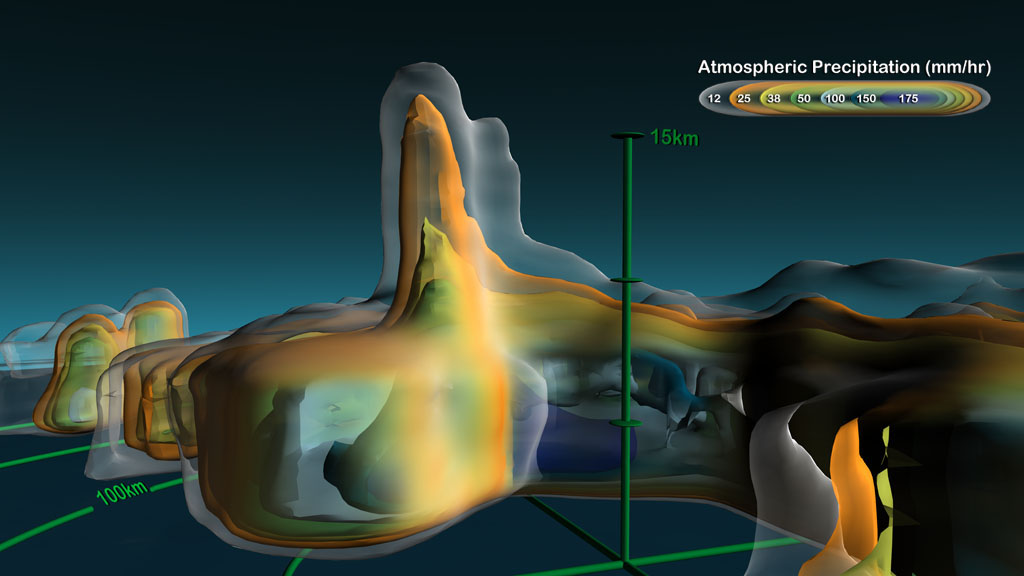
Towers In The Tempest
Go to this pageMassive accumulations of heat pulled from the top layers of tropical ocean water and set spinning due to planetary rotation form a hurricane's spiraling vortex. But powering the inside of these storms we find one of nature's most astounding natural engines: hot towers. Scientists discovered hot towers in recent years by observing storms from space and creating advanced supercomputer models to decipher how a hurricane sustains its winding movement. The models show that when air spirals inward toward the eye of a hurricane it collides with an unstable region of air at the eyewall, where the strongest winds are found, and suddenly deflects upwards. This rush of warm, moist air is accelerated by surrounding patches of convective clouds, called hot towers, which strengthen and propel the hurricane by keeping the vertical ring of clouds in motion. Watch the first video below as NASA researchers look under the hood of these cloud super-engines to reveal exciting findings about a hurricane's internal motor. ||
- ID: 4085 Visualization
Water Falls (Science On a Sphere show): Hurricane Sandy
Go to this pageHurricane Sandy segment for the GPM Science On a Sphere (SOS) show titled "Water Falls". The hurricane visualization is generated from GEOS-5 model output spanning October 26, 2012 to November 2, 2012 and repeated on the globe three times. ||
- ID: 11508 Produced Video
GPM GMI First Light
Go to this pageOn March 10, the Core Observatory passed over an extra-tropical cyclone about 1055 miles (1700 kilometers) due east of Japan's Honshu Island. This visualization shows data from the GPM Microwave Imager, which observes different types of precipitation with 13 channels. Scientists analyze that data and then use it to calculate the light to heavy rain rates and falling snow within the storm. ||
- ID: 11757 Produced Video
Seeing Beneath Earth’s Clouds
Go to this pageThis is what falling rain and snow look like from space. || cf-1920.jpg (1920x1080) [705.2 KB] || cf-1280.jpg (1280x720) [407.8 KB] || cf-1024.jpg (1024x576) [288.4 KB] || cf-1024_print.jpg (1024x576) [278.2 KB] || cf-1024_searchweb.png (320x180) [110.8 KB] || cf-1024_print_thm.png (80x40) [29.9 KB] ||
- ID: 12164 Produced Video
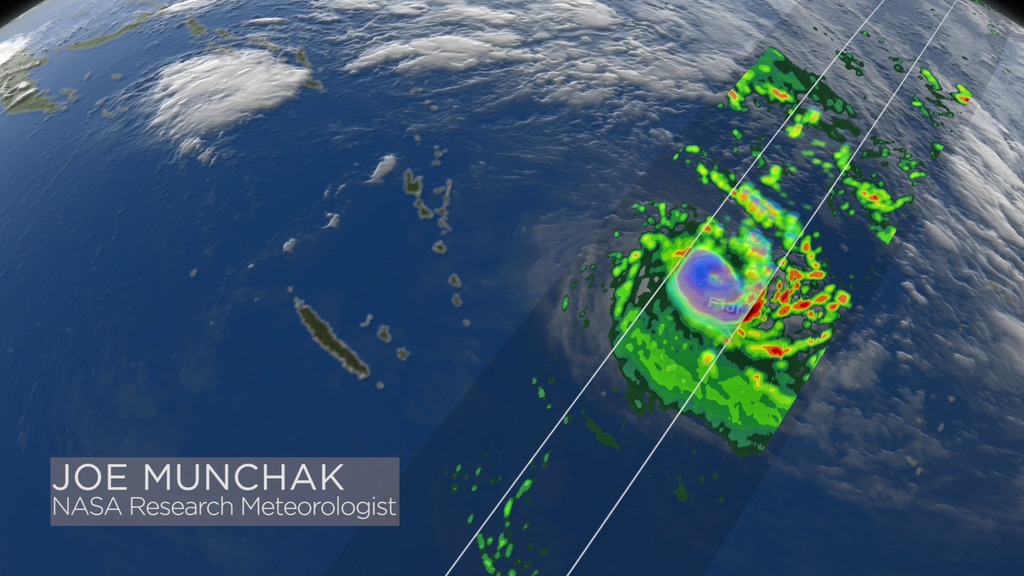
Winston Over Fiji
Go to this pageJoe Munchak describes the features of Tropical Cyclone Winston. || Winston_narrated_youtube_hq_print.jpg (1024x576) [145.7 KB] || Winston_narrated_youtube_hq_searchweb.png (320x180) [97.6 KB] || Winston_narrated_youtube_hq_thm.png (80x40) [6.5 KB] || LARGE_MP4_Winston_narrated_large.mp4 (1920x1080) [49.5 MB] || WEBM_Winston_narrated.webm (960x540) [19.8 MB] || Winston_narrated.mpeg (1280x720) [164.9 MB] || Winston_narrated_youtube_hq.mov (1920x1080) [195.6 MB] || Winston_narrated_prores.mov (1920x1080) [696.0 MB] || Winston.en_US.srt [831 bytes] || Winston.en_US.vtt [843 bytes] || Winston_narrated_ipod_sm.mp4 (320x240) [8.5 MB] ||
- ID: 12113 Produced Video
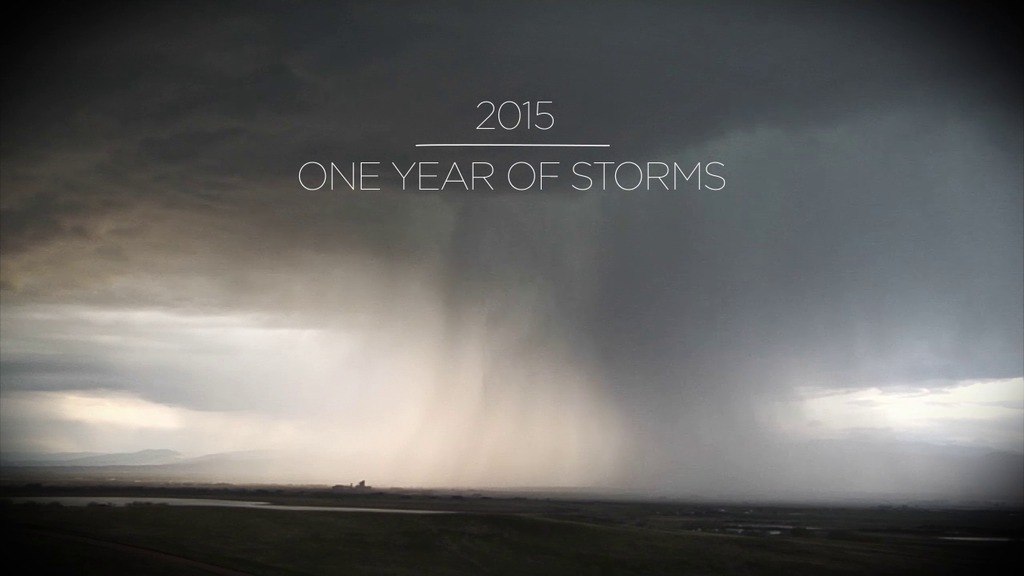
GPM 2015: One Year of Storms
Go to this pageA look back at the storms captured by GPM for 2015. || GPM_2015_Year_print.jpg (1024x576) [63.5 KB] || GPM_2015_Year_searchweb.png (320x180) [55.1 KB] || GPM_2015_Year_thm.png (80x40) [4.6 KB] || 12113_GPMYear2015_MASTER.mov (1280x720) [1.1 GB] || GPM_2015_Year.mp4 (1280x720) [163.0 MB] || 12113_GPMYear2015_MASTER.webm (1280x720) [17.2 MB] || 12113_GPMYear2015_MASTER.mpeg (1280x720) [539.6 MB] || 12113_GPMYear2015_MASTER_appletv.m4v (1280x720) [78.9 MB] || 12113_GPMYear2015_MASTER_large.mp4 (1280x720) [164.5 MB] || 12113_GPMYear2015_MASTER_appletv_subtitles.m4v (1280x720) [78.9 MB] || GPM_2015_Year.en_US.srt [1.3 KB] || GPM_2015_Year.en_US.vtt [1.4 KB] ||
More Precipitation Resources
- ID: 10989 Produced Video

GPM: The Fresh(water) Connection
Go to this pageThe Global Precipitation Measurement (GPM) is an international satellite mission to provide next-generation observations of rain and snow worldwide every three hours. NASA and the Japan Aerospace Exploration Agency (JAXA) will launch a "Core" satellite carrying advanced instruments that will set a new standard for precipitation measurements from space. The data they provide will be used to unify precipitation measurements made by an international network of partner satellites to quantify when, where, and how much it rains or snows around the world. The GPM mission will help advance our understanding of Earth's water and energy cycles, improve the forecasting of extreme events that cause natural disasters, and extend current capabilities of using satellite precipitation information to directly benefit society. ||
- ID: 40118 Gallery
Global Precipitation Measurement
Go to this pageThe Global Precipitation Measurement (GPM) mission is an international network of satellites that provide the next-generation global observations of rain and snow. Building upon the success of the Tropical Rainfall Measuring Mission (TRMM), the GPM concept centers on the deployment of a "Core" satellite carrying an advanced radar / radiometer system to measure precipitation from space and serve as a reference standard to unify precipitation measurements from a constellation of research and operational satellites. Through improved measurements of precipitation globally, the GPM mission helps to advance our understanding of Earth's water and energy cycle, improve forecasting of extreme events that cause natural hazards and disasters, and extend current capabilities in using accurate and timely information of precipitation to directly benefit society. GPM, initiated by NASA and the Japan Aerospace Exploration Agency (JAXA) as a global successor to TRMM, comprises a consortium of international space agencies, including the Centre National d'Études Spatiales (CNES), the Indian Space Research Organization (ISRO), the National Oceanic and Atmospheric Administration (NOAA), the European Organization for the Exploitation of Meteorological Satellites (EUMETSAT), and others. The GPM Core Observatory launched from Tanegashima Space Center, Japan, at 1:37 PM EST on February 27, 2014.For more information and resources please visit the Precipitation Measurement Missions web site.
- ID: 11288 Produced Video
Anatomy of a Raindrop
Go to this pageThis short video explains how a raindrop falls through the atmosphere and why a more accurate look at raindrops can improve estimates of global precipitation.For a printable droplet hand out click here. ||
- ID: 11619 Produced Video
Water Falls: Show Me the Water
Go to this pageThis is a spinoff video for the Science On a Sphere film, "Water Falls." ||
- ID: 11219 Produced Video

GPM: For Good Measure
Go to this pageThe need for measuring the when and where and how much of precipitation goes beyond our weekend plans. We also need to know precipitaiton on a global scale. Rain gauges and radars are useful but are inconsistent and do not cover enough of the globe to provide accurate precipitation rates. The GPM constellation will cover the globe and give us a more comprehensive look at precipitation. ||
- ID: 12182 Produced Video

Why Do Raindrop Sizes Matter In Storms?
Go to this pageNot all raindrops are created equal. The size of falling raindrops depends on several factors, including where the cloud producing the drops is located on the globe and where the drops originate in the cloud. For the first time, scientists have three-dimensional snapshots of raindrops and snowflakes around the world from space, thanks to the joint NASA and Japan Aerospace Exploration Agency Global Precipitation Measurement (GPM) mission. With the new global data on raindrop and snowflake sizes this mission provides, scientists can improve rainfall estimates from satellite data and in numerical weather forecast models, helping us better understand and prepare for extreme weather events.Watch this video on the NASA Goddard YouTube Channel. ||