Fires
Visualizations
- ID: 4945 Visualization
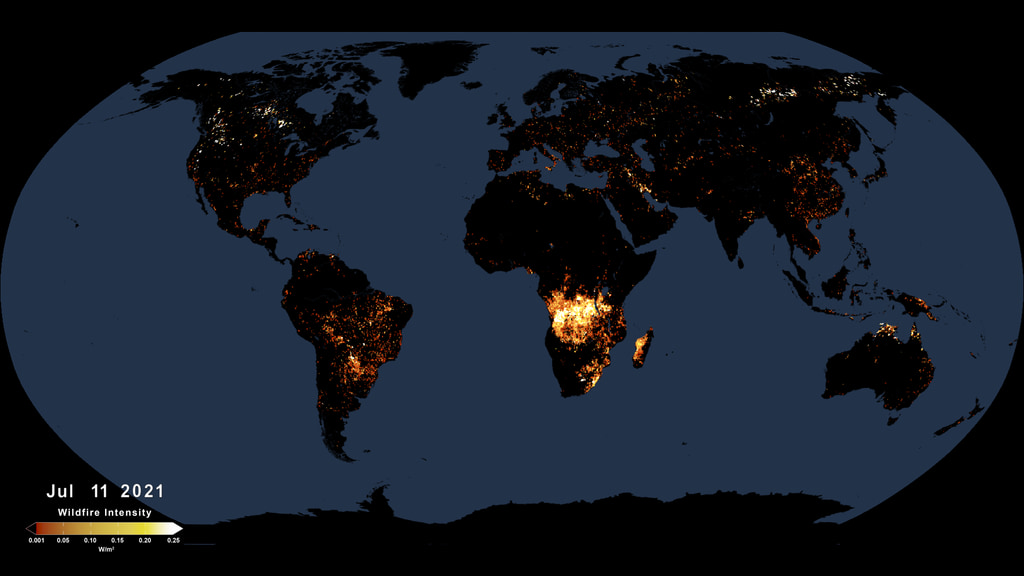
Active Fires As Observed by VIIRS, January-September 2021
Go to this pageThis animated visualization uses a moving three-day average of summed VIIRS measurments of fire radiative power (FRP), to present a view of fire intensities around the globe. || 2021_wildfire_intensity.1000_print.jpg (1024x576) [122.0 KB] || 2021_wildfire_intensity.1000_searchweb.png (320x180) [44.8 KB] || 2021_wildfire_intensity.1000_thm.png (80x40) [11.2 KB] || 2021_wildfire_intensity (1920x1080) [0 Item(s)] || 2021_wildfire_intensity_1080p30.mp4 (1920x1080) [18.9 MB] || 2021_wildfire_intensity_1080p30.webm (1920x1080) [5.5 MB] ||
- ID: 4729 Visualization
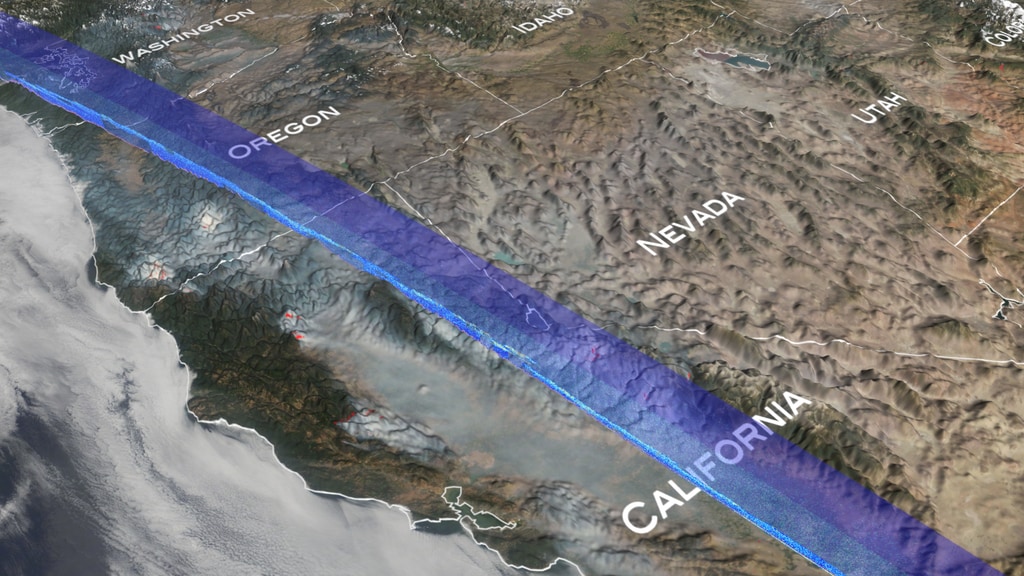
FIREX-AQ Prelaunch Data Visualization
Go to this pageThis data visualization starts with an overview of the United States west coast. As we zoom into several California wildfires, MODIS data dissolves in to show some of the low-lying smoke resulting from these fires. The camera then pans across the United States, slowly revealing CALIPSO swath passes as they dissect the atmosphere. Throughout most of the journey CALIPSO picks up many aerosol signatures as shown in the more opaque portions of the curtain. || firex_comp2.0400_print.jpg (1024x576) [167.7 KB] || firex_comp2.0400_searchweb.png (320x180) [119.9 KB] || firex_comp2.0400_thm.png (80x40) [7.4 KB] || 1920x1080_16x9_30p (1920x1080) [0 Item(s)] || firex_comp2_1080p30.webm (1920x1080) [12.0 MB] || firex_comp2_1080p30.mp4 (1920x1080) [100.7 MB] || firex_comp2_1080p30.mp4.hwshow [185 bytes] ||
- ID: 4728 Visualization
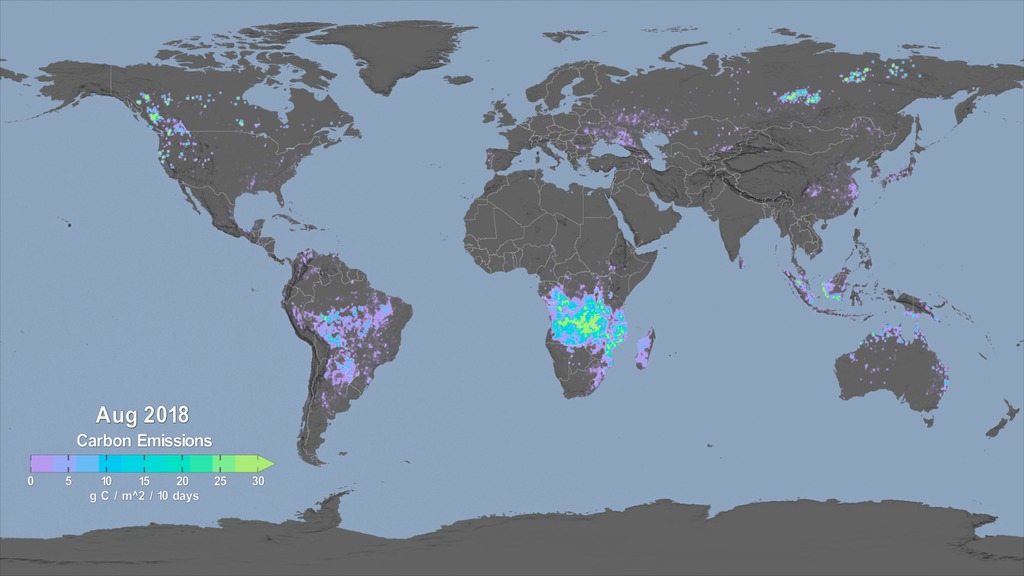
Carbon Emissions from Fires: 2003 - 2018
Go to this pageThis visualization shows carbon emissions from fires from January 1, 2003 through December 31, 2018. The colorbar reflects the quantity of carbon emitted. || carbonEmissions_wDate.1687_print.jpg (1024x576) [98.0 KB] || carbonEmissions_wDate.1687_searchweb.png (320x180) [57.2 KB] || carbonEmissions_wDate.1687_thm.png (80x40) [5.4 KB] || carbonEmissions_wDate_1080p30.mp4 (1920x1080) [37.4 MB] || carbonEmission_comp (1920x1080) [0 Item(s)] || carbonEmissions_wDate_1080p30.webm (1920x1080) [6.8 MB] || carbonEmissions_wDate_1080p30.mp4.hwshow [230 bytes] ||
- ID: 4093 Visualization
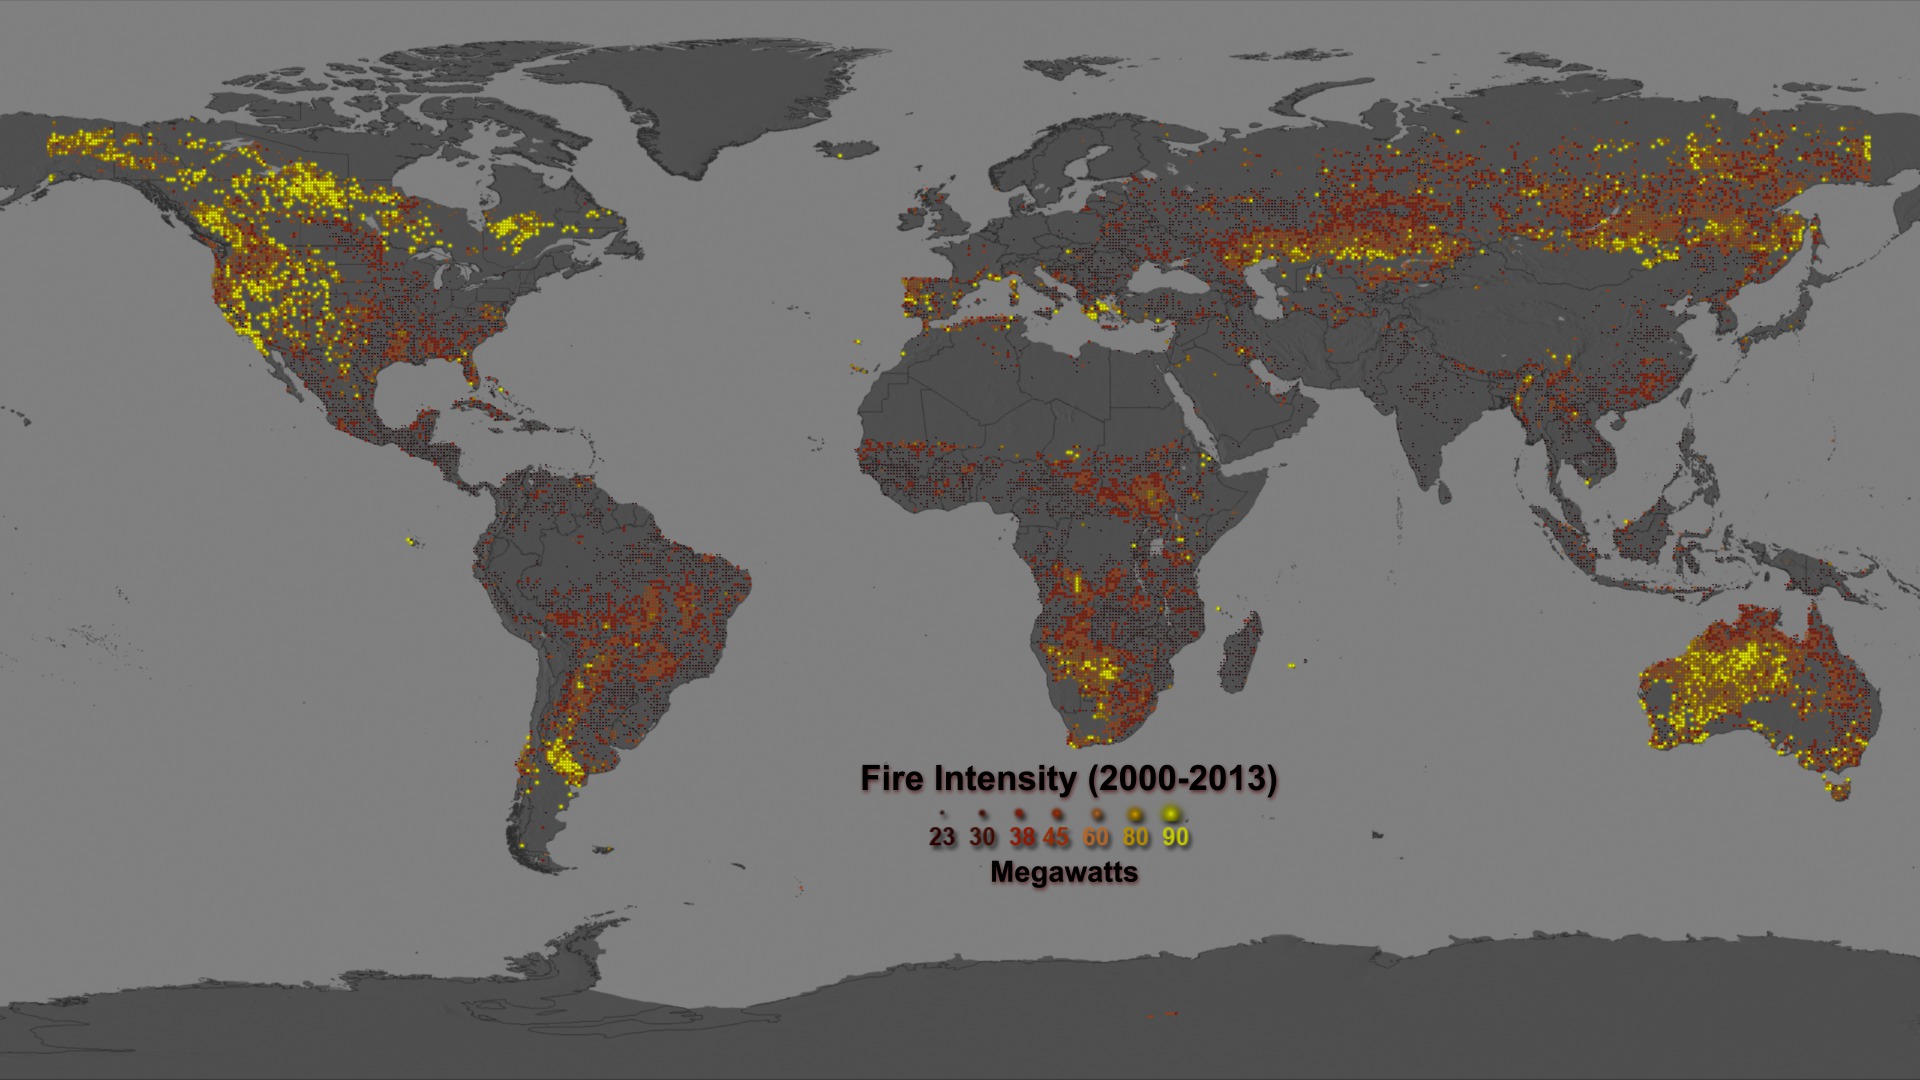
Mapping the Fire Intensity Global Record (2000 through 2013)
Go to this pageThis visualization displays the MODIS Climate Modeling Grid (CMG) Mean Fire Radiative Power (FRP). The CMG fire products incorporate MODIS active fire data into gridded statistical summaries of fire pixel information intended for use in regional and global modeling. The products are currently generated at 0.5 degree spatial resolution. Many of the lower intensity fires shown in red were prescribed fires, lit for either agricultural or ecosystem management purposes. Orange indicates fires that were more intense with the most intense FRP being shown in yellow. Notice, many of the most intense fires occurred in higher latitudes. ||
- ID: 4899 Visualization
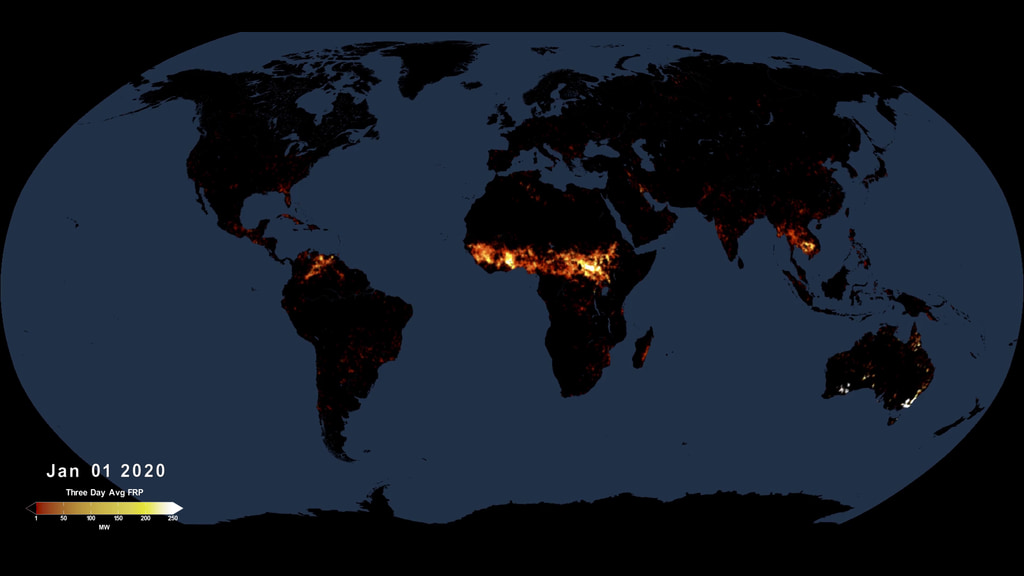
Active Fires As Observed by VIIRS, 2020
Go to this pageThis animated visualization uses a moving three-day average of measured fire radiative power (FRP), summing the 375 m resolution data into one-quarter degree bins, to present a view of fire intensities around the globe. || fires__2020_robinson.00001_print.jpg (1024x576) [69.5 KB] || fires__2020_robinson.00001_searchweb.png (320x180) [34.5 KB] || fires__2020_robinson.00001_thm.png (80x40) [4.4 KB] || fires__2020_robinson.webm (1920x1080) [5.3 MB] || fires__2020_robinson.mp4 (1920x1080) [86.7 MB] || fires__2020_robinson.mp4.hwshow [186 bytes] ||
- ID: 31103 Hyperwall Visual
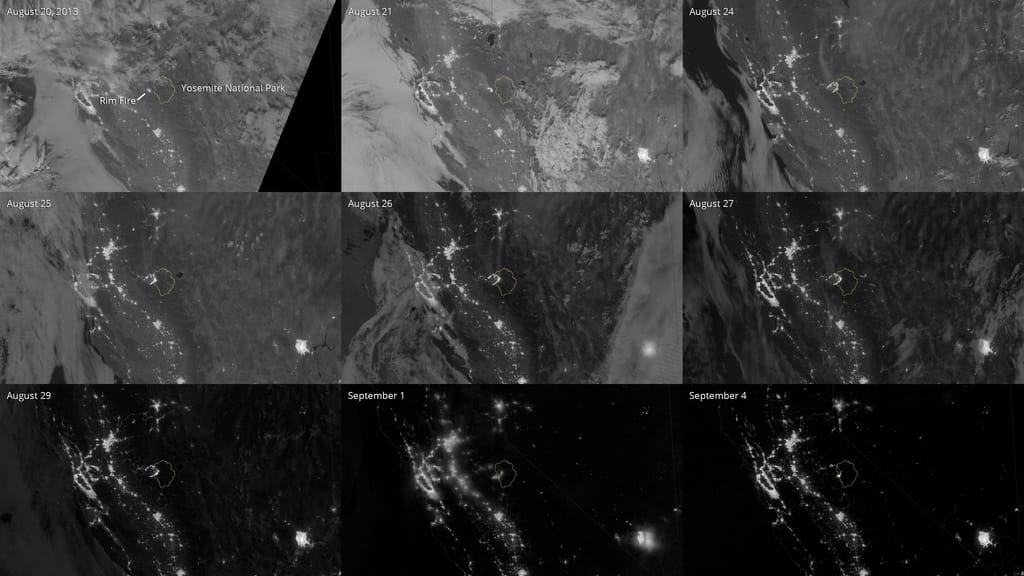
2013 Rim Fire
Go to this pageRim Fire progression || rimfire_mantage_print.jpg (1024x576) [66.3 KB] || rimfire_mantage.jpg (3840x2160) [1.2 MB] || rimfire_mantage_searchweb.png (320x180) [57.9 KB] || rimfire_mantage_thm.png (80x40) [4.6 KB] ||
- ID: 31106 Hyperwall Visual
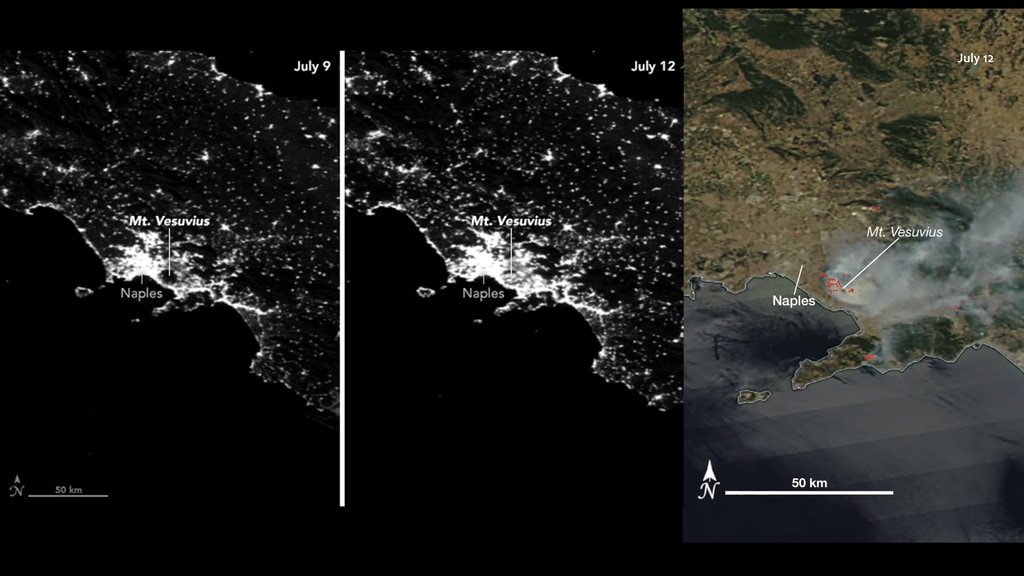
Fires Light Up Mount Vesuvius
Go to this pageWildfires on Mount Vesuvius || volcano-vesuvius_print.jpg (1024x576) [98.9 KB] || volcano-vesuvius.png (3840x2160) [3.5 MB] || volcano-vesuvius_searchweb.png (320x180) [66.4 KB] || volcano-vesuvius_thm.png (80x40) [5.3 KB] || fires-light-up-mount-vesuvius.hwshow [285 bytes] ||
- ID: 31100 Hyperwall Visual
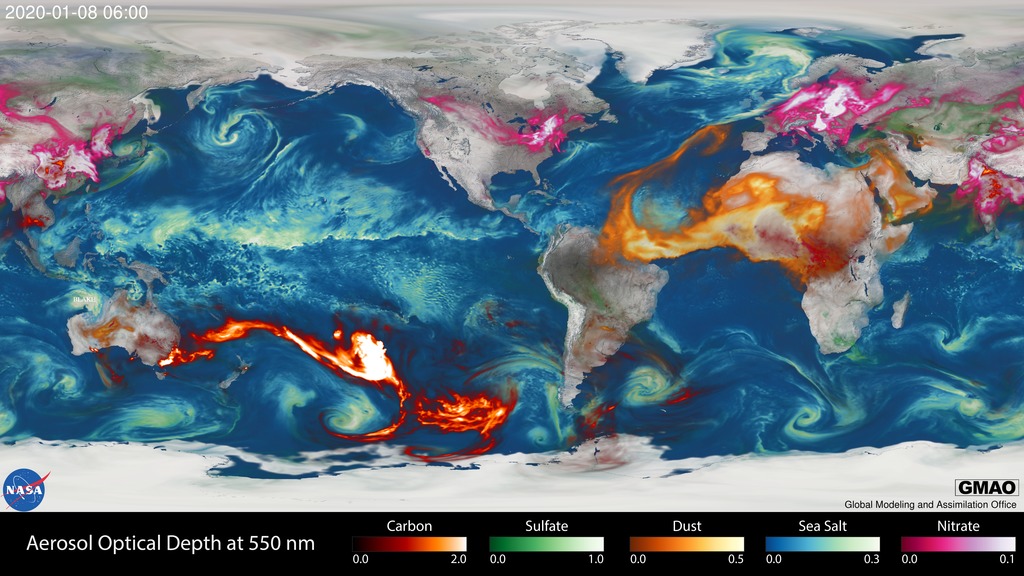
Global Transport of Smoke from Australian Bushfires
Go to this pageAnimation of global aerosols from August 1, 2019 to January 29, 2020 || australia_fire_smoke_print.jpg (1024x576) [184.6 KB] || australia_fire_smoke.png (3840x2160) [8.2 MB] || australia_fire_smoke_searchweb.png (180x320) [104.5 KB] || australia_fire_smoke_thm.png (80x40) [7.7 KB] || australia_fire_smoke_720p.webm (1280x720) [11.3 MB] || australia_fire_smoke_1080p.mp4 (1920x1080) [228.5 MB] || AerosolFrames (10080x5043) [0 Item(s)] || AerosolFrames (5760x3240) [0 Item(s)] || australia_fire_smoke_2160p.mp4 (3840x2160) [688.8 MB] ||
- ID: 12772 Produced Video
![Tracking aerosols over land and water from August 1 to November 1, 2017. Hurricanes and tropical storms are obvious from the large amounts of sea salt particles caught up in their swirling winds. The dust blowing off the Sahara, however, gets caught by water droplets and is rained out of the storm system. Smoke from the massive fires in the Pacific Northwest region of North America are blown across the Atlantic to the UK and Europe. This visualization is a result of combining NASA satellite data with sophisticated mathematical models that describe the underlying physical processes.Music: Elapsing Time by Christian Telford [ASCAP], Robert Anthony Navarro [ASCAP]Complete transcript available.Watch this video on the NASA Goddard YouTube channel.](/vis/a010000/a012700/a012772/12772_hurricanes_and_aerosols_1080p_youtube_1080.00001_print.jpg)
2017 Hurricanes and Aerosols Simulation
Go to this pageTracking aerosols over land and water from August 1 to November 1, 2017. Hurricanes and tropical storms are obvious from the large amounts of sea salt particles caught up in their swirling winds. The dust blowing off the Sahara, however, gets caught by water droplets and is rained out of the storm system. Smoke from the massive fires in the Pacific Northwest region of North America are blown across the Atlantic to the UK and Europe. This visualization is a result of combining NASA satellite data with sophisticated mathematical models that describe the underlying physical processes.Music: Elapsing Time by Christian Telford [ASCAP], Robert Anthony Navarro [ASCAP]Complete transcript available.Watch this video on the NASA Goddard YouTube channel. || 12772_hurricanes_and_aerosols_1080p_youtube_1080.00001_print.jpg (1024x576) [161.7 KB] || 12772_hurricanes_and_aerosols_1080p_youtube_1080.00001_searchweb.png (180x320) [108.8 KB] || 12772_hurricanes_and_aerosols_1080p_youtube_1080.00001_thm.png (80x40) [7.5 KB] || 12772_hurricanes_and_aerosols_appletv.m4v (1280x720) [78.1 MB] || 12772_hurricanes_and_aerosols_twitter_720.mp4 (1280x720) [34.1 MB] || 12772_hurricanes_and_aerosols.webm (960x540) [65.0 MB] || 12772_hurricanes_and_aerosols_appletv_subtitles.m4v (1280x720) [78.1 MB] || 12772_hurricanes_and_aerosols_1080p_large.mp4 (1920x1080) [163.1 MB] || 12772_hurricanes_and_aerosols_facebook_720.mp4 (1280x720) [184.9 MB] || 12772_hurricanes_and_aerosols_youtube_1080.mp4 (1920x1080) [247.2 MB] || 12772_hurricanes_and_aerosols_youtube_720.mp4 (1280x720) [247.9 MB] || 12772_hurricanes_aerosols_captions.en_US.srt [3.1 KB] || 12772_hurricanes_aerosols_captions.en_US.vtt [3.1 KB] || 12772_hurricanes_and_aerosols_UHD.mp4 (3840x2160) [739.9 MB] || 12772_hurricanes_and_aerosols_1080p-prores.mov (1920x1080) [4.3 GB] || 12772_hurricanes_and_aerosols_UHD_4444.mov (3840x2160) [40.1 GB] ||
- ID: 4861 Visualization
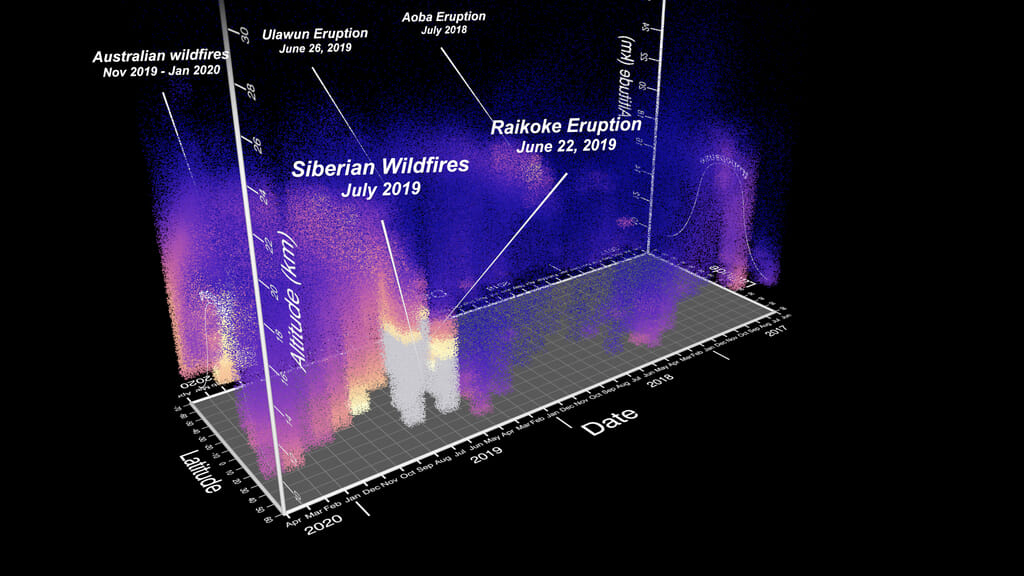
Three years of SAGE III/ISS Stratospheric Aerosol Data
Go to this pageAbout three years of stratospheric aerosol data from SAGE III visualizing a zonal mean and measurements of various high aerosol events across the globe || sage3_final_full_60fps.7300_print.jpg (1024x576) [98.9 KB] || sage3_final_full_60fps.7300_searchweb.png (320x180) [57.4 KB] || sage3_final_full_60fps.7300_thm.png (80x40) [4.4 KB] || sage3_final_full_1080p59.94.webm (1920x1080) [25.5 MB] || orig (3840x2160) [1.0 MB] || sage3_final_full_1080p59.94.mp4 (1920x1080) [234.0 MB] || sage3_final_full_2160p59.94.mp4 (3840x2160) [1.0 GB] ||
Produced videos
- ID: 13257 Produced Video
Through Smoke and Fire, NASA Searches for Answers
Go to this pageMusic: End of the Quarter by Austin JordanComplete transcript available. || Fires_Kickoff_Thumbnail.png (1920x1080) [3.0 MB] || Fires_Kickoff_Thumbnail_print.jpg (1024x576) [97.9 KB] || Fires_Kickoff_Thumbnail_searchweb.png (320x180) [101.6 KB] || Fires_Kickoff_Thumbnail_thm.png (80x40) [6.4 KB] || Fires_Kickoff_V1.mov (1920x1080) [673.6 MB] || Fires_Kickoff_V2.mp4 (1920x1080) [51.1 MB] || Fires_Kickoff_V1.webm (1920x1080) [5.8 MB] || Fires_Kickoff_V2.en_US.srt [767 bytes] || Fires_Kickoff_V2.en_US.vtt [779 bytes] ||
- ID: 13652 Produced Video
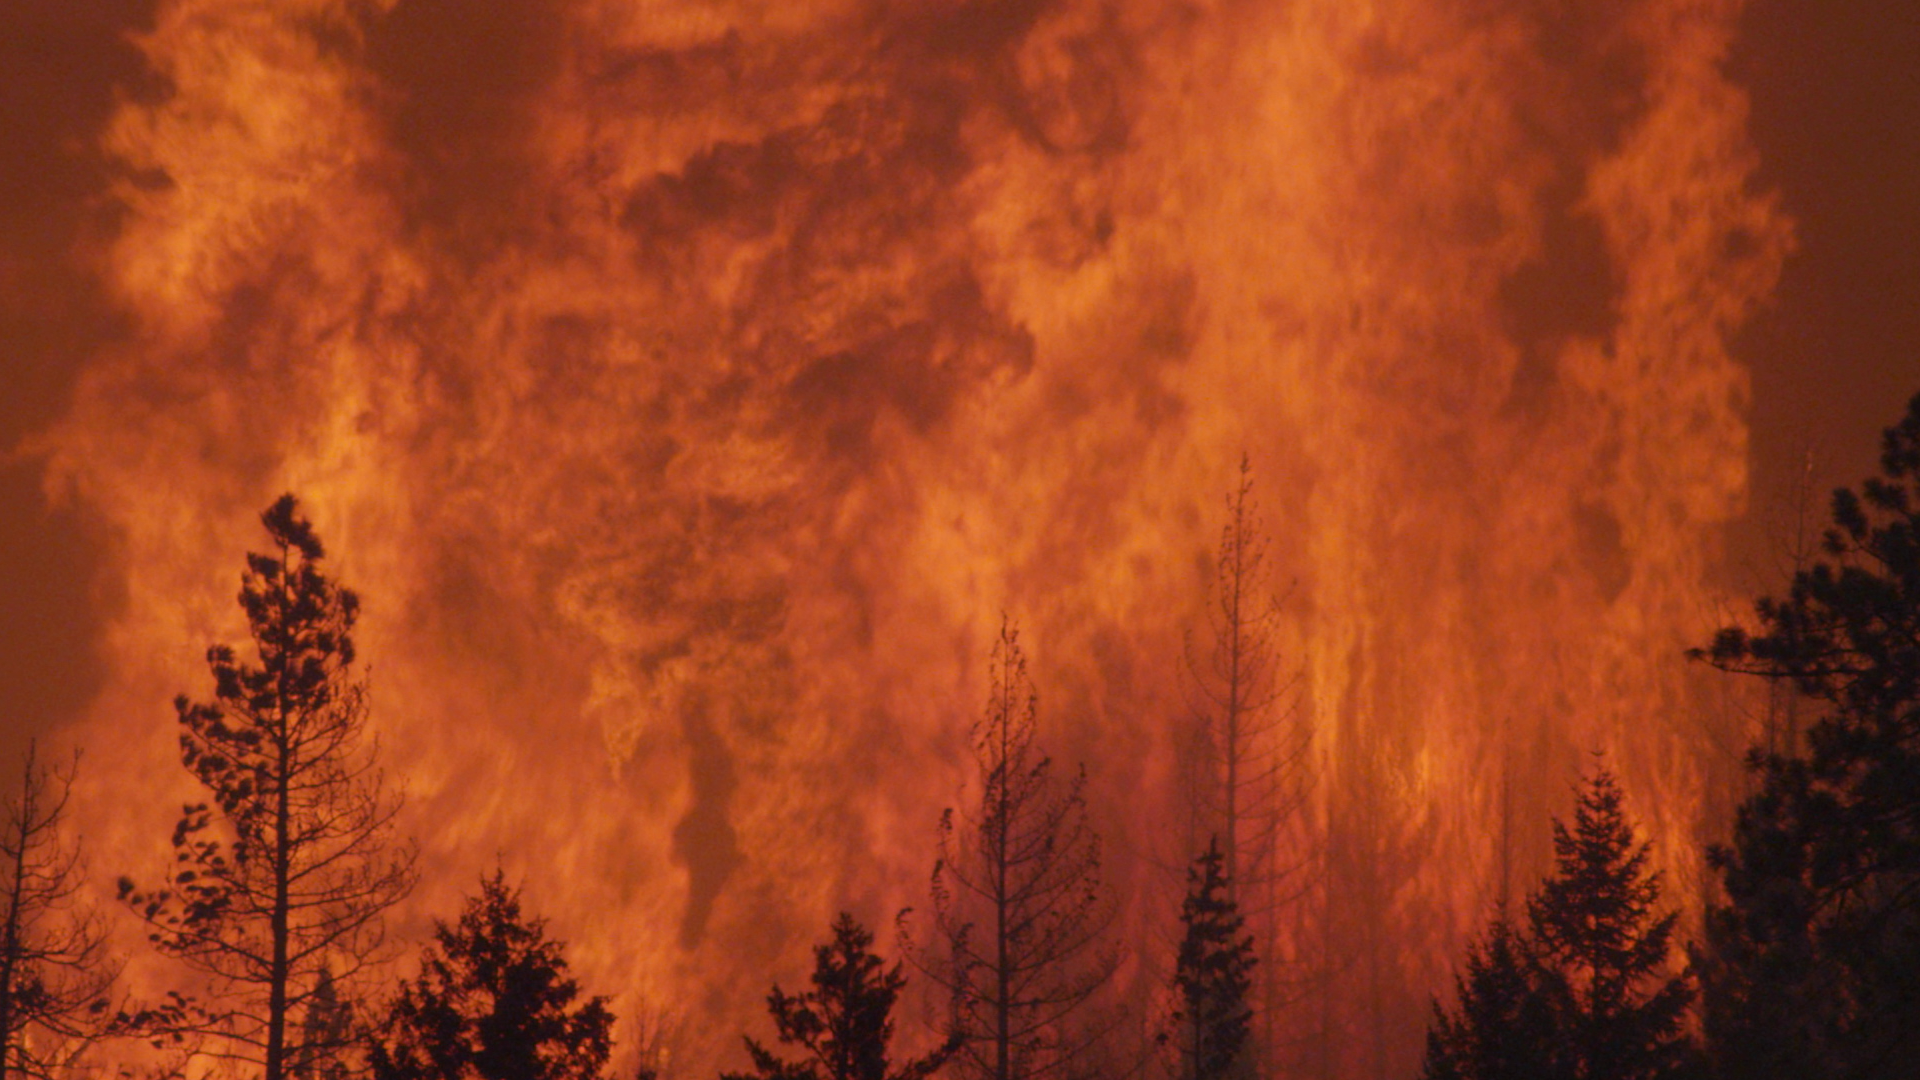
![Music: "Solar Winds" by Ben Niblett [PRS] and Jon Cotton [PRS] courtesy of Universal Production Music.
Complete transcript available.](/vis/a010000/a013600/a013652/BushFire_Still_2.jpg)
NASA Tracks the Arizona Bush Fire
Go to this pageMusic: "Solar Winds" by Ben Niblett [PRS] and Jon Cotton [PRS] courtesy of Universal Production Music.Complete transcript available. || BushFire_Still_2.jpg (1920x1080) [680.7 KB] || BushFire_Image.jpg (1920x1080) [917.4 KB] || BushFire_Still_2_print.jpg (1024x576) [255.9 KB] || BushFire_Still_2_searchweb.png (320x180) [84.2 KB] || BushFire_Still_2_web.png (320x180) [84.2 KB] || BushFire_Still_2_thm.png (80x40) [7.7 KB] || 13652_BushFire_Final.mov (1920x1080) [3.7 GB] || 13652_BushFire_Final.mp4 (1920x1080) [211.7 MB] || 13652_BushFire_Final.webm (960x540) [46.5 MB] || BushFire.en_US.srt [2.3 KB] || BushFire.en_US.vtt [2.3 KB] ||
- ID: 13262 Produced Video
![Music: Broad Horizons by Chris White [PRS]Complete transcript available.](/vis/a010000/a013200/a013262/Still.png)
NASA and NOAA Take to the Air to Chase Smoke
Go to this pageMusic: Broad Horizons by Chris White [PRS]Complete transcript available. || Still.png (1773x995) [3.3 MB] || Still_print.jpg (1024x574) [163.4 KB] || Still_searchweb.png (320x180) [119.4 KB] || Still_thm.png (80x40) [7.0 KB] || TWITTER_720_13692_FIREExKickoff_twitter_720.mp4 (1280x720) [27.0 MB] || 13692_FIREExKickoff.webm (960x540) [44.5 MB] || 13262_FIREExKickoff.mov (1920x1080) [1.4 GB] || YOUTUBE_1080_13692_FIREExKickoff_youtube_1080.mp4 (1920x1080) [207.3 MB] || 13262_FIREEx.en_US.srt [2.9 KB] || 13262_FIREEx.en_US.vtt [2.9 KB] ||