Earth
ID: 4688
Jakobshavn Glacier is Greenland's largest and fastest moving glacier. Over the last 20 years, the glacier, known in Greenlandic as Sermeq Kujalleq, has retreated, sped up and thinned. The data shown here reveal that Jakobshavn’s retreat has reversed. Between 2016 and 2018, the glacier advanced and got thicker. Scientists from NASA’s Jet Propulsion Laboratory have linked these changes to cooling of the ocean waters that reach Jakobshavn after traveling around the southern tip of Greenland and reaching into Disko Bay. (See the science paper here) The ocean cooling was likely related to the natural cycles of warming and cooling that happen in the Atlantic as part of the North Atlantic Oscillation. The strong influence of the ocean on the ice loss from Jakboshavn is somewhat surprising because the role of the ocean has been unclear since the glacier’s floating extension, called an ice tongue, disintegrated in 2003. These results mean that future projections of sea level rise will also need to account for the ocean changes in order to accurately predict how fast Greenland’s ice will melt in a warming climate.
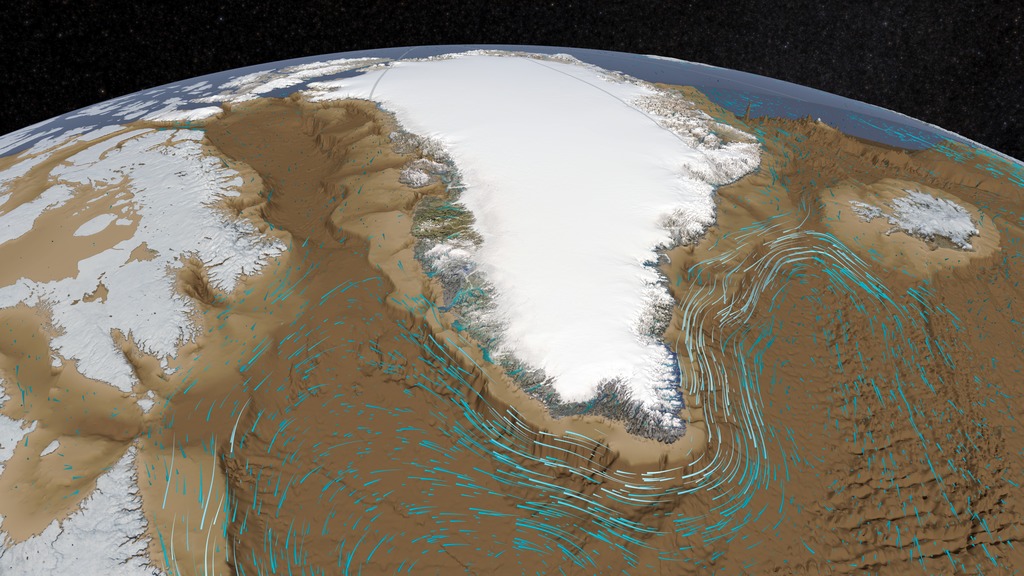
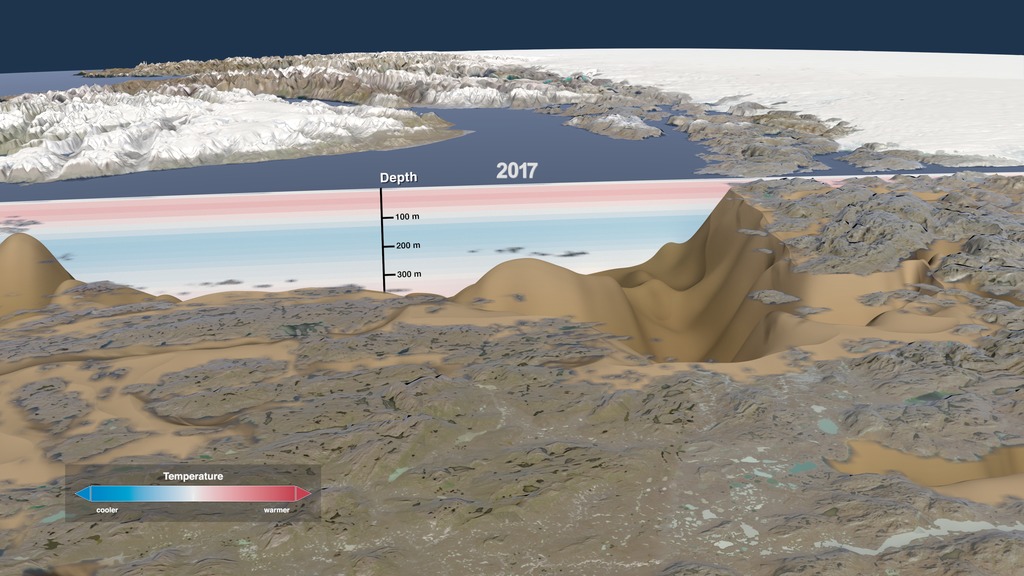
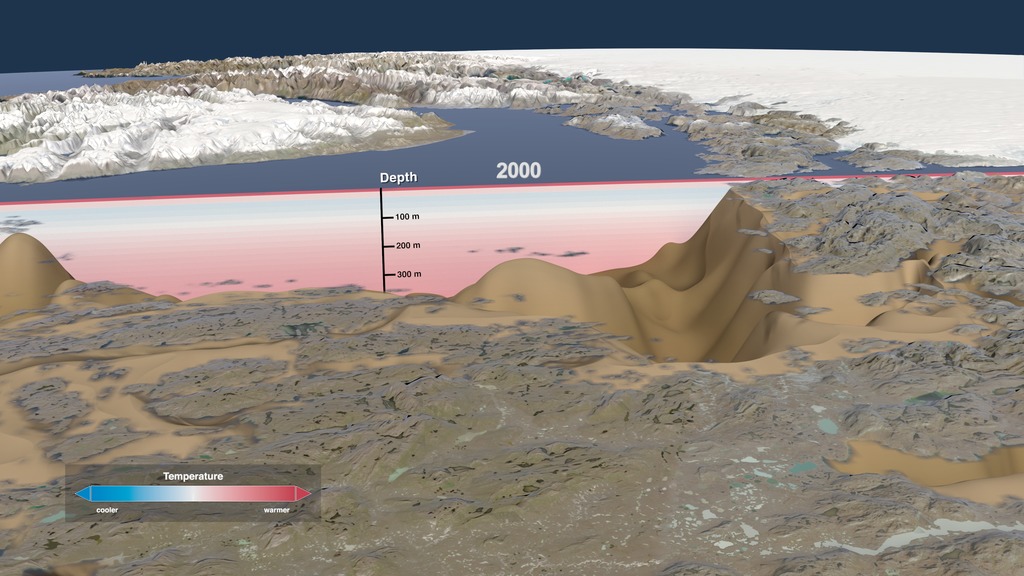
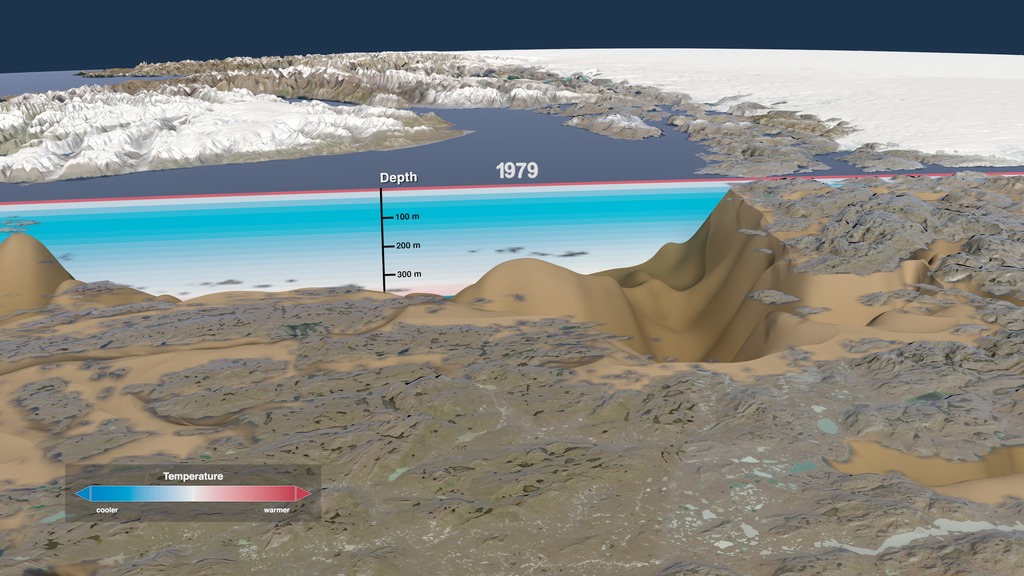
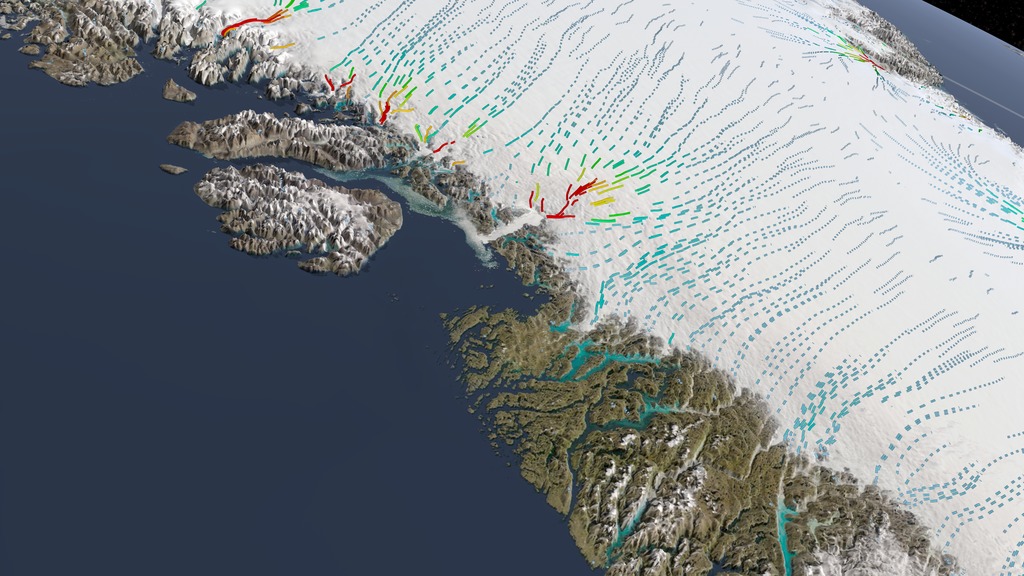
This visualization shows a variety of data from the oceans and ice to help explain why Jakobshavn glacier grew thicker and advanced between 2016 and 2017. Initially, the average flow of ice across the Greenland Ice Sheet in these years is shown as colored flow arrows, with blue shades indicating slower movement and red indicating faster. As we draw near we see a large bay named Disko Bay located just to the west of the narrow inlet, or fjord, that is home to Jakobshavn glacier. The water is cut away to reveal the historical temperature of the bay, to a depth of about 400 meters. Around Greenland, water below 150 m depth tends to be warmer than water near the surface. The change in temperature between 1952 and 2017 is shown using blue tones for colder water and red tones for warmer. The deep water warms through most of the 1990s, but cools dramatically after 2015. The ocean temperature changes are shown a second time, with a brief pause on 1979 to see the initial cooler water temperature, 2000 to view the warming and 2017 to view the current cooling trend.
The visualization pulls out to show the entire Greenland Ice Sheet while ocean is drained to reveal the shape and depth of the ocean floor around the ice sheet. Data from the ECCO ocean circulation model shows ocean currents carrying water around the southern tip of Greenland and up the west coast, where it eventually enters Disko Bay and reaches Jakboshavn glacier.
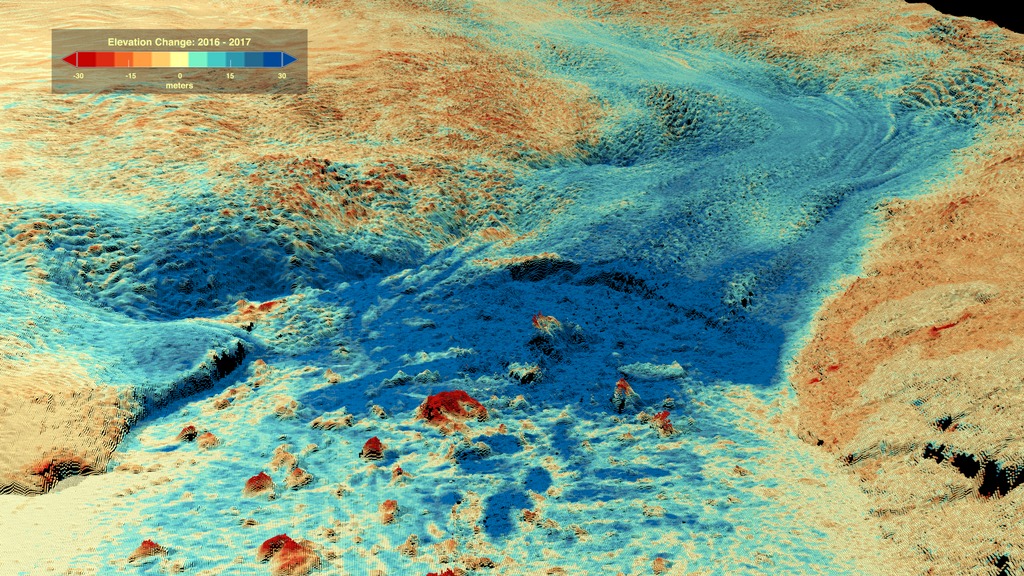
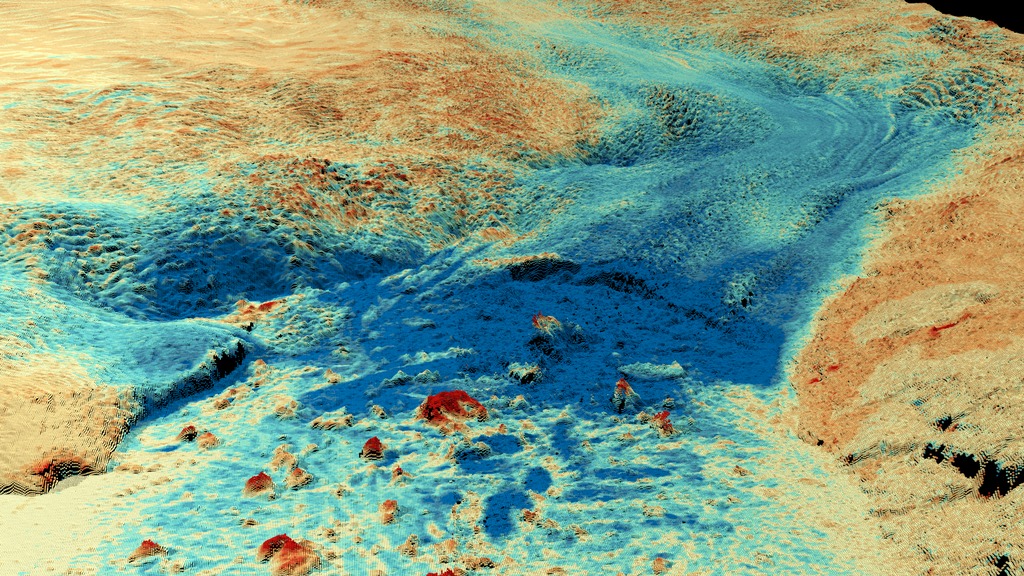
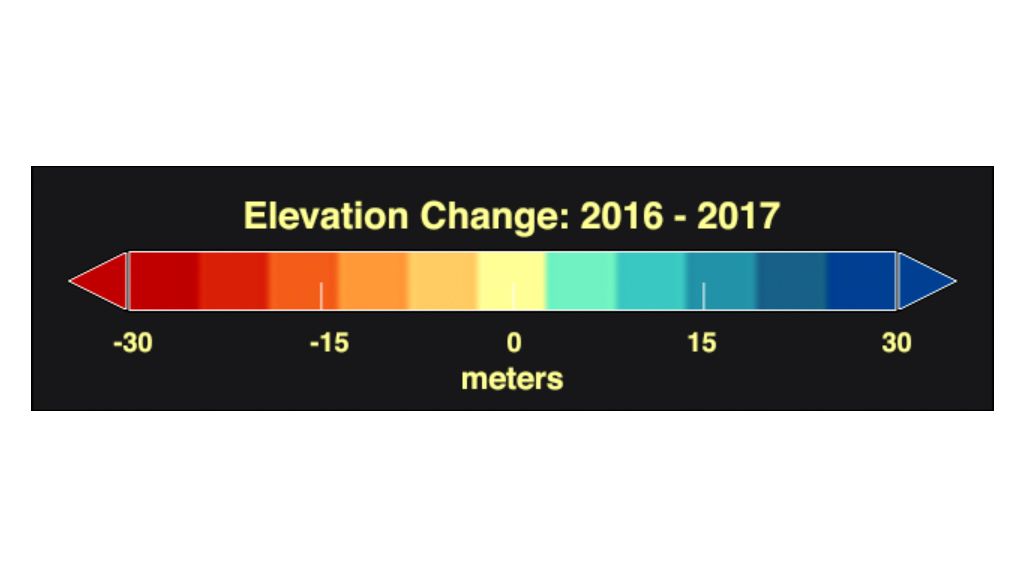
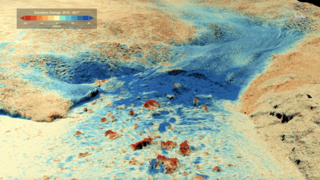
When we zoom in to the Jakobshavn glacier again, we see the glacier is blanketed by more than 40,000 radar observations. These data show the change in elevation between 2016 and 2017 as measured by an aircraft. These elevation changes are colored so that blue colors indicate an rise in the elevation and orange/red colors indicate a fall. The deepest blue color reflects the advance of the glacier from the 2016 front, appearing in the video as a shaded cliff, to its more advanced location in 2017. Farther downstream in the fjord the patches of blue and red show icebergs, which have detached from the front.
Jakobshavn's Interrupted Thinning Explained
This visualization shows a variety of data from the oceans and ice to help explain why Jakobshavn glacier grew thicker and advanced between 2016 and 2017. Initially, the average flow of ice across the Greenland Ice Sheet in these years is shown as colored flow arrows, with blue shades indicating slower movement and red indicating faster. As we draw near we see a large bay named Disko Bay located just to the west of the narrow inlet, or fjord, that is home to Jakobshavn glacier. The water is cut away to reveal the historical temperature of the bay, to a depth of about 400 meters. Around Greenland, water below 150 m depth tends to be warmer than water near the surface. The change in temperature between 1952 and 2017 is shown using blue tones for colder water and red tones for warmer. The deep water warms through most of the 1990s, but cools dramatically after 2015. The ocean temperature changes are shown a second time, with a brief pause on 1979 to see the initial cooler water temperature, 2000 to view the warming and 2017 to view the current cooling trend.
The visualization pulls out to show the entire Greenland Ice Sheet while ocean is drained to reveal the shape and depth of the ocean floor around the ice sheet. Data from the ECCO ocean circulation model shows ocean currents carrying water around the southern tip of Greenland and up the west coast, where it eventually enters Disko Bay and reaches Jakboshavn glacier.
When we zoom in to the Jakobshavn glacier again, we see the glacier is blanketed by more than 40,000 radar observations. These data show the change in elevation between 2016 and 2017 as measured by an aircraft. These elevation changes are colored so that blue colors indicate an rise in the elevation and orange/red colors indicate a fall. The deepest blue color reflects the advance of the glacier from the 2016 front, appearing in the video as a shaded cliff, to its more advanced location in 2017. Farther downstream in the fjord the patches of blue and red show icebergs, which have detached from the front.
Used Elsewhere In
Visualization Credits
Lead Visualizer:
Cindy Starr (Global Science and Technology, Inc.)
Visualizers:
Horace Mitchell (NASA/GSFC)
Greg Shirah (NASA/GSFC)
Scientists:
Josh Willis (JPL)
Ala Khazendar (JPL)
Ian Fenty (JPL)
Producer:
Kathryn Mersmann (USRA)
Project Support:
Joycelyn Thomson Jones (NASA/GSFC)
Leann Johnson (Global Science and Technology, Inc.)
Eric Sokolowsky (Global Science and Technology, Inc.)
Technical Support:
Laurence Schuler (ADNET Systems, Inc.)
Ian Jones (ADNET Systems, Inc.)
Please give credit for this item to:
NASA's Scientific Visualization Studio
Ocean Temperature data from NASA’s Oceans Melting Greenland (OMG) Mission and ICES Dataset on Ocean Hydrography
The maps of elevation change are derived from data collected by the Airborne Glacier and Land Ice Surface Topography Interferometer
Ice Sheet velocity from MEaSUREs Greenland Ice Sheet Velocity Map from InSAR Data
Science Paper:
Jakobshavn’s 20 years of Acceleration and Thinning Interrupted by Regional Ocean Cooling, Ala Khazendar, et al. http://dx.doi.org/10.1038/s41561-019-0329-3
Short URL to share this page:
https://svs.gsfc.nasa.gov/4688
Data Used:
Note: While we identify the data sets used in these visualizations, we do not store any further details nor the data sets themselves on our site.
Keywords:
SVS >> HDTV
GCMD >> Earth Science >> Cryosphere >> Glaciers/Ice Sheets
GCMD >> Earth Science >> Hydrosphere >> Glaciers/Ice Sheets
GCMD >> Earth Science >> Cryosphere >> Glaciers/Ice Sheets >> Glacier Elevation/Ice Sheet Elevation
GCMD >> Earth Science >> Cryosphere >> Glaciers/Ice Sheets >> Glacier Motion/Ice Sheet Motion
GCMD >> Earth Science >> Cryosphere >> Glaciers/Ice Sheets >> Glacier Thickness/Ice Sheet Thickness
GCMD >> Earth Science >> Cryosphere >> Glaciers/Ice Sheets >> Glaciers
GCMD >> Earth Science >> Hydrosphere >> Glaciers/Ice Sheets >> Glacier Elevation/Ice Sheet Elevation
GCMD >> Earth Science >> Hydrosphere >> Glaciers/Ice Sheets >> Glacier Thickness/Ice Sheet Thickness
GCMD >> Location >> Greenland
SVS >> Jakobshavn
SVS >> Hyperwall
NASA Science >> Earth
GCMD >> Earth Science >> Terrestrial Hydrosphere >> Glaciers/ice Sheets >> Glacier Elevation/ice Sheet Elevation
GCMD >> Earth Science >> Terrestrial Hydrosphere >> Glaciers/ice Sheets >> Glacier Motion/ice Sheet Motion
GCMD >> Earth Science >> Terrestrial Hydrosphere >> Glaciers/ice Sheets >> Glaciers
GCMD keywords can be found on the Internet with the following citation: Olsen, L.M., G. Major, K. Shein, J. Scialdone, S. Ritz, T. Stevens, M. Morahan, A. Aleman, R. Vogel, S. Leicester, H. Weir, M. Meaux, S. Grebas, C.Solomon, M. Holland, T. Northcutt, R. A. Restrepo, R. Bilodeau, 2013. NASA/Global Change Master Directory (GCMD) Earth Science Keywords. Version 8.0.0.0.0
Jakobshavn’s 20 years of Acceleration and Thinning Interrupted by Regional Ocean Cooling, Ala Khazendar, et al. http://dx.doi.org/10.1038/s41561-019-0329-3
Short URL to share this page:
https://svs.gsfc.nasa.gov/4688
Data Used:
Terra and Aqua/MODIS/Blue Marble: Next Generation also referred to as: BMNG
2004
Credit:
The Blue Marble data is courtesy of Reto Stockli (NASA/GSFC).
The Blue Marble data is courtesy of Reto Stockli (NASA/GSFC).
SHIZUKU (GCOM-W1)/AMSR2/10 km Daily Sea Ice Concentration
Observed Data - Japan Aerospace Exploration Agency - 09/15/2015 - 10/15/2015
Credit:
AMSR2 data courtesy of the Japan Aerospace Exploration Agency (JAXA).
AMSR2 data courtesy of the Japan Aerospace Exploration Agency (JAXA).
SHIZUKU (GCOM-W1)/AMSR2/10 km Daily 89 GHz Brightness Temperature
Observed Data - Japan Aerospace Exploration Agency - 09/15/2015 - 10/15/2015
Credit:
AMSR2 data courtesy of the Japan Aerospace Exploration Agency (JAXA).
AMSR2 data courtesy of the Japan Aerospace Exploration Agency (JAXA).
TERRA/MODIS/MODIS Mosaic of Greenland (MOG) Image Map
MosaicBedMachine V3: Bed Topography and Ocean Bathymetry of Greenland also referred to as: BedMachine V3: Bed Topography and Ocean Bathymetry of Greenland
Data Compilation - 2017
A new compilation of Greenland bed topography that assimilates seafloor bathymetry and ice thickness data through a mass conservation approach.
MEaSUREs Greenland Ice Sheet Velocity Map from InSAR Data also referred to as: MEaSUREs Greenland Ice Sheet Velocity Map from InSAR Data
Data Compilation - 2016 - 2017
This data set, part of the NASA Making Earth System Data Records for Use in Research Environments (MEaSUREs) program, contains seasonal (winter) ice-sheet-wide velocity maps for Greenland. The maps are derived from Interferometric Synthetic Aperture Radar (InSAR) data.
Landsat 8/Operational Land Imager also referred to as: Landsat 8 Mosaic of Jakobshavn Region
Data Compilation - Landsat 8 Mosaic of Jakobshavn Region - 08/02/2017, 09/02/2017, 09/04/2017, 09/06/2017
Mosaic of the following Landsat 8 scenes: LC08_L1TP_008011_20170906, LC08_L1TP_008012_20170906, LC08_L1TP_010011_20170904, LC08_L1TP_010012_20170803, and LC08_L1TP_012011_20170902.
airborne/Glacier and Ice Surface Topography Interferometer's (GLISTIN-A)/UAVSAR Topography of Jakobshavn Glacier also referred to as: UAVSAR Topography of Jakobshavn Glacier
Observed Data - JPL - 2016, 2017
The upgraded airborne Glacier and Ice Surface Topography Interferometer (GLISTIN) provides all-weather, high-resolution swath ice surface topography.
Disko Bay Water Temperature Profile also referred to as: Disko Bay Water Temperature Profile
Observed Data - JPL - 1952 - 2017
The water temperature in the Disko Bay from the surface down to 690 meters.
ECCO Ocean Velocity in the North Atlantic also referred to as: ECCO Ocean Velocity in the North Atlantic
Model - JPLKeywords:
SVS >> HDTV
GCMD >> Earth Science >> Cryosphere >> Glaciers/Ice Sheets
GCMD >> Earth Science >> Hydrosphere >> Glaciers/Ice Sheets
GCMD >> Earth Science >> Cryosphere >> Glaciers/Ice Sheets >> Glacier Elevation/Ice Sheet Elevation
GCMD >> Earth Science >> Cryosphere >> Glaciers/Ice Sheets >> Glacier Motion/Ice Sheet Motion
GCMD >> Earth Science >> Cryosphere >> Glaciers/Ice Sheets >> Glacier Thickness/Ice Sheet Thickness
GCMD >> Earth Science >> Cryosphere >> Glaciers/Ice Sheets >> Glaciers
GCMD >> Earth Science >> Hydrosphere >> Glaciers/Ice Sheets >> Glacier Elevation/Ice Sheet Elevation
GCMD >> Earth Science >> Hydrosphere >> Glaciers/Ice Sheets >> Glacier Thickness/Ice Sheet Thickness
GCMD >> Location >> Greenland
SVS >> Jakobshavn
SVS >> Hyperwall
NASA Science >> Earth
GCMD >> Earth Science >> Terrestrial Hydrosphere >> Glaciers/ice Sheets >> Glacier Elevation/ice Sheet Elevation
GCMD >> Earth Science >> Terrestrial Hydrosphere >> Glaciers/ice Sheets >> Glacier Motion/ice Sheet Motion
GCMD >> Earth Science >> Terrestrial Hydrosphere >> Glaciers/ice Sheets >> Glaciers
GCMD keywords can be found on the Internet with the following citation: Olsen, L.M., G. Major, K. Shein, J. Scialdone, S. Ritz, T. Stevens, M. Morahan, A. Aleman, R. Vogel, S. Leicester, H. Weir, M. Meaux, S. Grebas, C.Solomon, M. Holland, T. Northcutt, R. A. Restrepo, R. Bilodeau, 2013. NASA/Global Change Master Directory (GCMD) Earth Science Keywords. Version 8.0.0.0.0


