A 3-D Look at Weather, Clouds, and Aerosols
This gallery was created for Earth Science Week 2015 and beyond. It includes a quick start guide for educators and first-hand stories (blogs) for learners of all ages by NASA visualizers, scientists and educators. We hope that your understanding and use of NASA's visualizations will only increase as your appreciation grows for the beauty of the science they portray, and the communicative power they hold. Read all the blogs and find educational resources for all ages at: The Earth Science Week 2015 page.
I've always been fascinated by our atmosphere. Think about it: even though we don't see it, above us is a great aerial ocean! Over time my fascination has grown from weather maps and pondering the origins of storms, to learning all about the physics that surround our everyday lives. From as early as grade school I was also very interested in computers: diagnosing errors, developing programming skills and learning all about hardware and operating systems. So you might say my interests naturally led me to a career as a NASA scientist, where I create visualizations to study the underlying factors that drive weather patterns. Visualizations help us to see the world differently and actively.
Many of you have no doubt seen your homes from space using a program called Google Earth™. But did you know you could do a lot more with the right data? In fact I often use it to map atmospheric data in three-dimensions (3-D) around the globe. But one of the challenges I often face is that data comes from many different sources, such as NASA and NOAA satellites or ground-observation stations. This means the data is stored on computer disks all over the country and are named and organized according to different standards, requiring us to customize techniques for producing accurate visualizations in one, 3-D display of the Earth. We do this in order to analyze atmospheric relationships more easily because many weather phenomena arise from physical interactions, both horizontally and vertically, in the global circulation.
A big part of atmospheric research relies on using computer models to simulate what our atmosphere will do under different conditions. A great example of this is the data used to prepare the daily weather forecast. This data originates from weather forecasting models that calculate atmospheric motions using the world’s fastest supercomputers. But how do we know these forecasts are accurate? Researchers can verify a model's performance by visualizing one of the variables such as temperature, humidity, wind speed, wind direction, or air pressure and then using color shading, contour curves, and wind "barbs" to graph that data. Then they overlay the observations from NASA satellites such as cloud-top imagery, cloud-top temperature, and vertical distributions of clouds and aerosols, with the graph (it can be challenging to synchronize the data display as these times usually don't match). After this process, the display confirms the model's accuracy. This method is used to study many atmospheric events, such as timing of a storm system, precipitation, or the direction of dust or smoke transport.
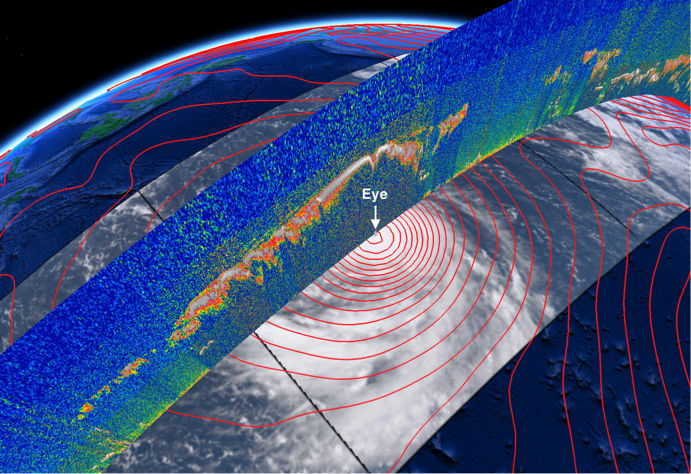
My passion is transforming weather data into rich visualizations that allow us to see things differently or tell us a story. My favorite part is using remotely-sensed NASA data to view clouds over the oceans. This is very important because ground observations are sparse to non-existent for oceans, which cover much of the Earth's surface. Warm oceans are what allow hurricanes to form. Visualization tools can greatly aid the interpretation of data used to understand and forecast hurricanes by integrating multiple datasets into a common display. This helps to communicate to the public the track and intensity of tropical storms, which is absolutely vital for the safety of millions of people around the world, especially those living in coastal communities.
Ultimately, it's how my work impacts understanding of weather and potentially helps the rest of the world that keeps me motivated. I have been very lucky to explore our planet in a new and different way and to continually rediscover my passion for Earth science. It’s been a remarkable journey — challenging, fulfilling and ever-changing — and I hope many of you choose to undertake it!

-- Roman Kowch, Staff Research Scientist (SSAI/NASA Langley Research Center)

For More Information
Visualization Credits
NASA's Scientific Visualization Studio
https://svs.gsfc.nasa.gov/4377
Keywords:
SVS >> Hyperwall
NASA Science >> Earth
NASA Earth Science Focus Areas >> Atmospheric Composition


