Earth
ID: 4052
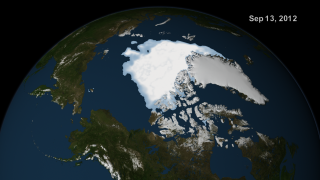
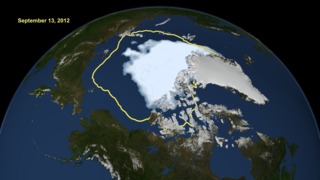
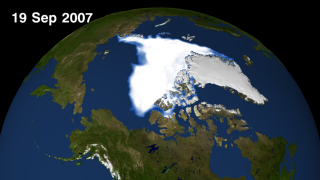
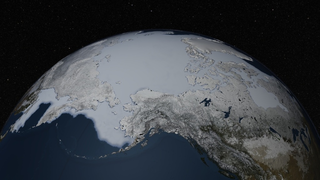
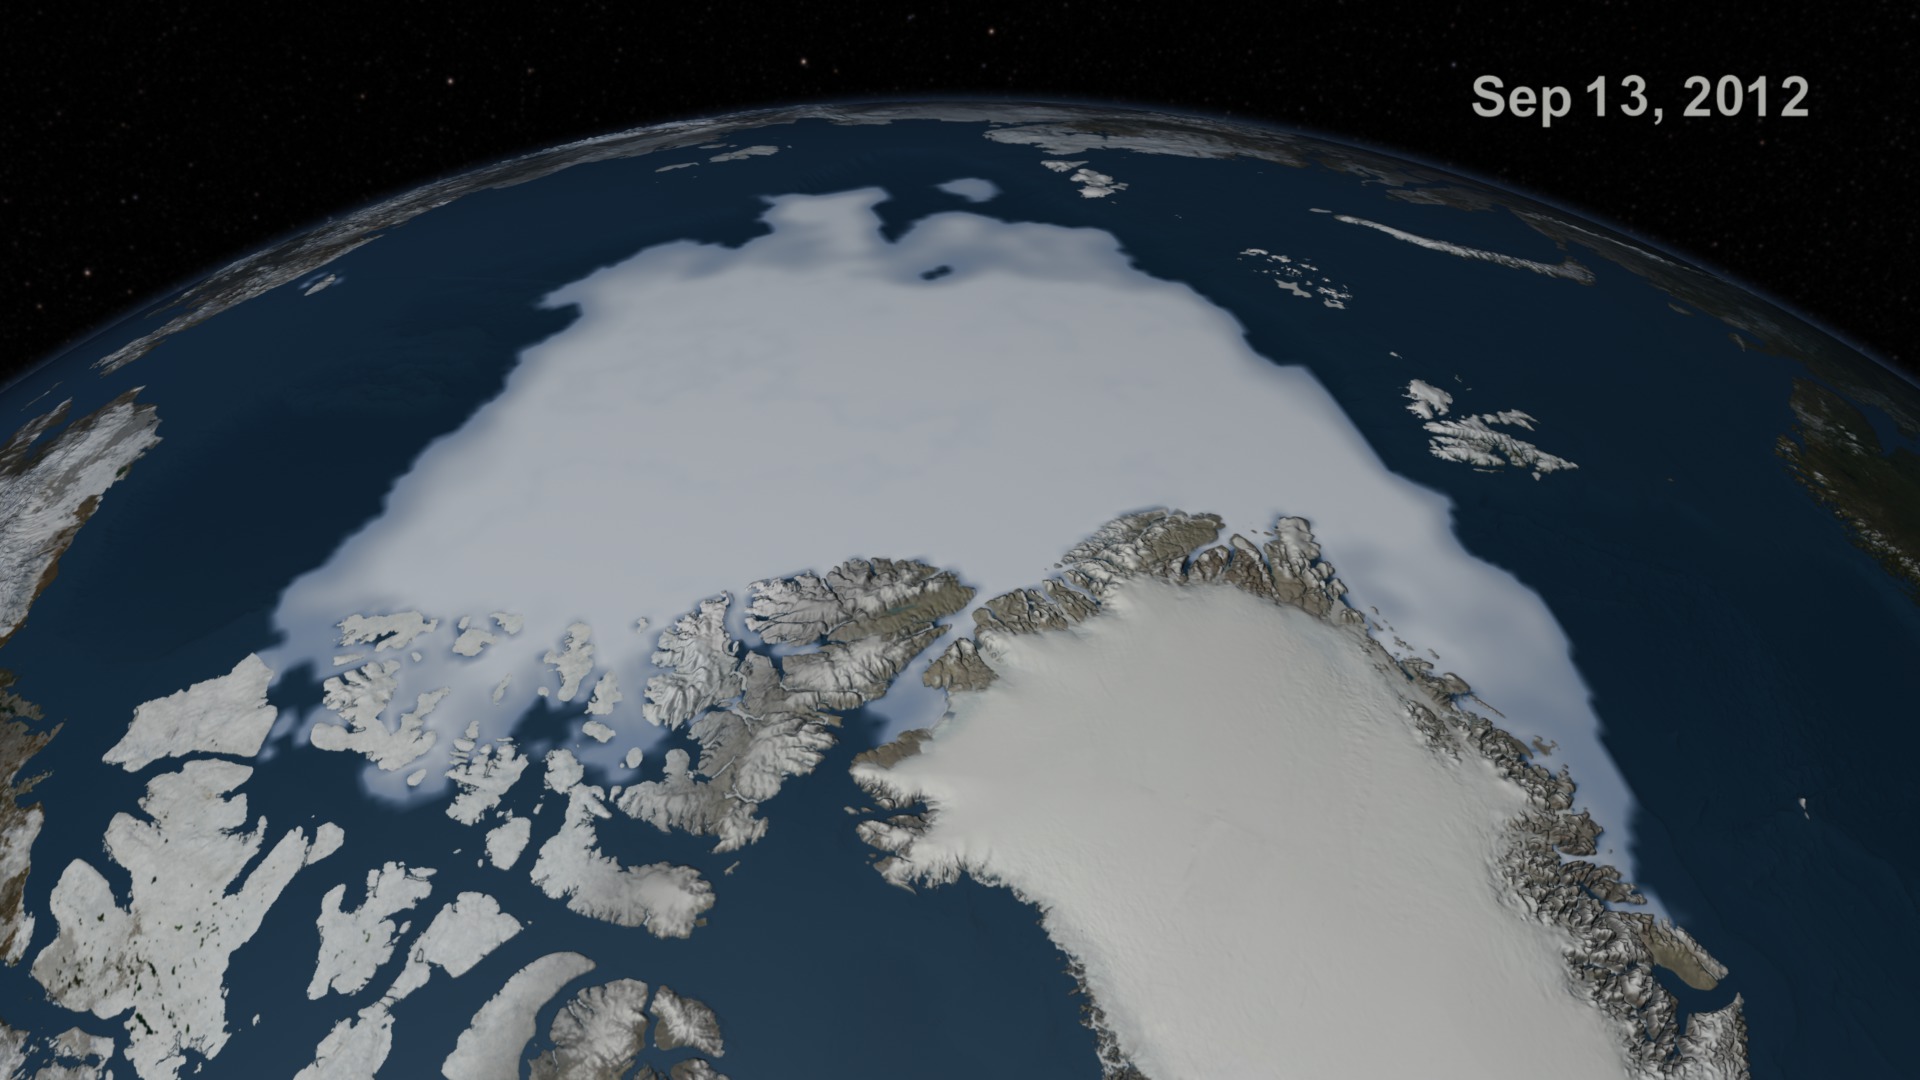
This animation shows the seasonal change in the extent of the Arctic sea ice between March 1, 2012 and February 28, 2013. The annual cycle starts with the maximum extent reached on March 15, 2012. Every summer the Arctic ice cap melts down to its minimum extent before colder weather builds the ice cover back up. This new ice generated on an annual basis is called "first-year" ice and is thinner than the older sea ice. The perennial ice is the portion of the ice cap that spans multiple years and represents its thickest component. On September 13, 2012, the sea ice minimum covered 3.439 million square kilometers, that is down by more than 3.571 million square kilometers from the high of 7.011 million square kilometers measured in 1980. The annual maximum extent for 2013 reached on February 28 reached an extent of 15.09 million square kilometers.
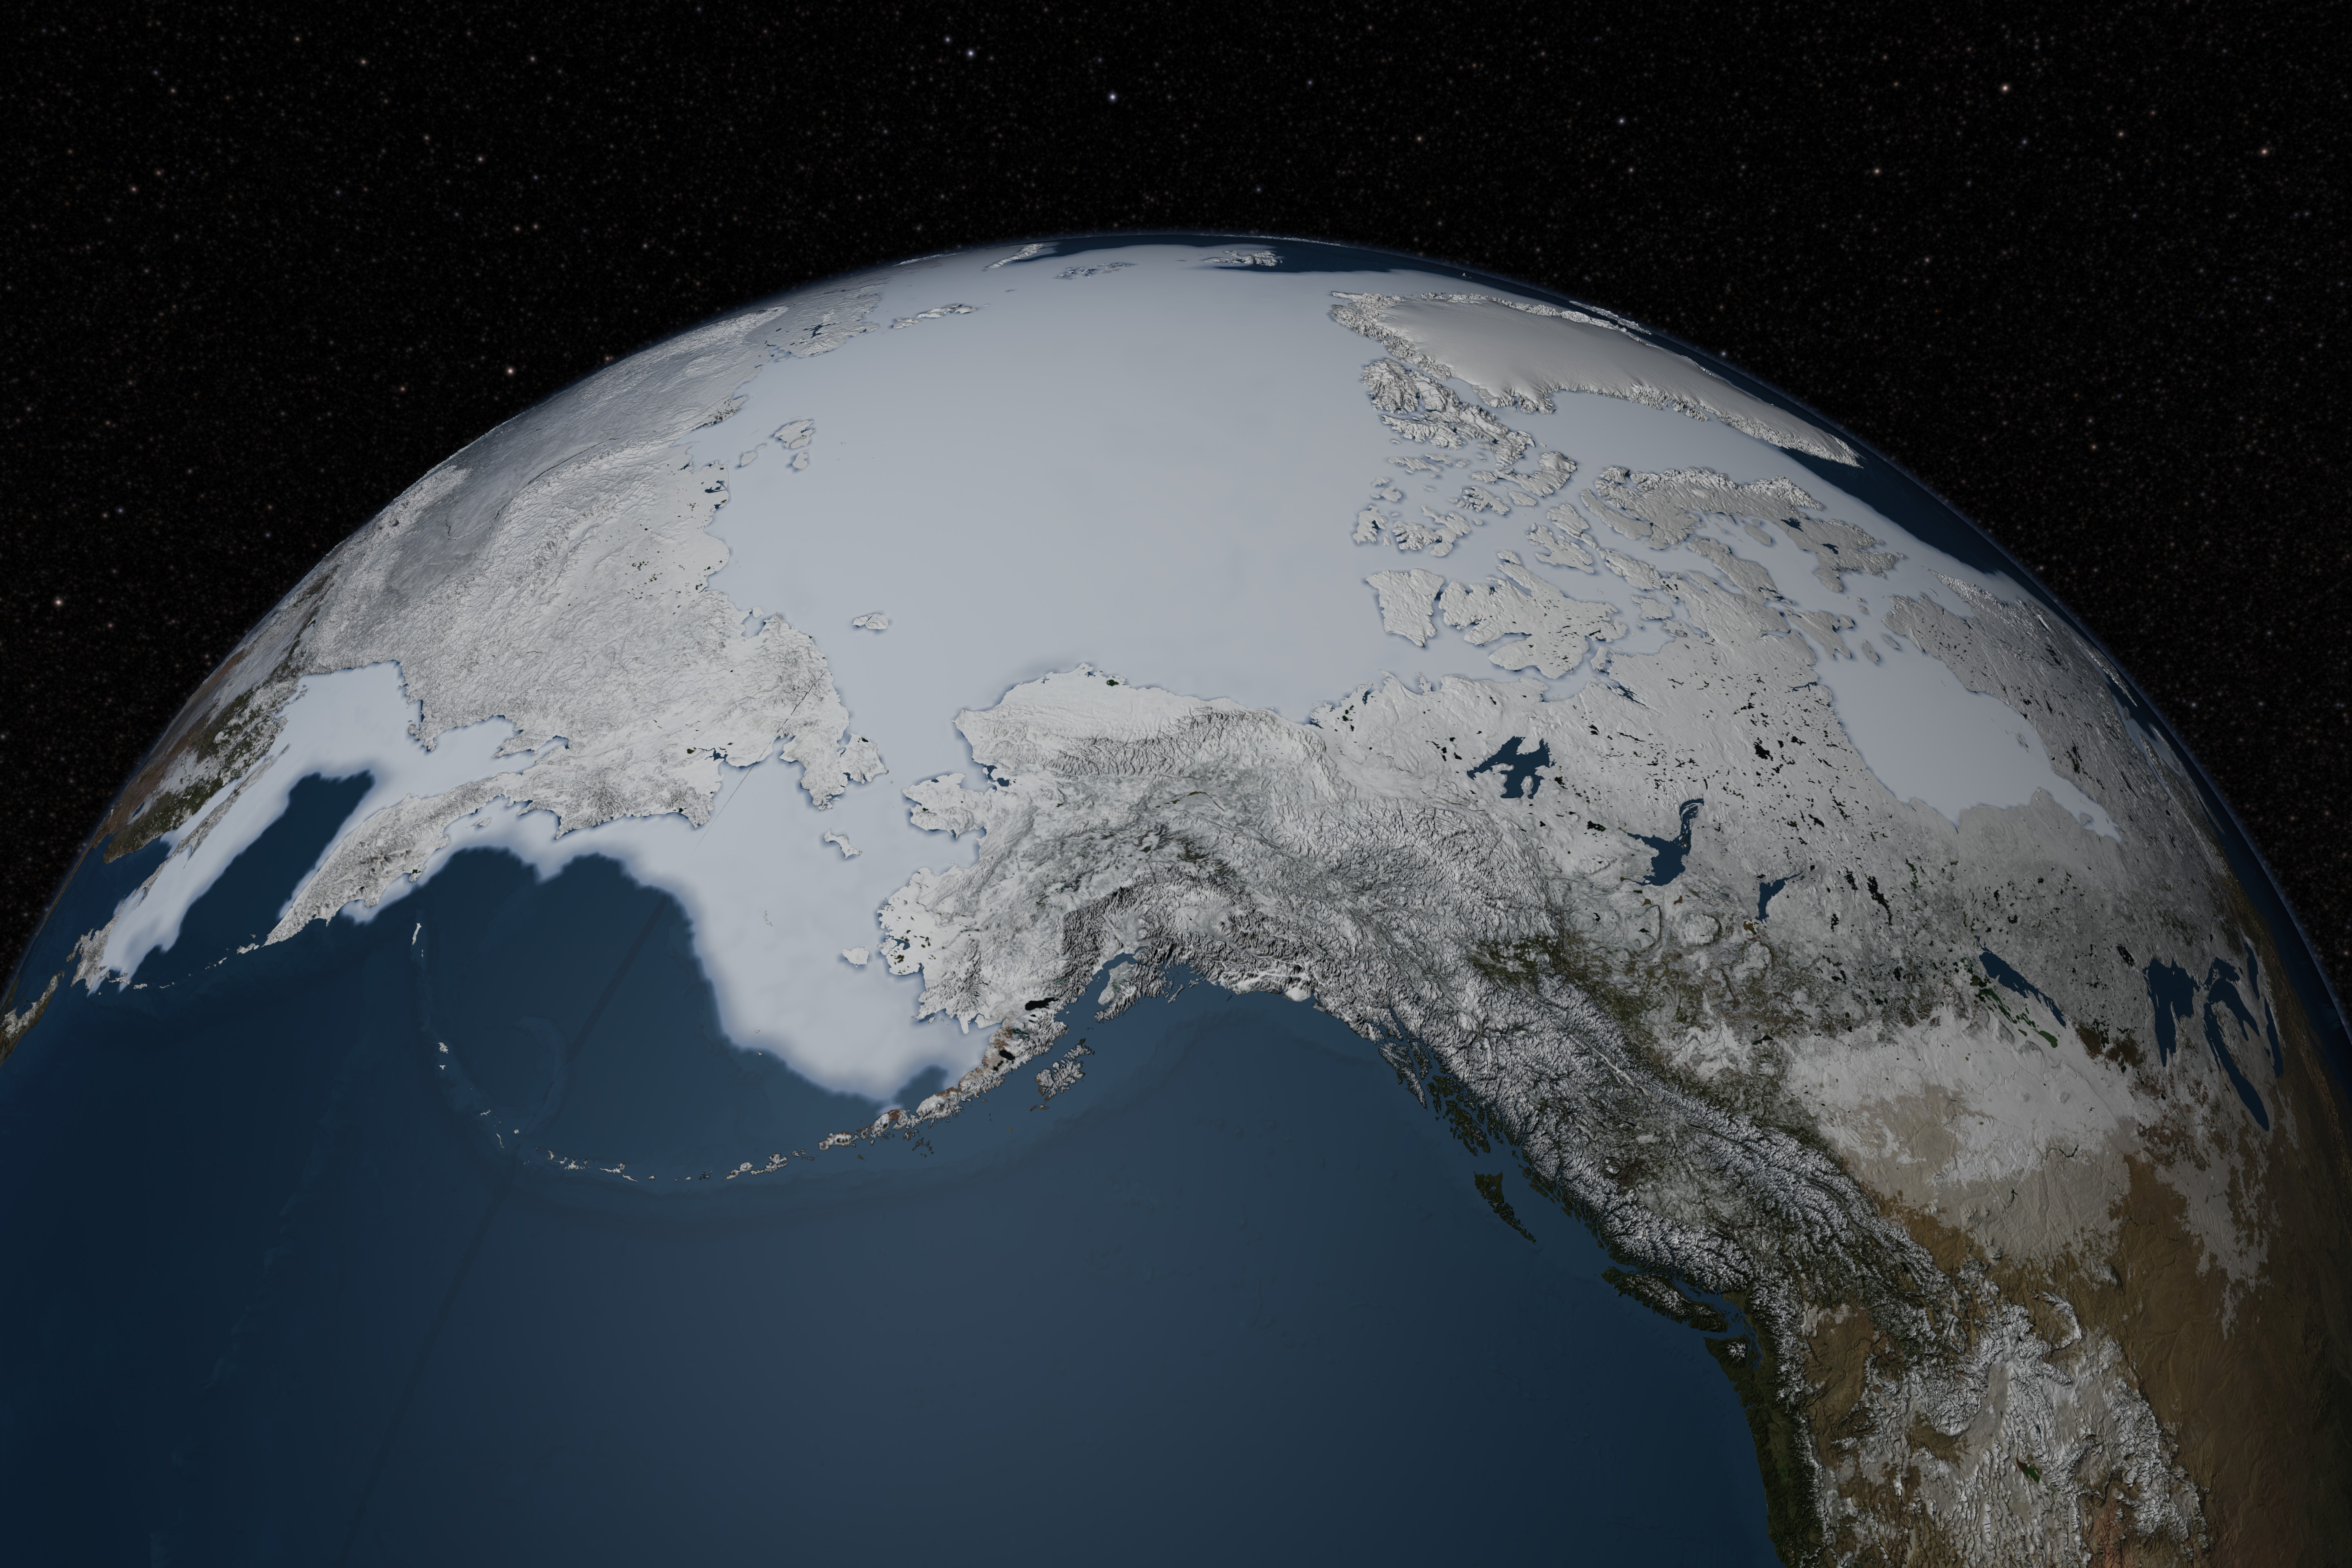
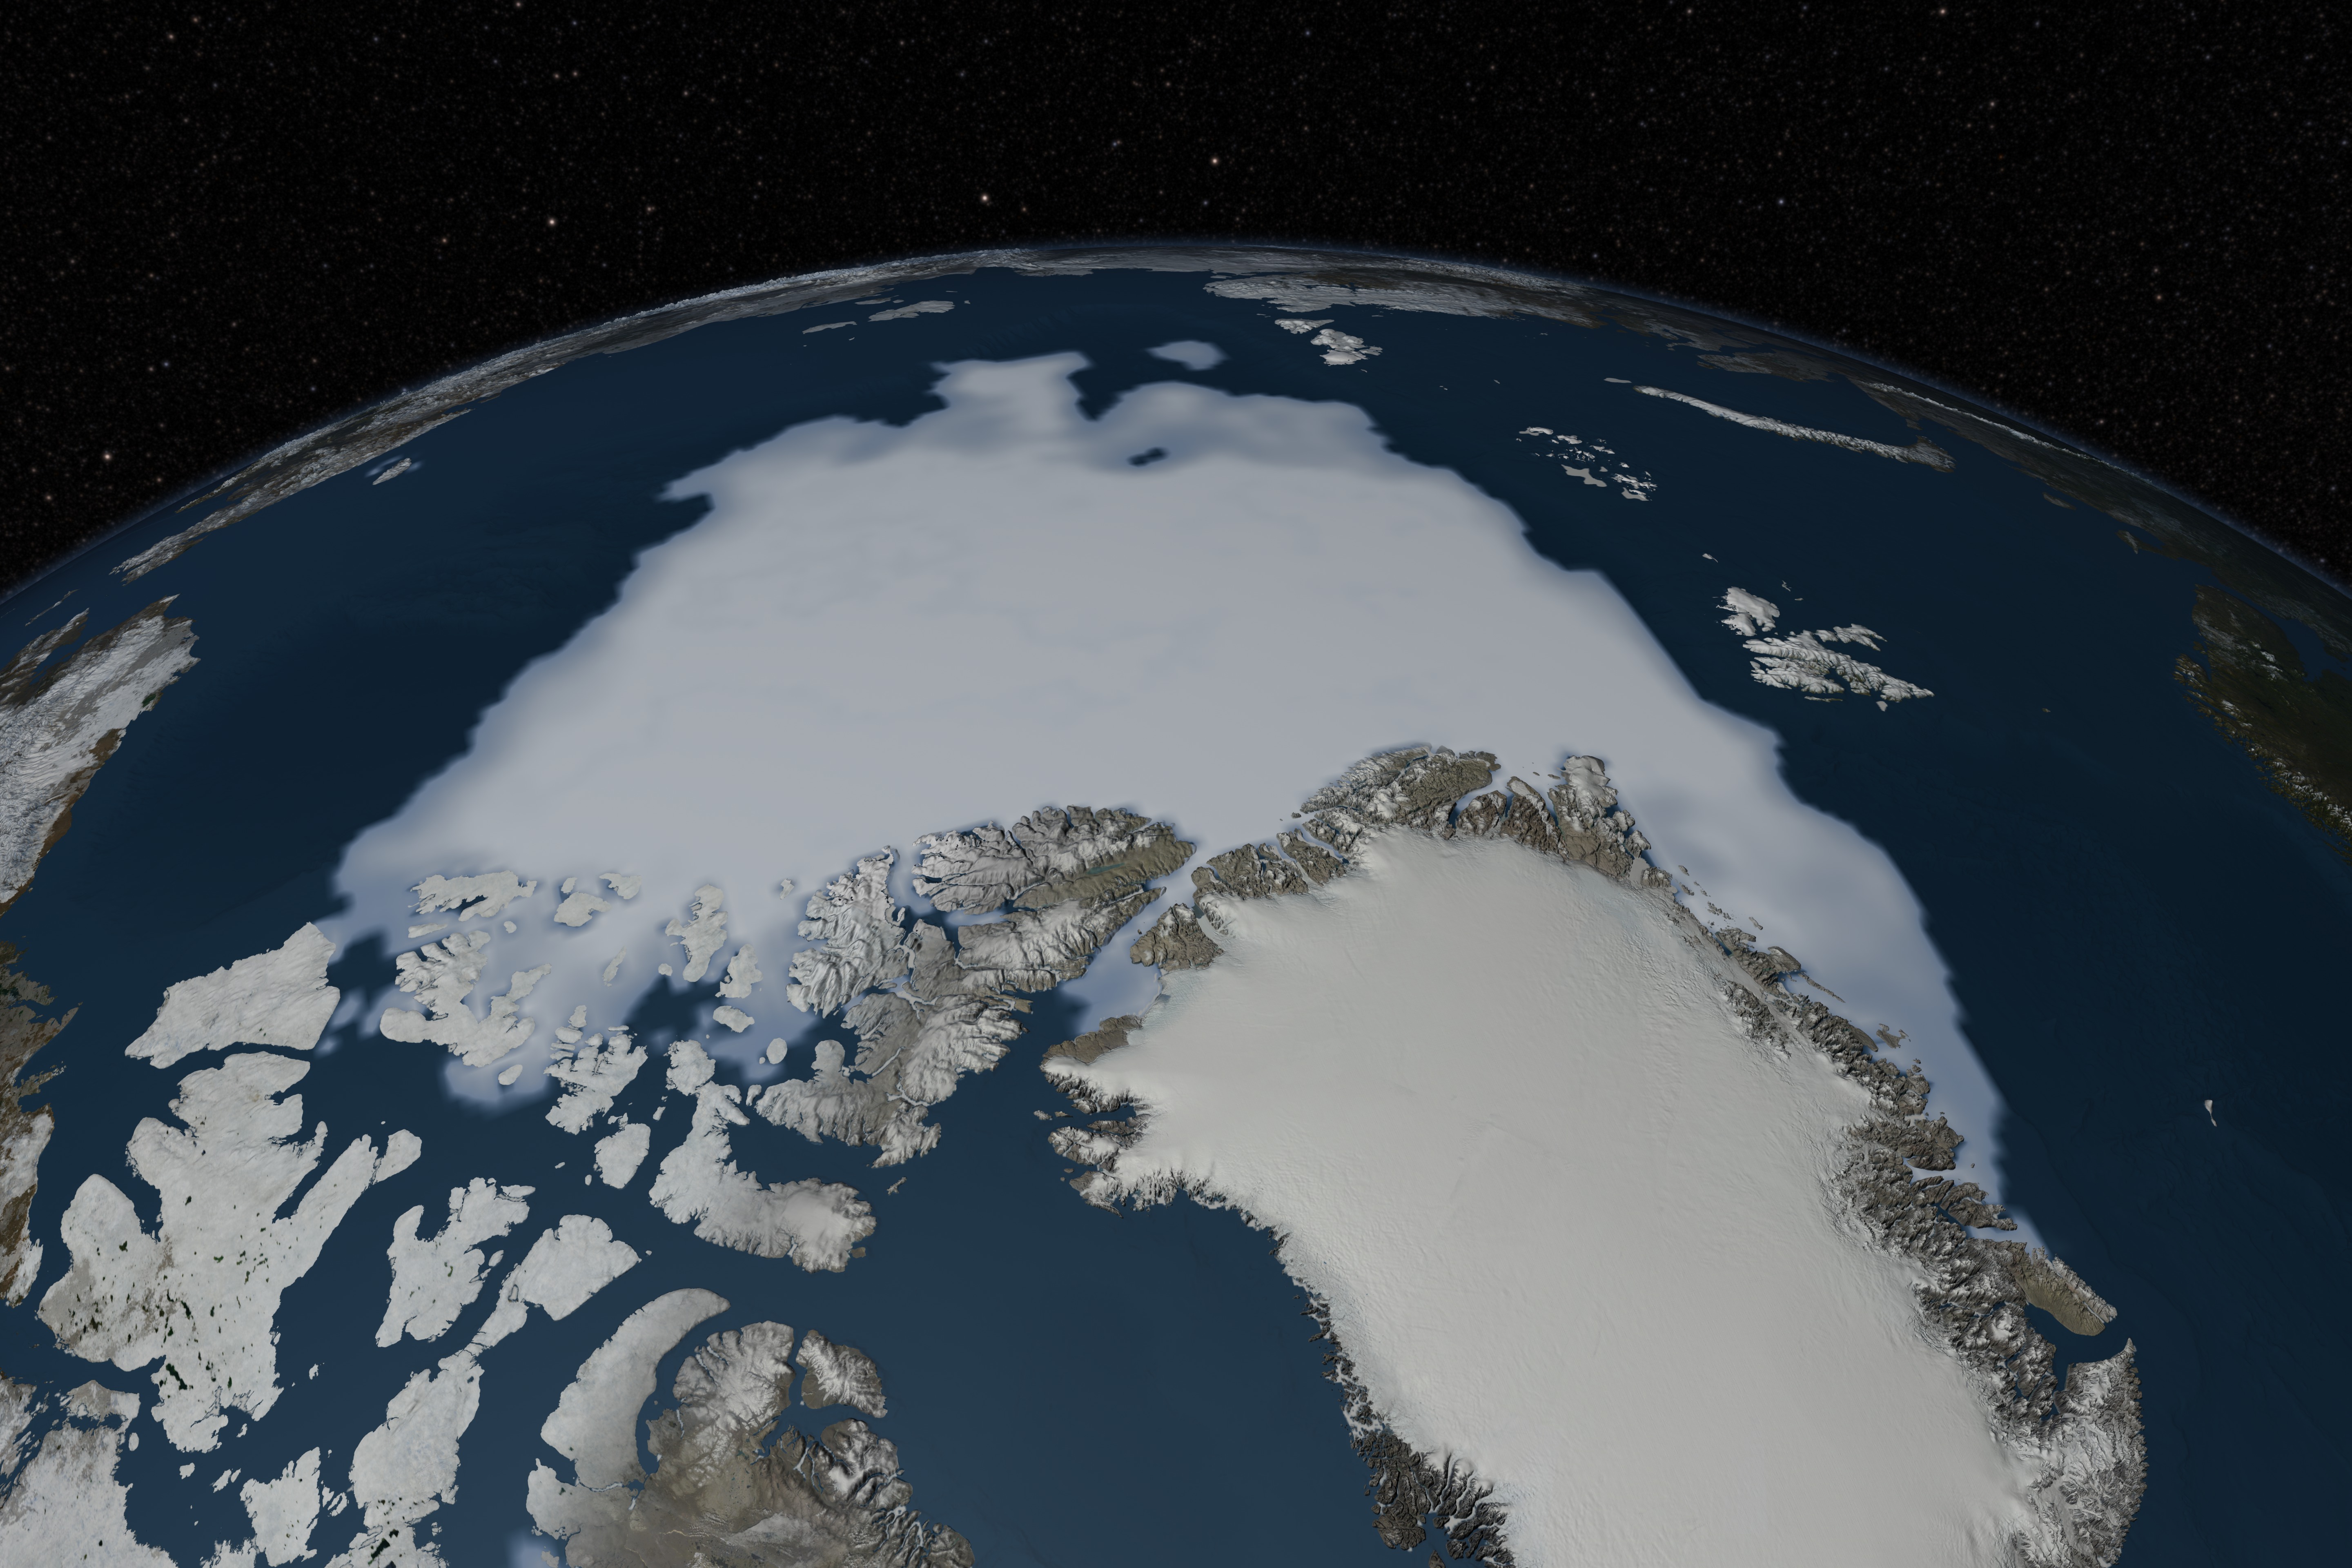
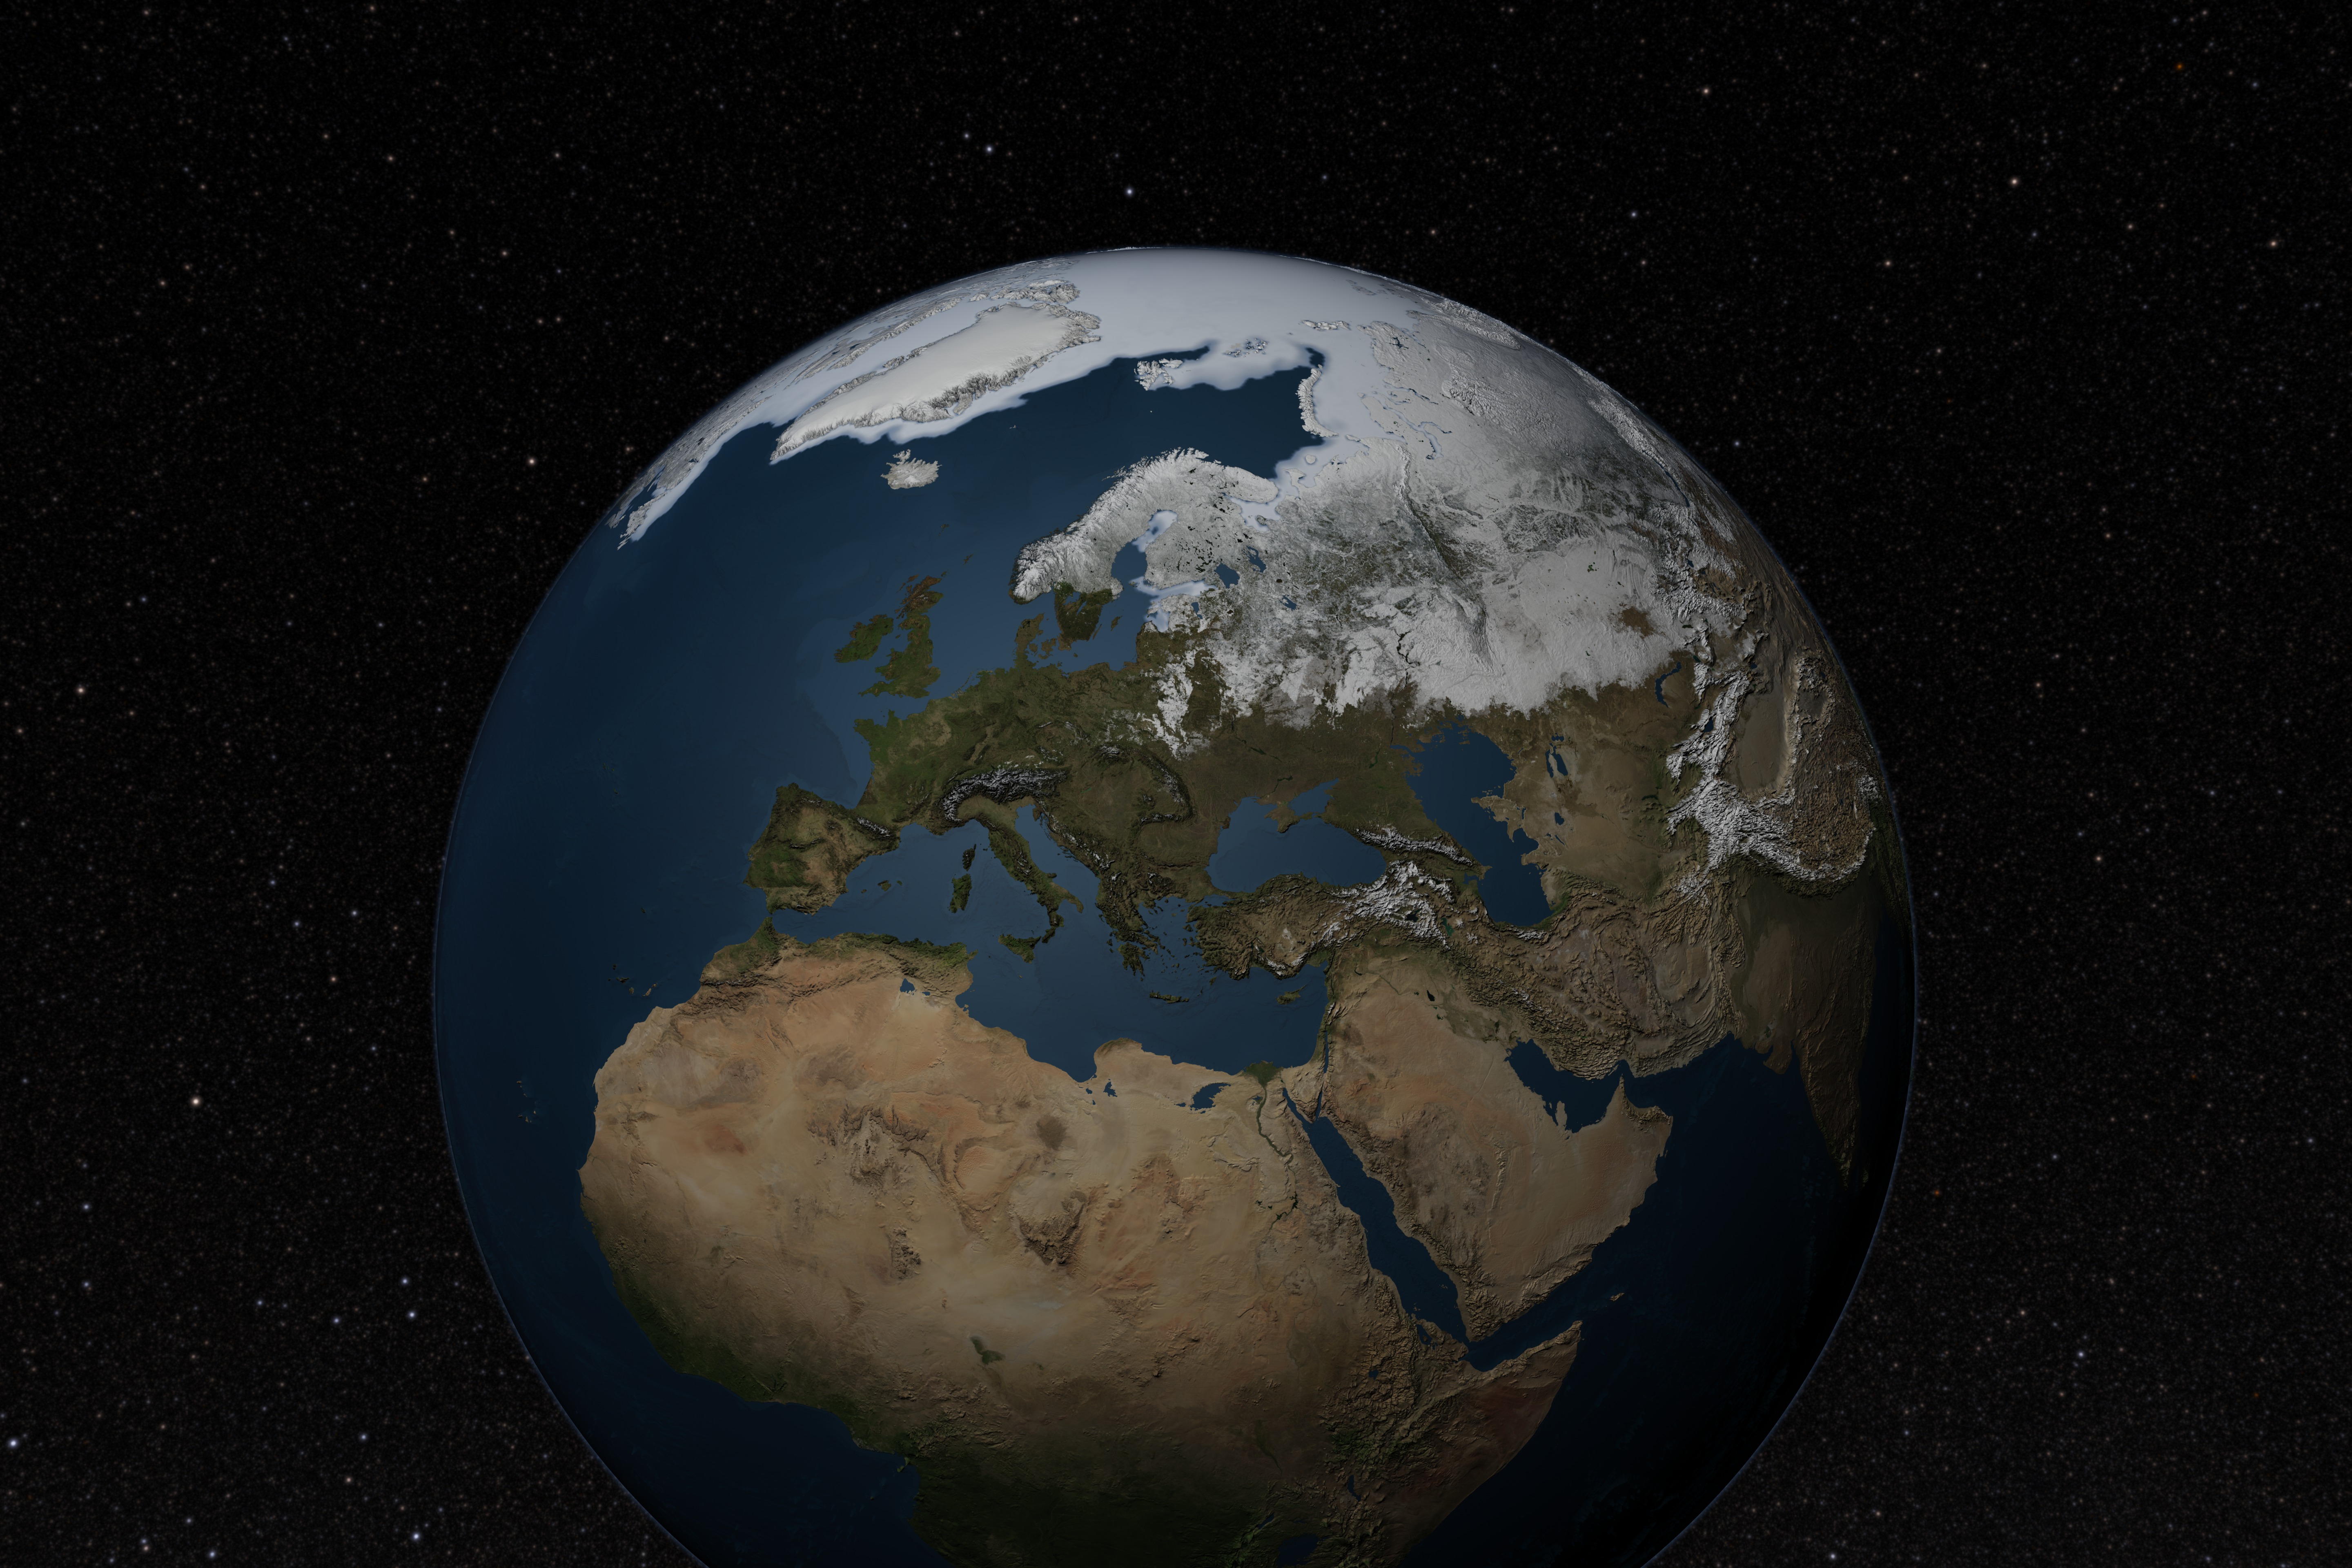
Arctic Daily Sea Ice Concentration from March 2012 to February 2013
Older Versions
Related
Visualization Credits
Cindy Starr (Global Science and Technology, Inc.): Lead Visualizer
Jefferson Beck (USRA): Producer
Josefino Comiso (NASA/GSFC): Scientist
Robert Gersten (Wyle Information Systems): Scientist
Laurence Schuler (ADNET Systems, Inc.): Project Support
Ian Jones (ADNET Systems, Inc.): Project Support
Jefferson Beck (USRA): Producer
Josefino Comiso (NASA/GSFC): Scientist
Robert Gersten (Wyle Information Systems): Scientist
Laurence Schuler (ADNET Systems, Inc.): Project Support
Ian Jones (ADNET Systems, Inc.): Project Support
Please give credit for this item to:
NASA's Goddard Space Flight Center Scientific Visualization Studio
The Blue Marble data is courtesy of Reto Stockli (NASA/GSFC).
Data Citation for Greenland DEM: Howat I.M., A. Negrete, T. Scambos, T. Haran, in prep, A high-resolution elevation model for the Greenland Ice Sheet from combined stereoscopic and photoclinometric data.
Short URL to share this page:
https://svs.gsfc.nasa.gov/4052
Missions:
Terra
Global Precipitation Measurement (GPM)
Data Used:
Note: While we identify the data sets used in these visualizations, we do not store any further details nor the data sets themselves on our site.
Keywords:
DLESE >> Cryology
SVS >> HDTV
GCMD >> Earth Science >> Cryosphere >> Sea Ice >> Sea Ice Concentration
GCMD >> Earth Science >> Oceans >> Sea Ice >> Sea Ice Concentration
SVS >> Hyperwall
NASA Science >> Earth
GCMD keywords can be found on the Internet with the following citation: Olsen, L.M., G. Major, K. Shein, J. Scialdone, S. Ritz, T. Stevens, M. Morahan, A. Aleman, R. Vogel, S. Leicester, H. Weir, M. Meaux, S. Grebas, C.Solomon, M. Holland, T. Northcutt, R. A. Restrepo, R. Bilodeau, 2013. NASA/Global Change Master Directory (GCMD) Earth Science Keywords. Version 8.0.0.0.0
https://svs.gsfc.nasa.gov/4052
Missions:
Terra
Global Precipitation Measurement (GPM)
Data Used:
Greenland Mapping Project (GIMP) Digital Elevation Model also referred to as: GIMP Greenland DEM
Data Compilation - Courtesy of Ian Howat, OSUTerra and Aqua/MODIS/Land Cover
Comiso's Daily Sea Ice Concentration
Data Compilation - NASA/GSFCTerra and Aqua/MODIS/Blue Marble: Next Generation also referred to as: BMNG
Credit:
The Blue Marble data is courtesy of Reto Stockli (NASA/GSFC).
The Blue Marble data is courtesy of Reto Stockli (NASA/GSFC).
GTOPO30 Topography and Bathymetry
Data Compilation - USGSKeywords:
DLESE >> Cryology
SVS >> HDTV
GCMD >> Earth Science >> Cryosphere >> Sea Ice >> Sea Ice Concentration
GCMD >> Earth Science >> Oceans >> Sea Ice >> Sea Ice Concentration
SVS >> Hyperwall
NASA Science >> Earth
GCMD keywords can be found on the Internet with the following citation: Olsen, L.M., G. Major, K. Shein, J. Scialdone, S. Ritz, T. Stevens, M. Morahan, A. Aleman, R. Vogel, S. Leicester, H. Weir, M. Meaux, S. Grebas, C.Solomon, M. Holland, T. Northcutt, R. A. Restrepo, R. Bilodeau, 2013. NASA/Global Change Master Directory (GCMD) Earth Science Keywords. Version 8.0.0.0.0


