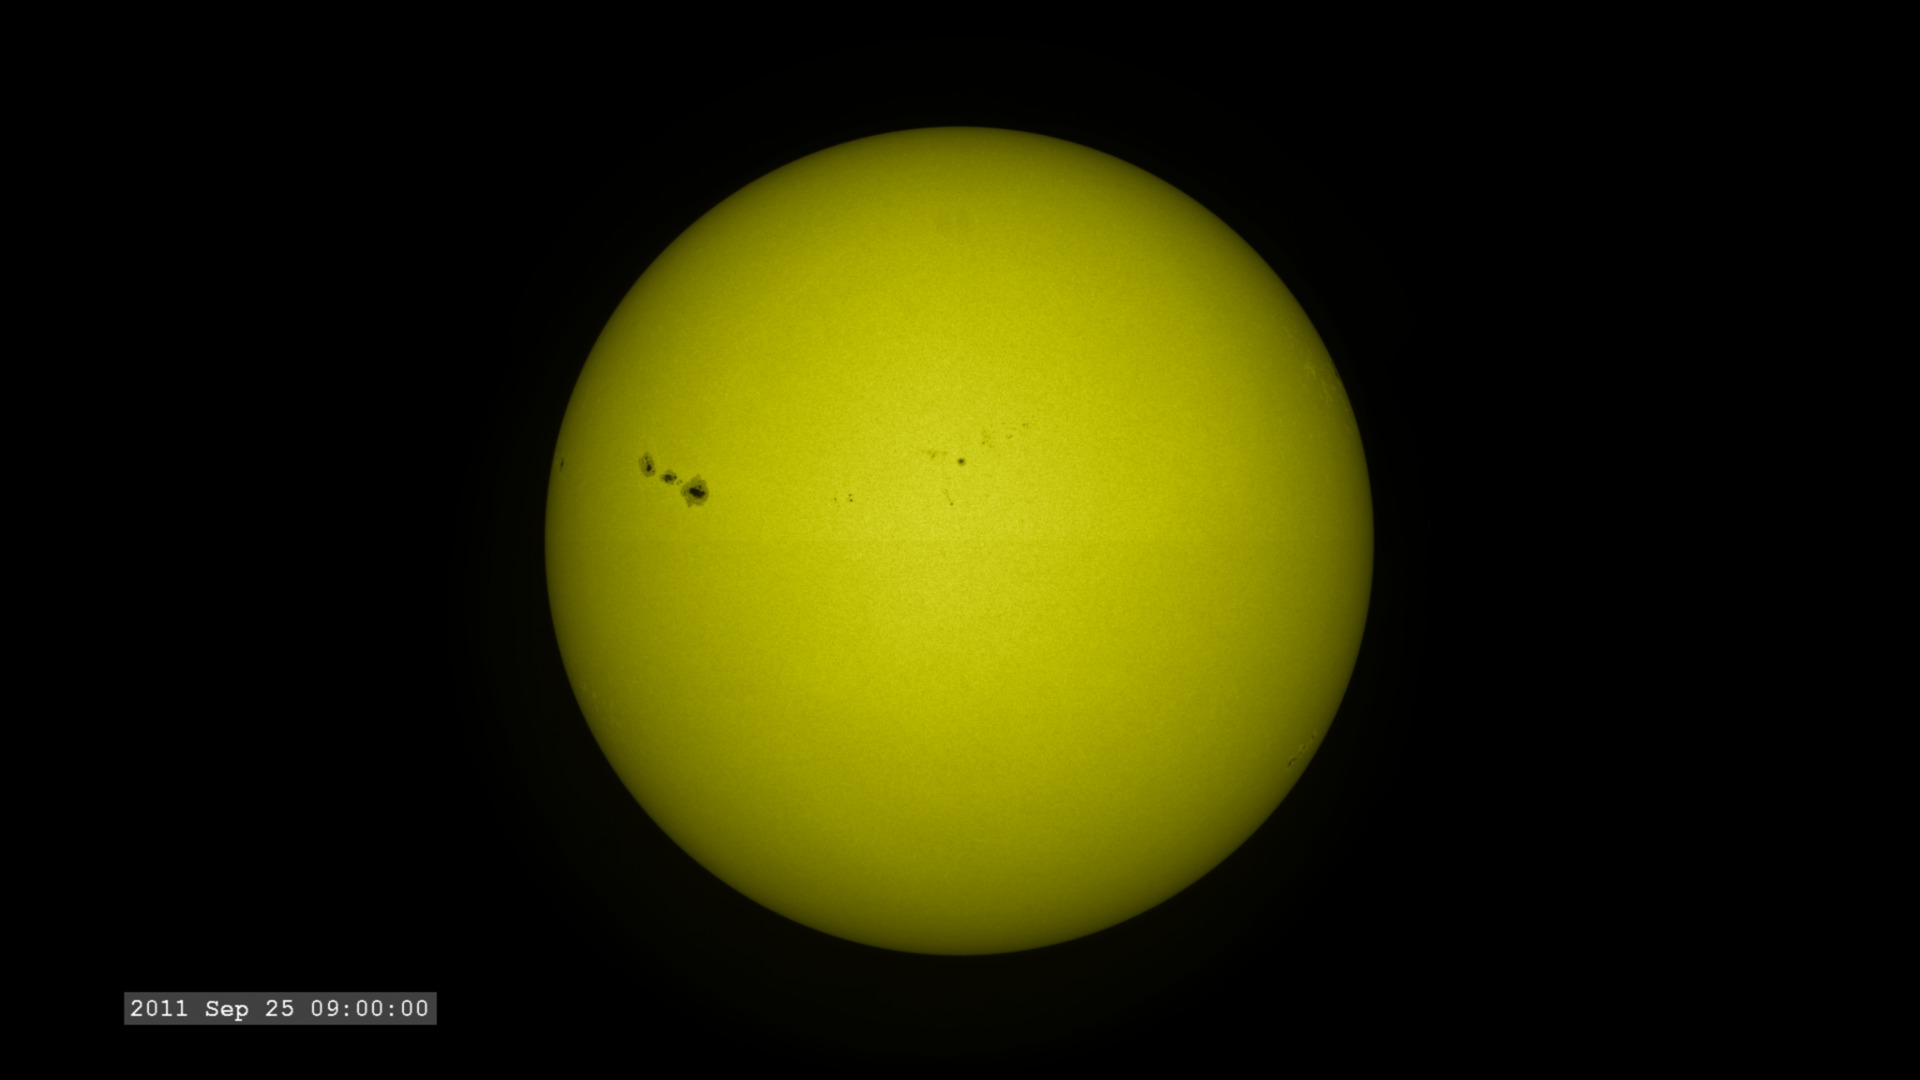
The Active Sun from SDO: 4500 Ångstroms
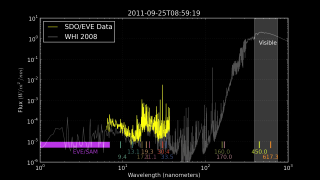
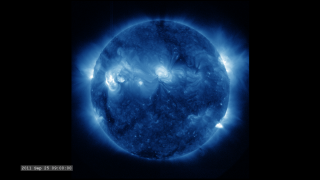
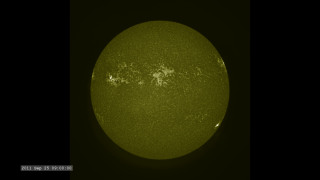
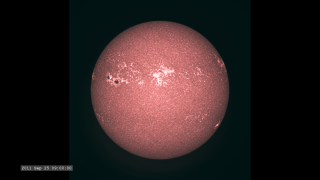
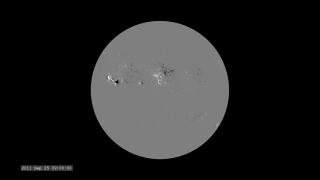
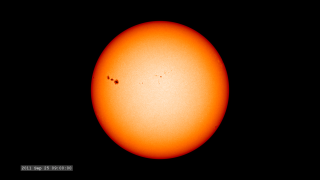
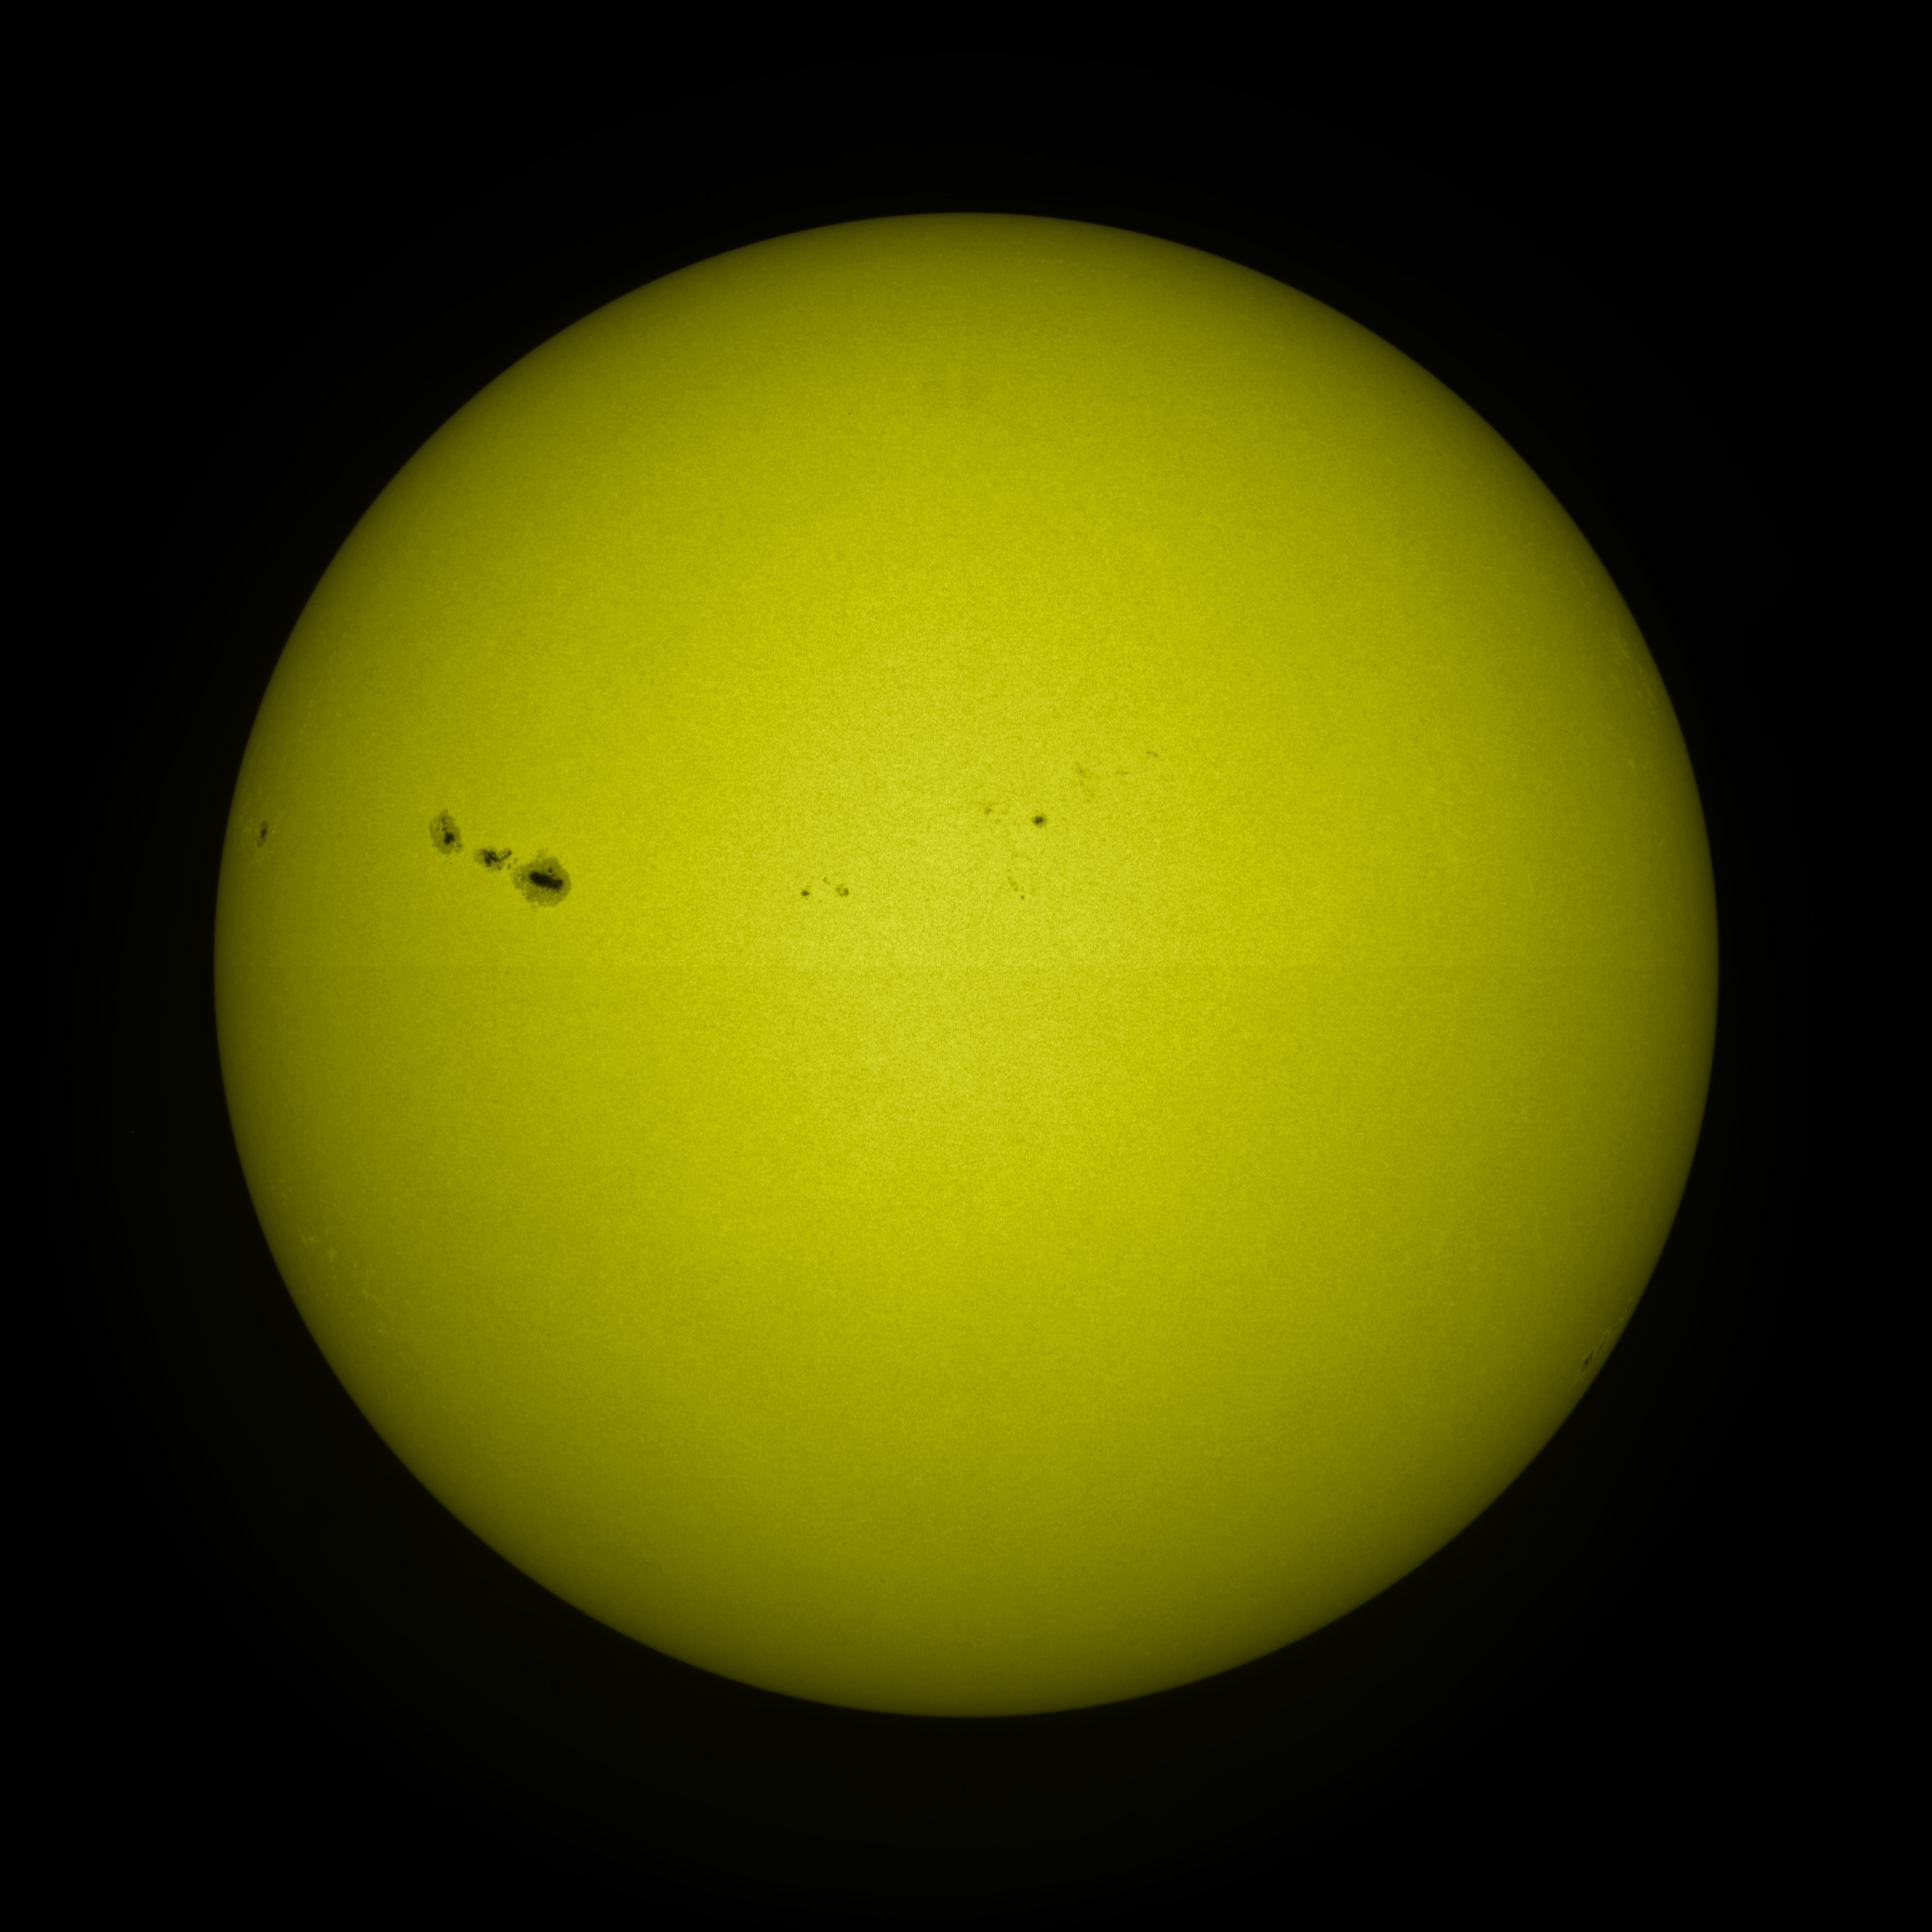
This movie is generated for a wavelength of 4500 Ångstroms (450.0 nanometers) which corresponds to visible light, showing the Sun's visible surface, or photosphere. This wavelength can also be seen from the surface of the Earth, though not with the clarity possible from SDO. The dark regions on the left side are sunspots (Wikipedia) - essentially magnetic storms in the photosphere.
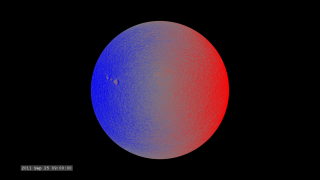
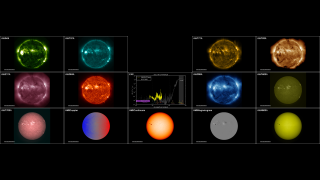
This visualization is one of a set of visualizations (others linked below) covering the same time span of 17 hours over the full wavelength range of the mission. They are setup to play synchronously on a Hyperwall, or can be run individually.
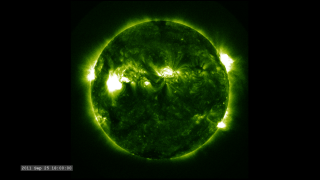
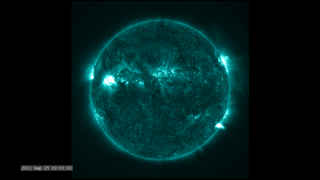
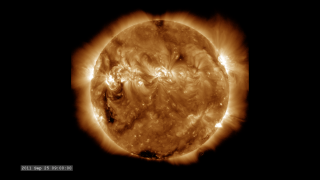
The images are sampled every 36 seconds, 1/3 of the standard time-cadence for SDO. This visualization is useful for illustrating how different solar phenomena, such as sunspots and active regions, look very different in different wavelengths of light. These differences enable scientists to study them more completely, with an eventual goal of improving Space Weather forecasting.
Related


Visualization Credits
Scott Wiessinger (USRA): Producer
Genna Duberstein (USRA): Producer
Phil Chamberlin (NASA/GSFC): Scientist
NASA/Goddard Space Flight Center Scientific Visualization Studio, the SDO Science Team, and the Virtual Solar Observatory.
https://svs.gsfc.nasa.gov/3987
Mission:
SDO
Data Used:
SDO/AIA/4500 Filter also referred to as: AIA 4500
JOINT SCIENCE OPERATIONS CENTER - 2011-09-25T08:00 - 2011-09-26T01:00This item is part of this series:
SDO Jewelbox
Keywords:
SVS >> HDTV
GCMD >> Earth Science >> Sun-earth Interactions >> Solar Activity >> Solar Flares
SVS >> Hyperwall
SVS >> SDO
SVS >> Solar Dynamics Observatory
SVS >> Heliophysics
SVS >> Corona
NASA Science >> Sun
GCMD >> Earth Science >> Sun-earth Interactions >> Solar Activity >> Coronal Mass Ejections
GCMD keywords can be found on the Internet with the following citation: Olsen, L.M., G. Major, K. Shein, J. Scialdone, S. Ritz, T. Stevens, M. Morahan, A. Aleman, R. Vogel, S. Leicester, H. Weir, M. Meaux, S. Grebas, C.Solomon, M. Holland, T. Northcutt, R. A. Restrepo, R. Bilodeau, 2013. NASA/Global Change Master Directory (GCMD) Earth Science Keywords. Version 8.0.0.0.0


