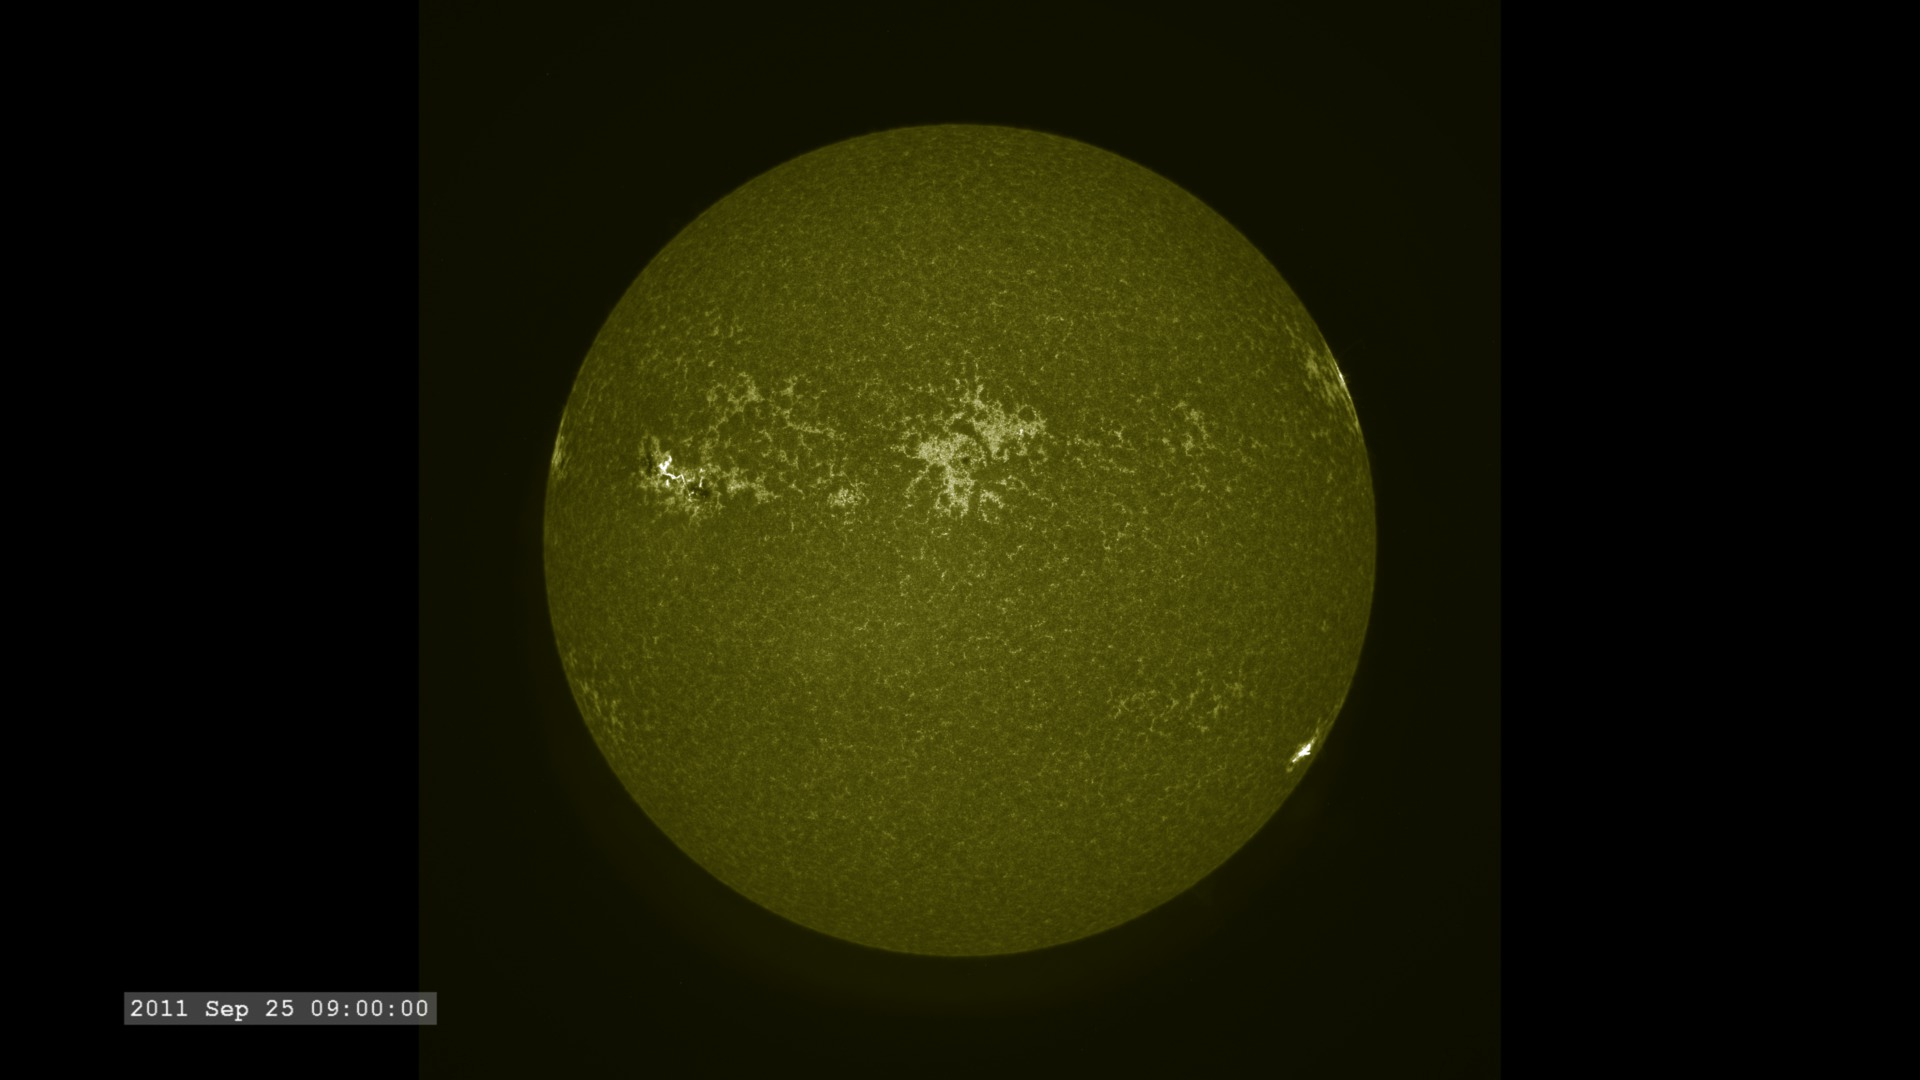
The Active Sun from SDO: HMI Intensity
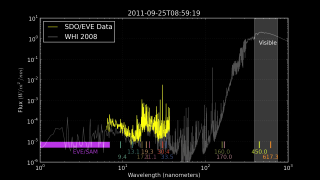
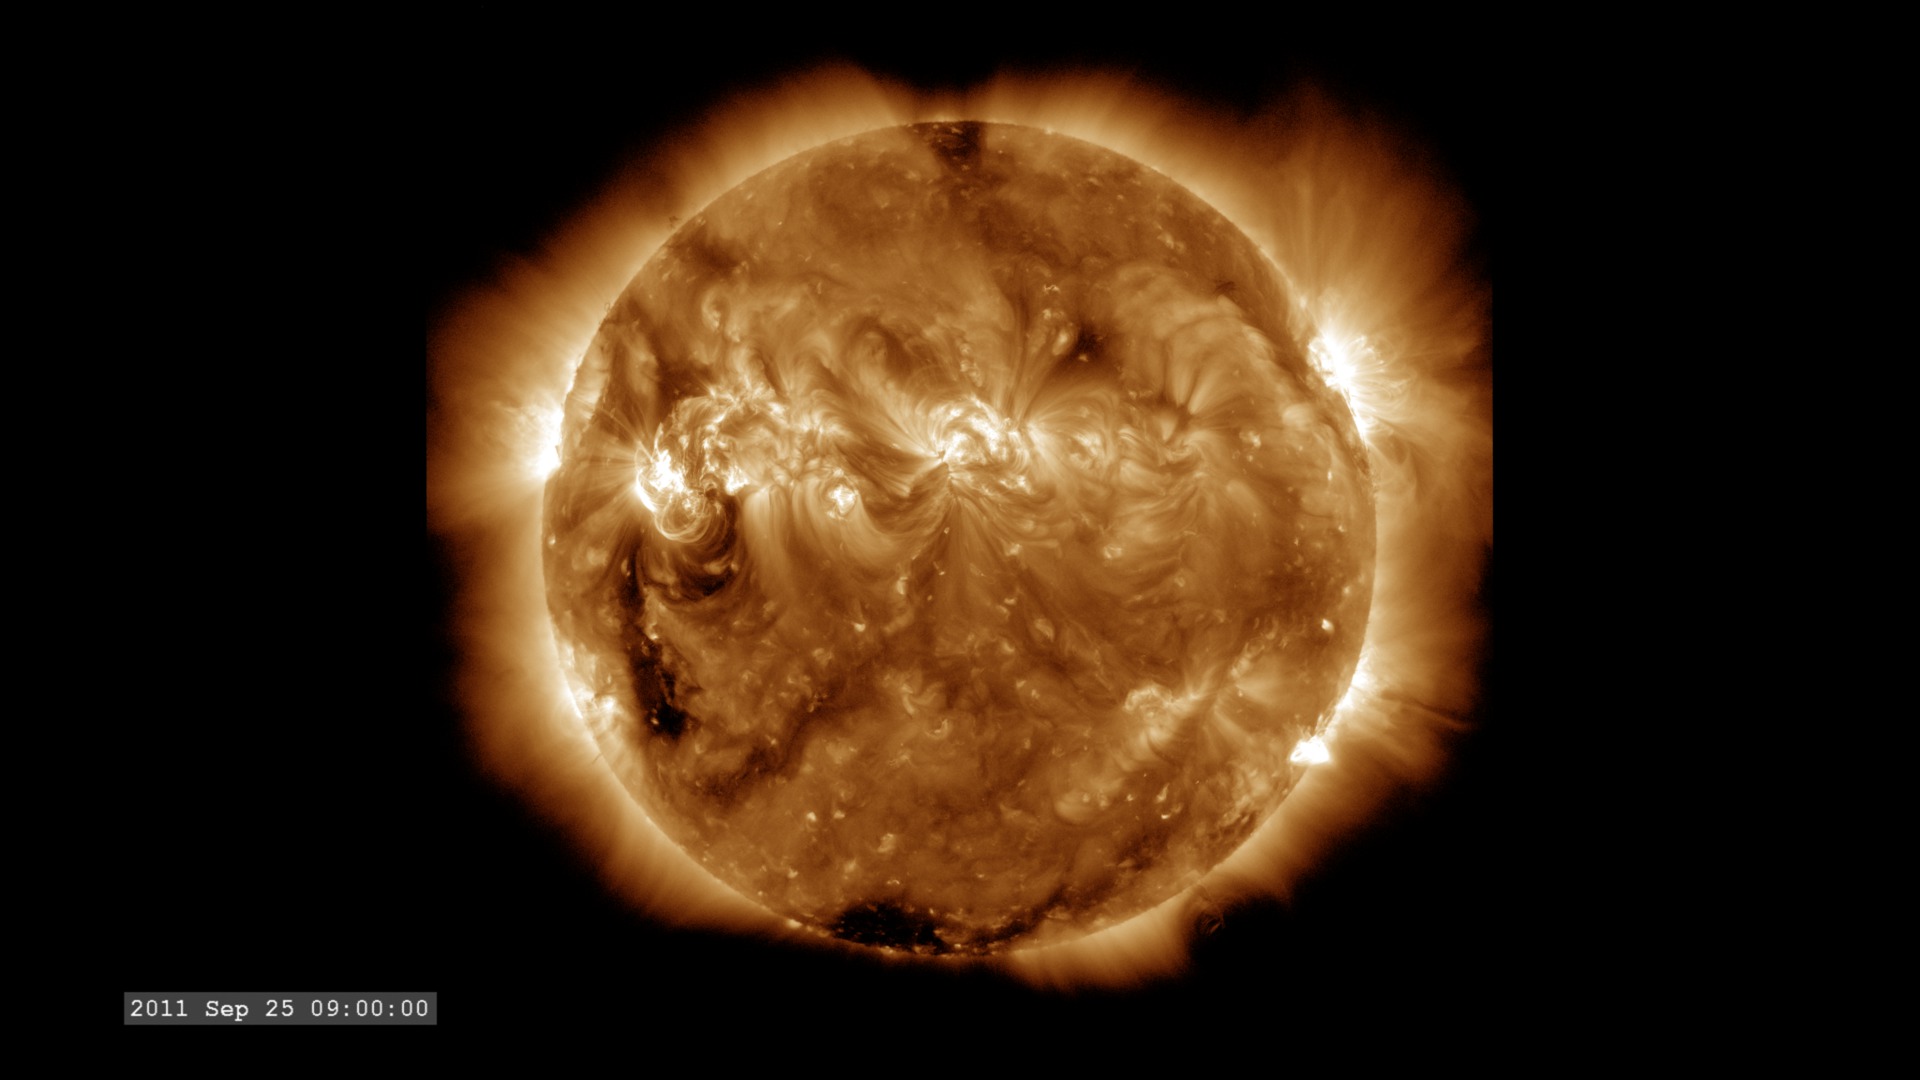
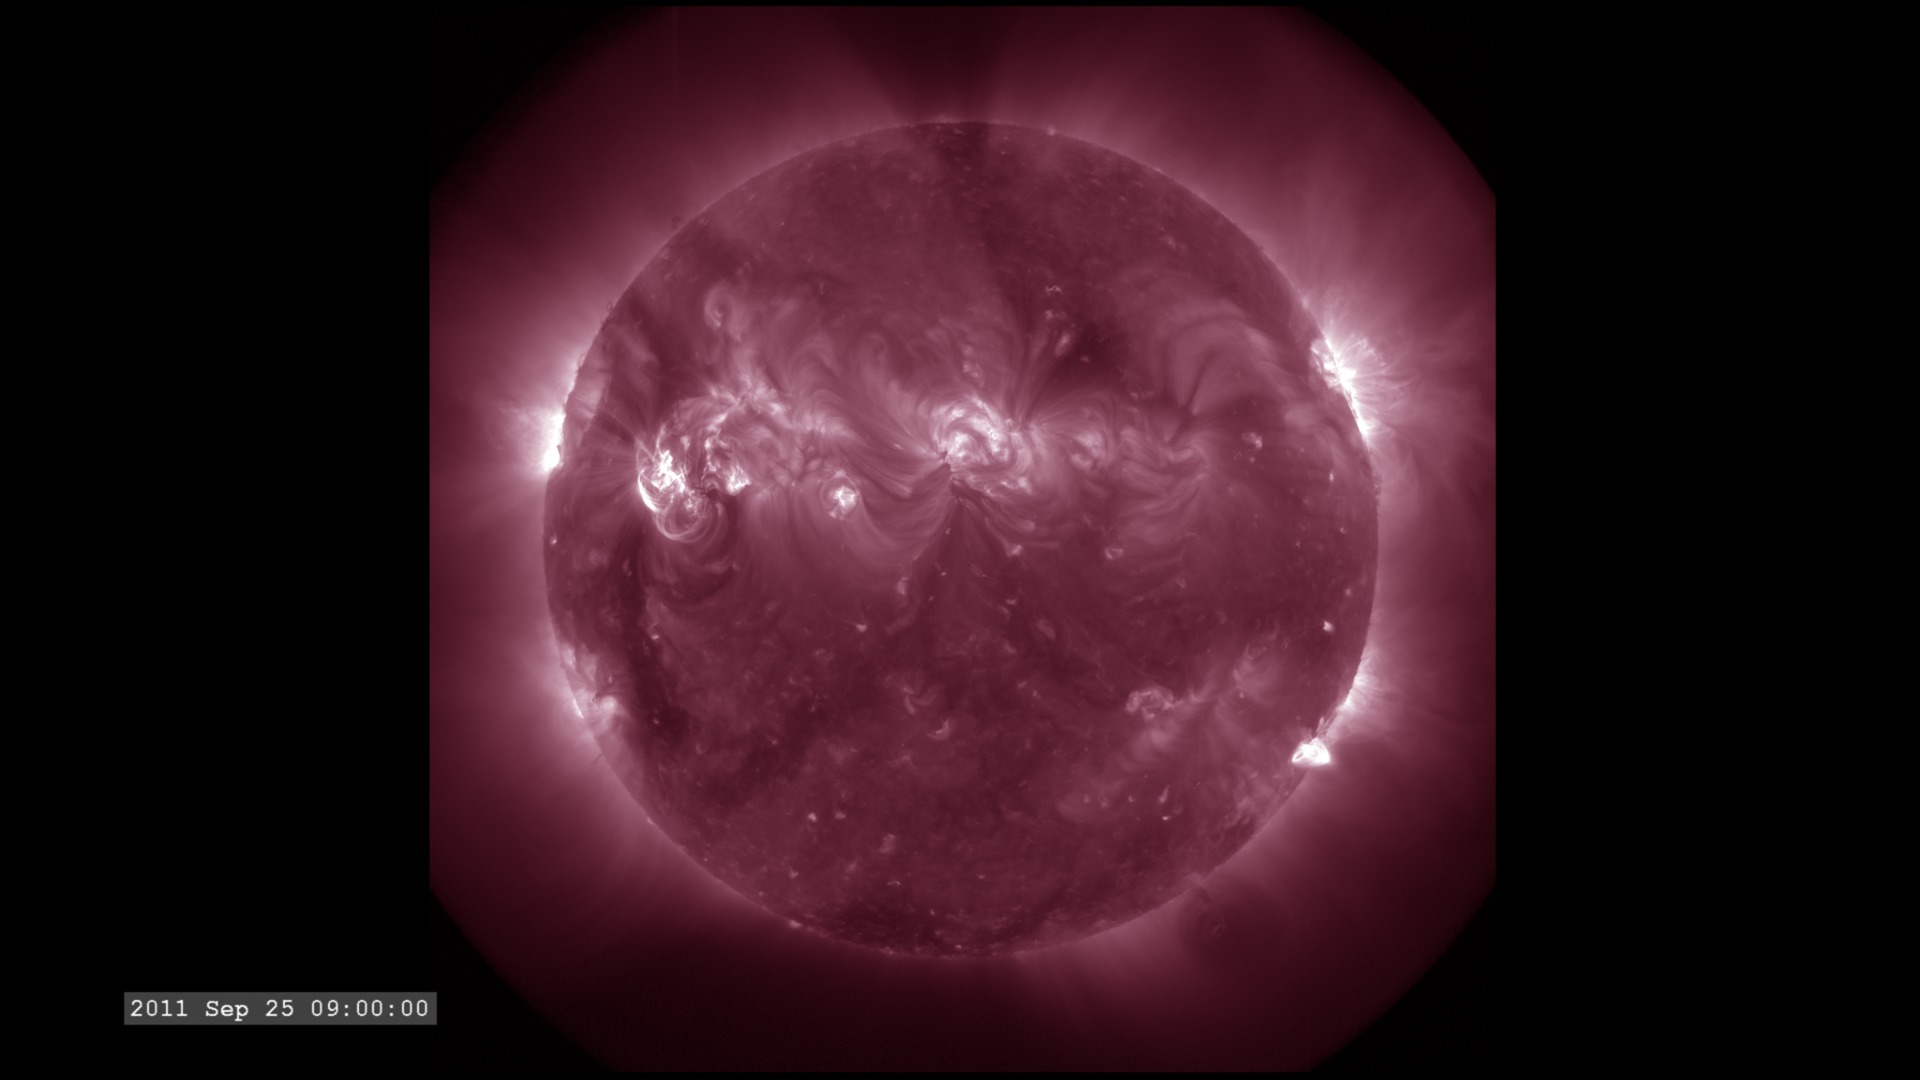
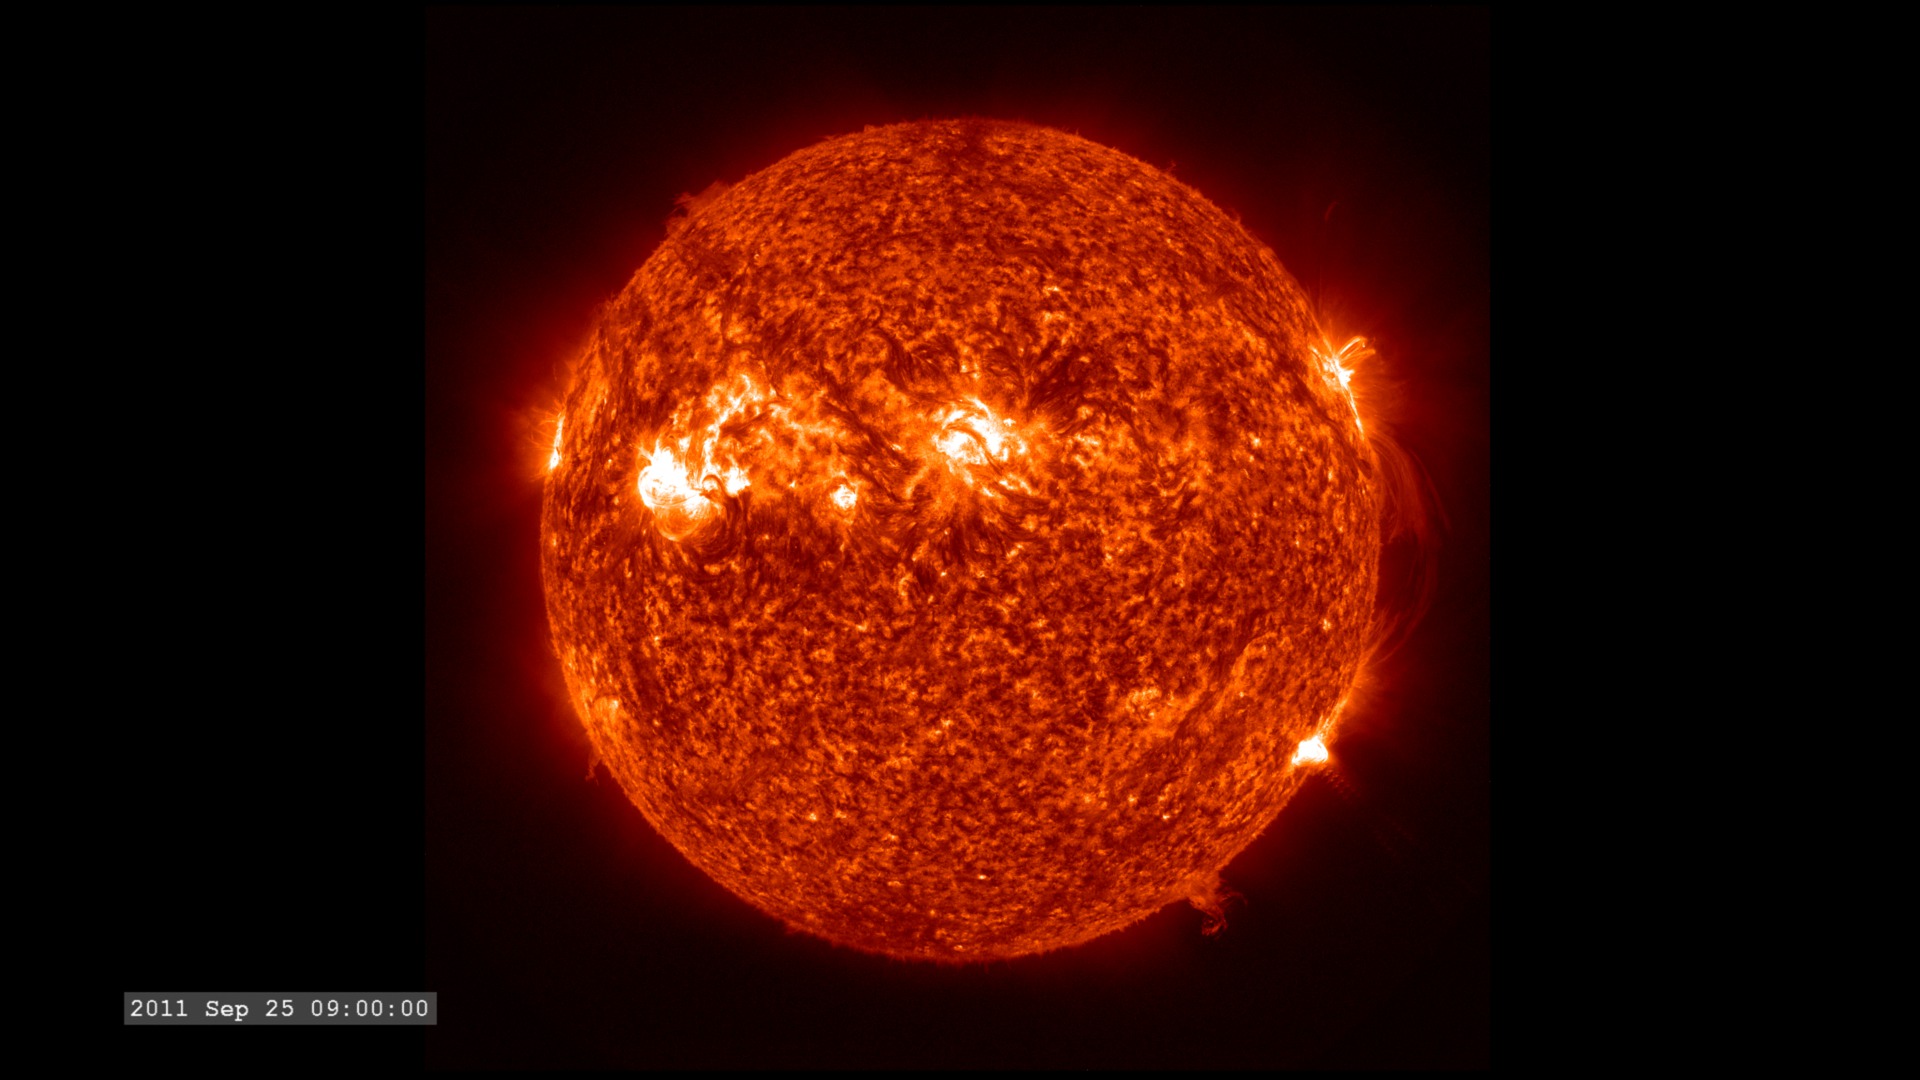
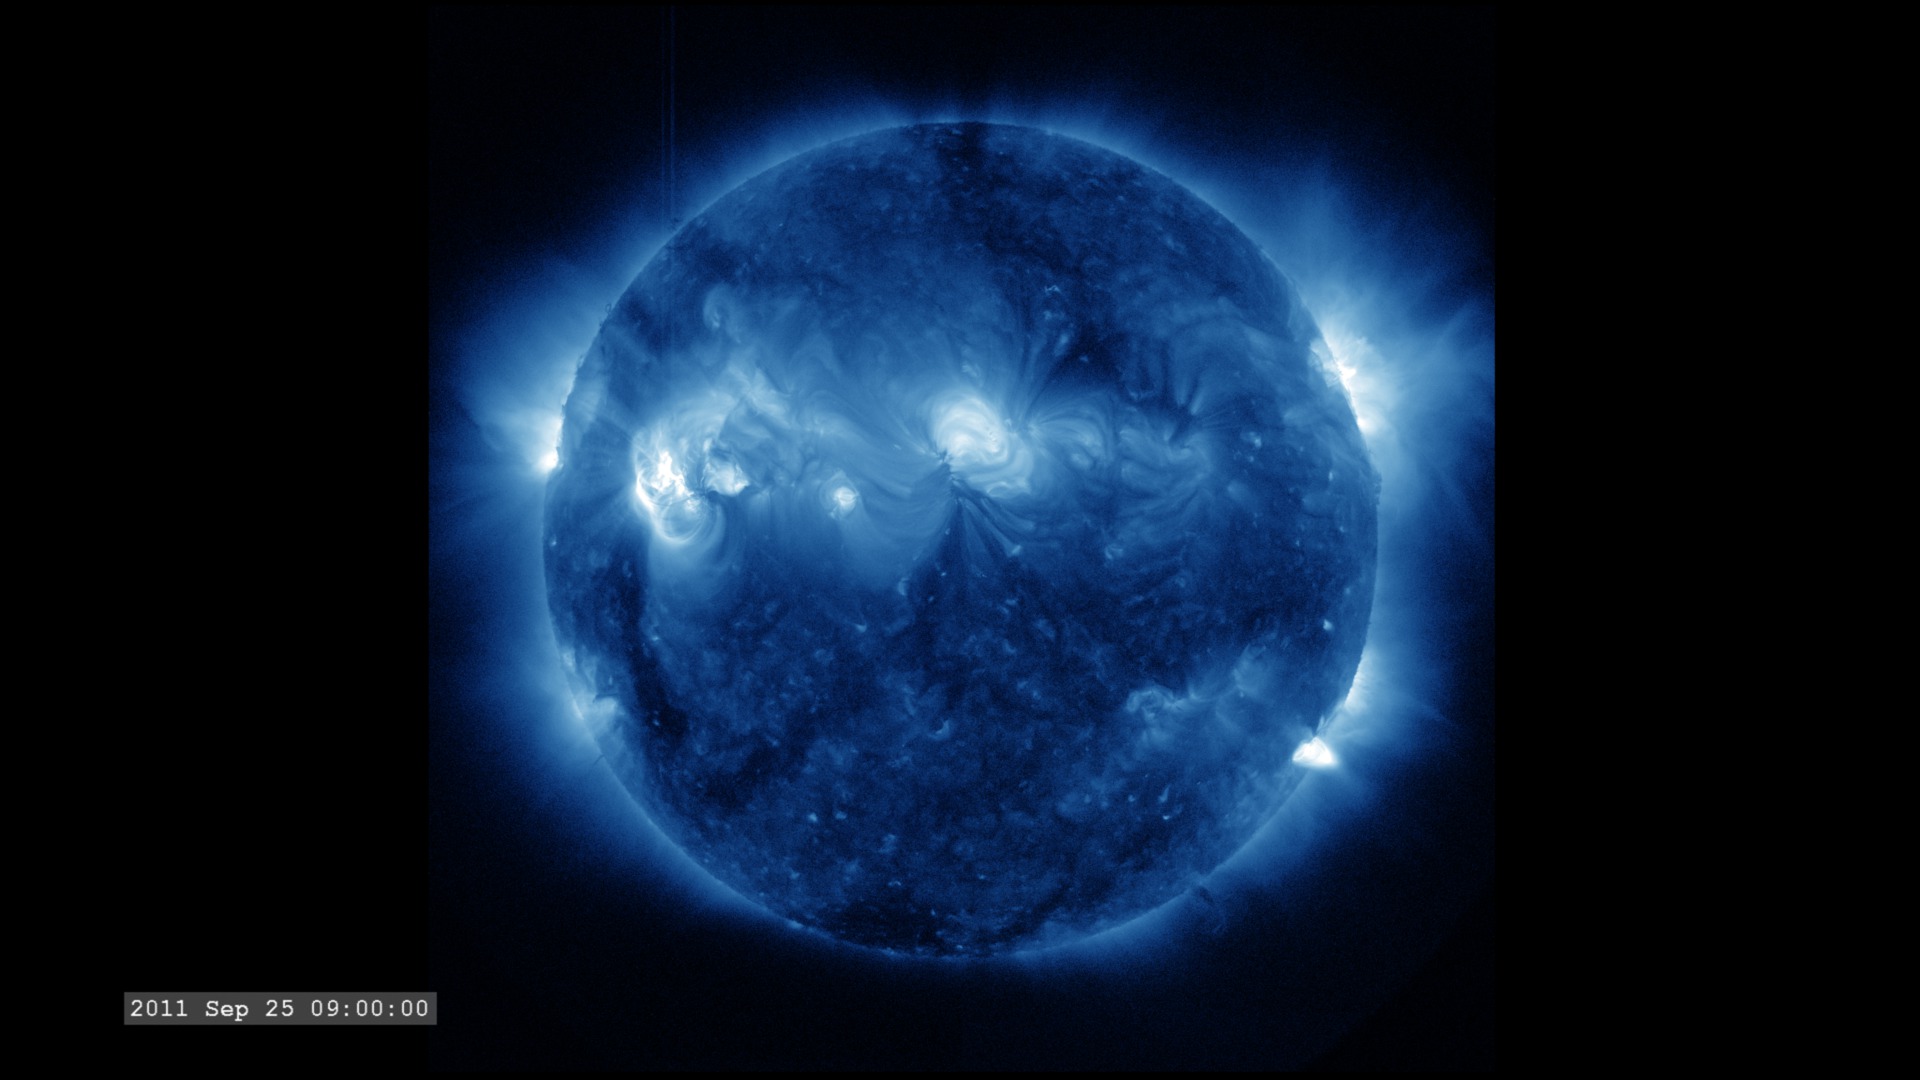
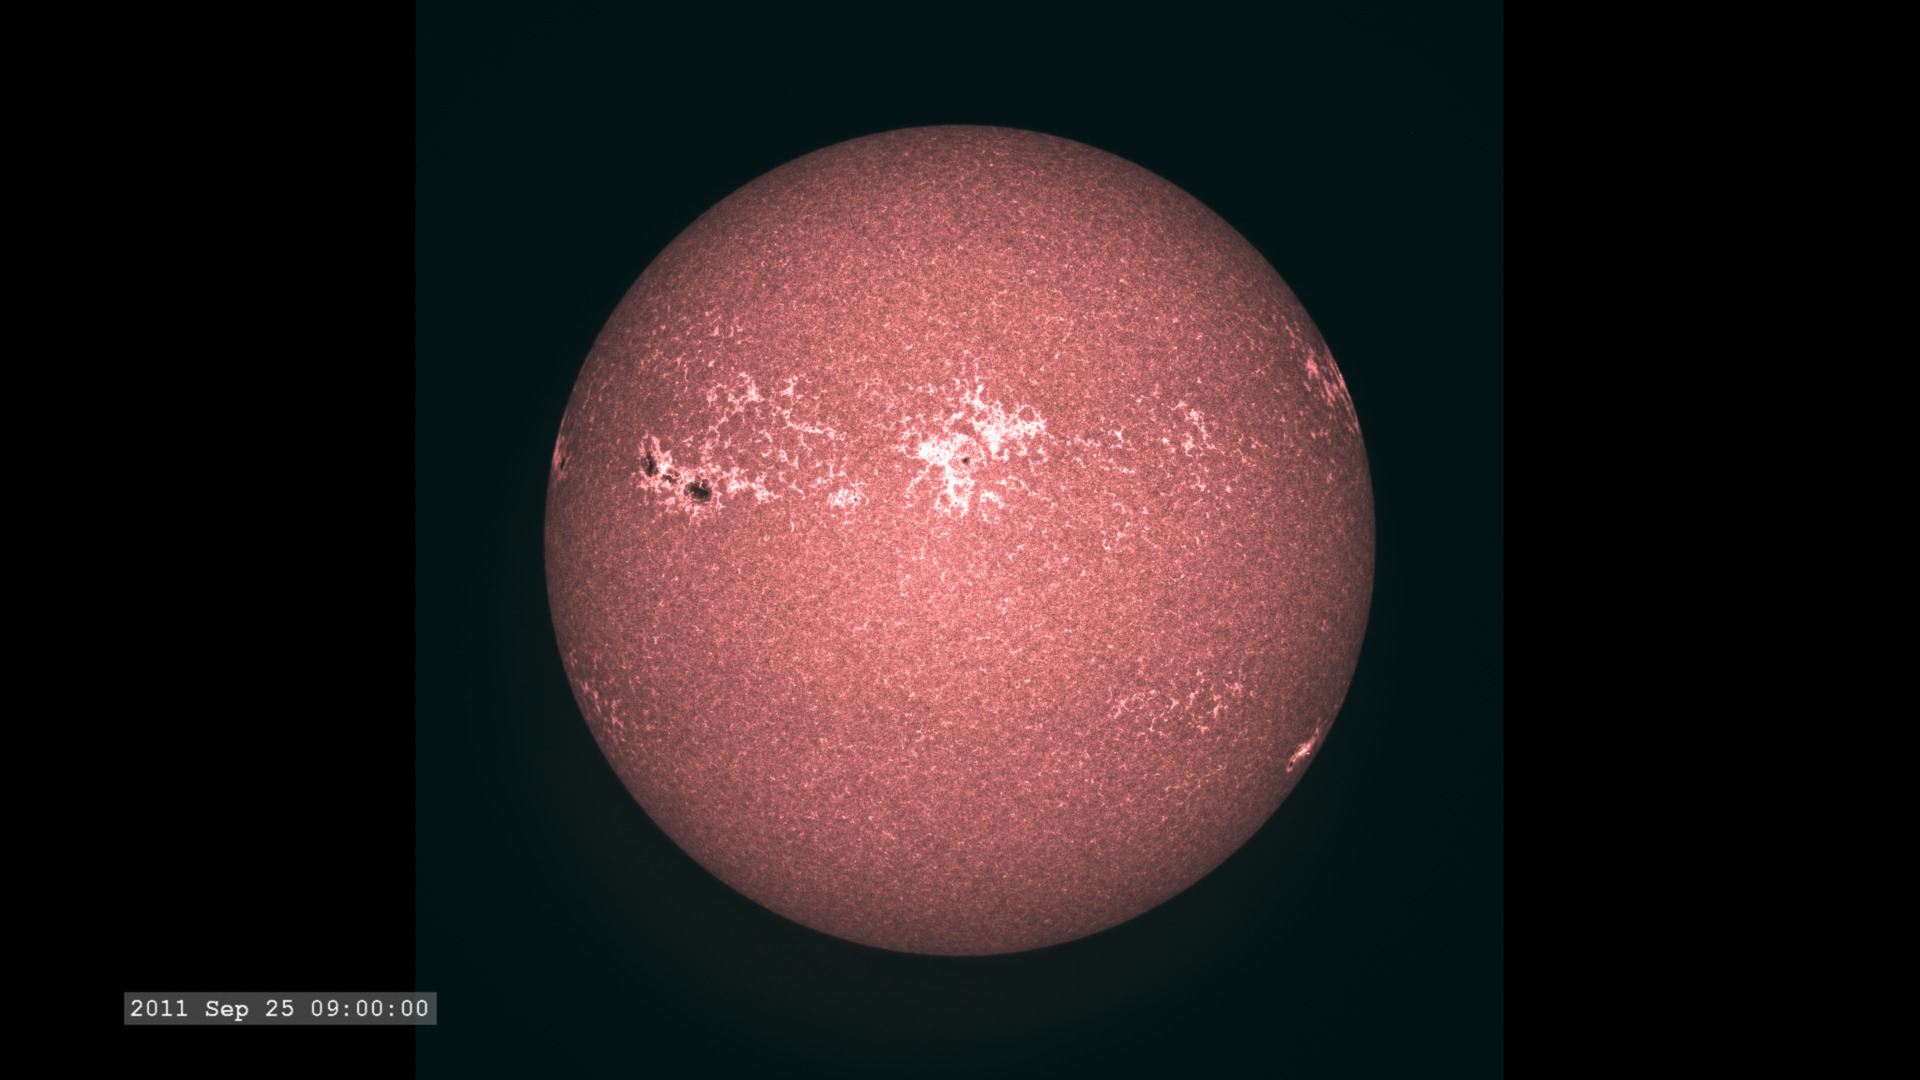
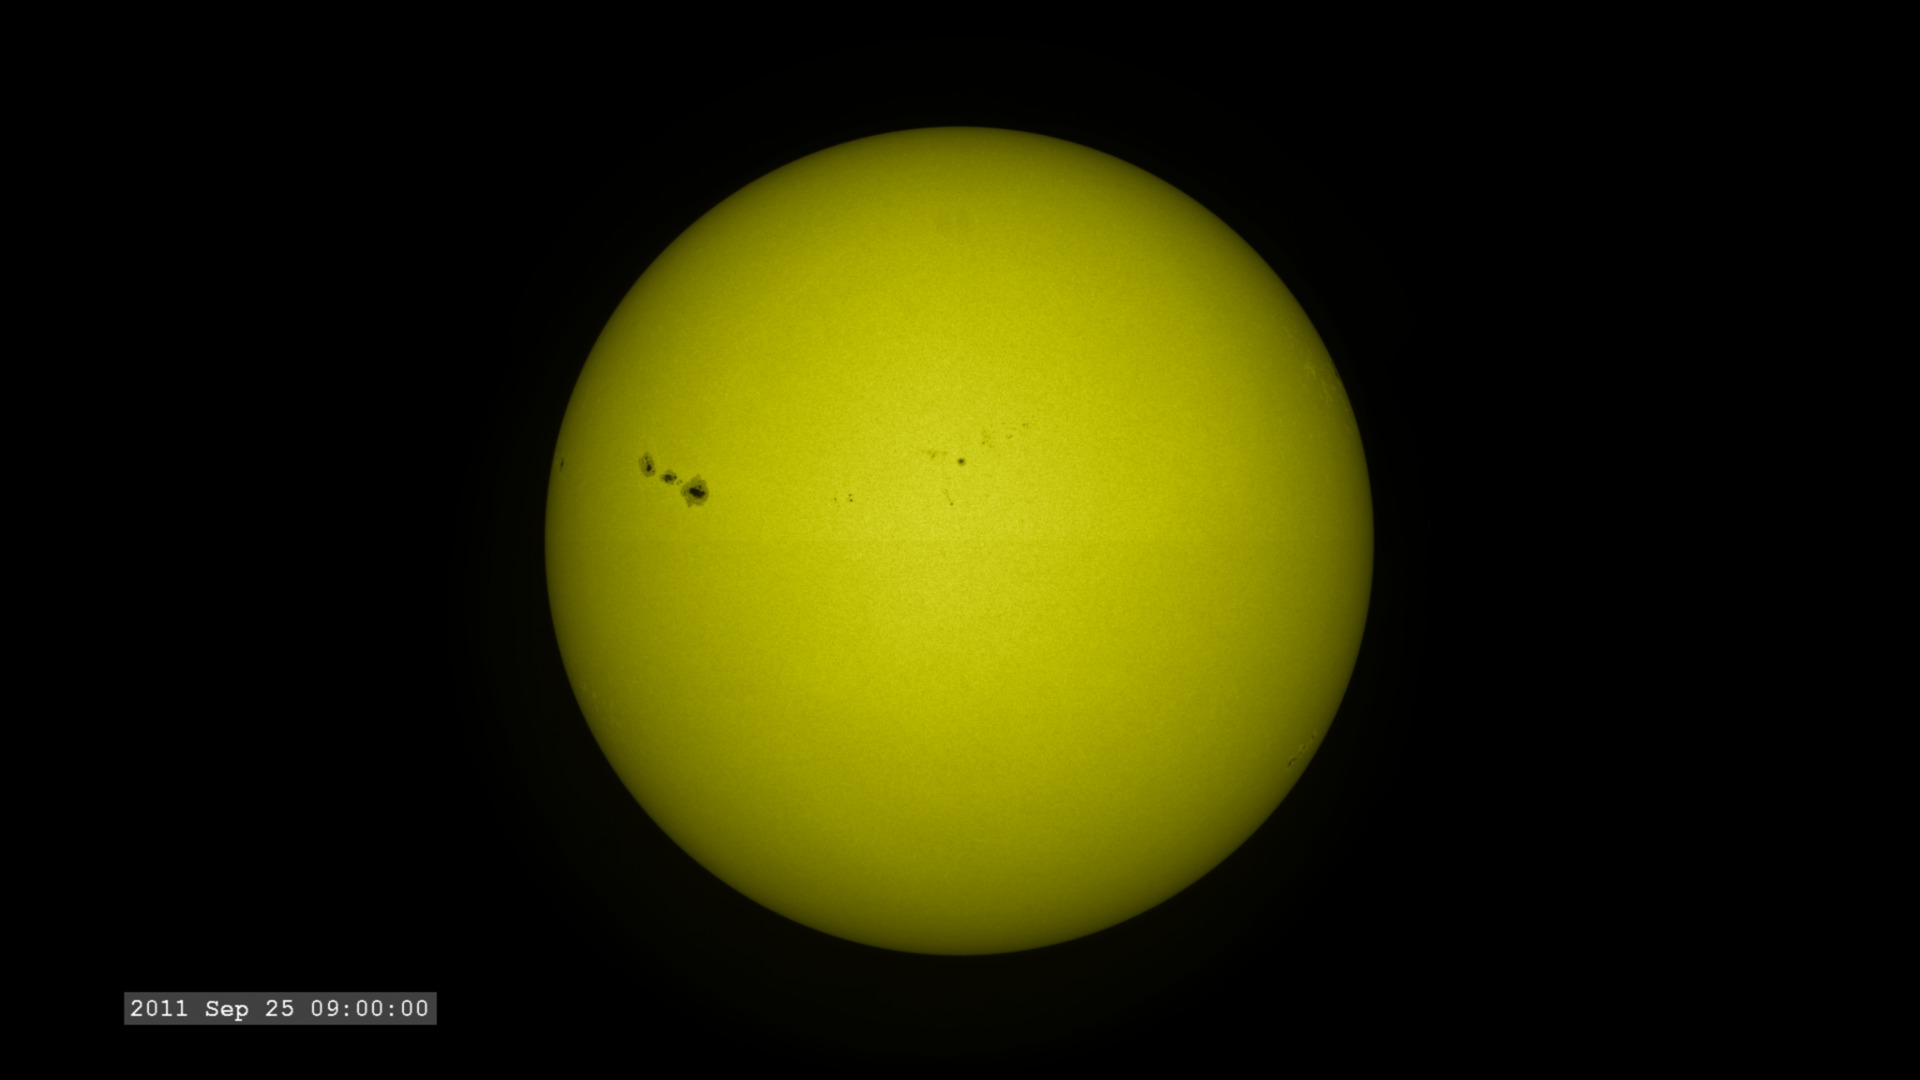
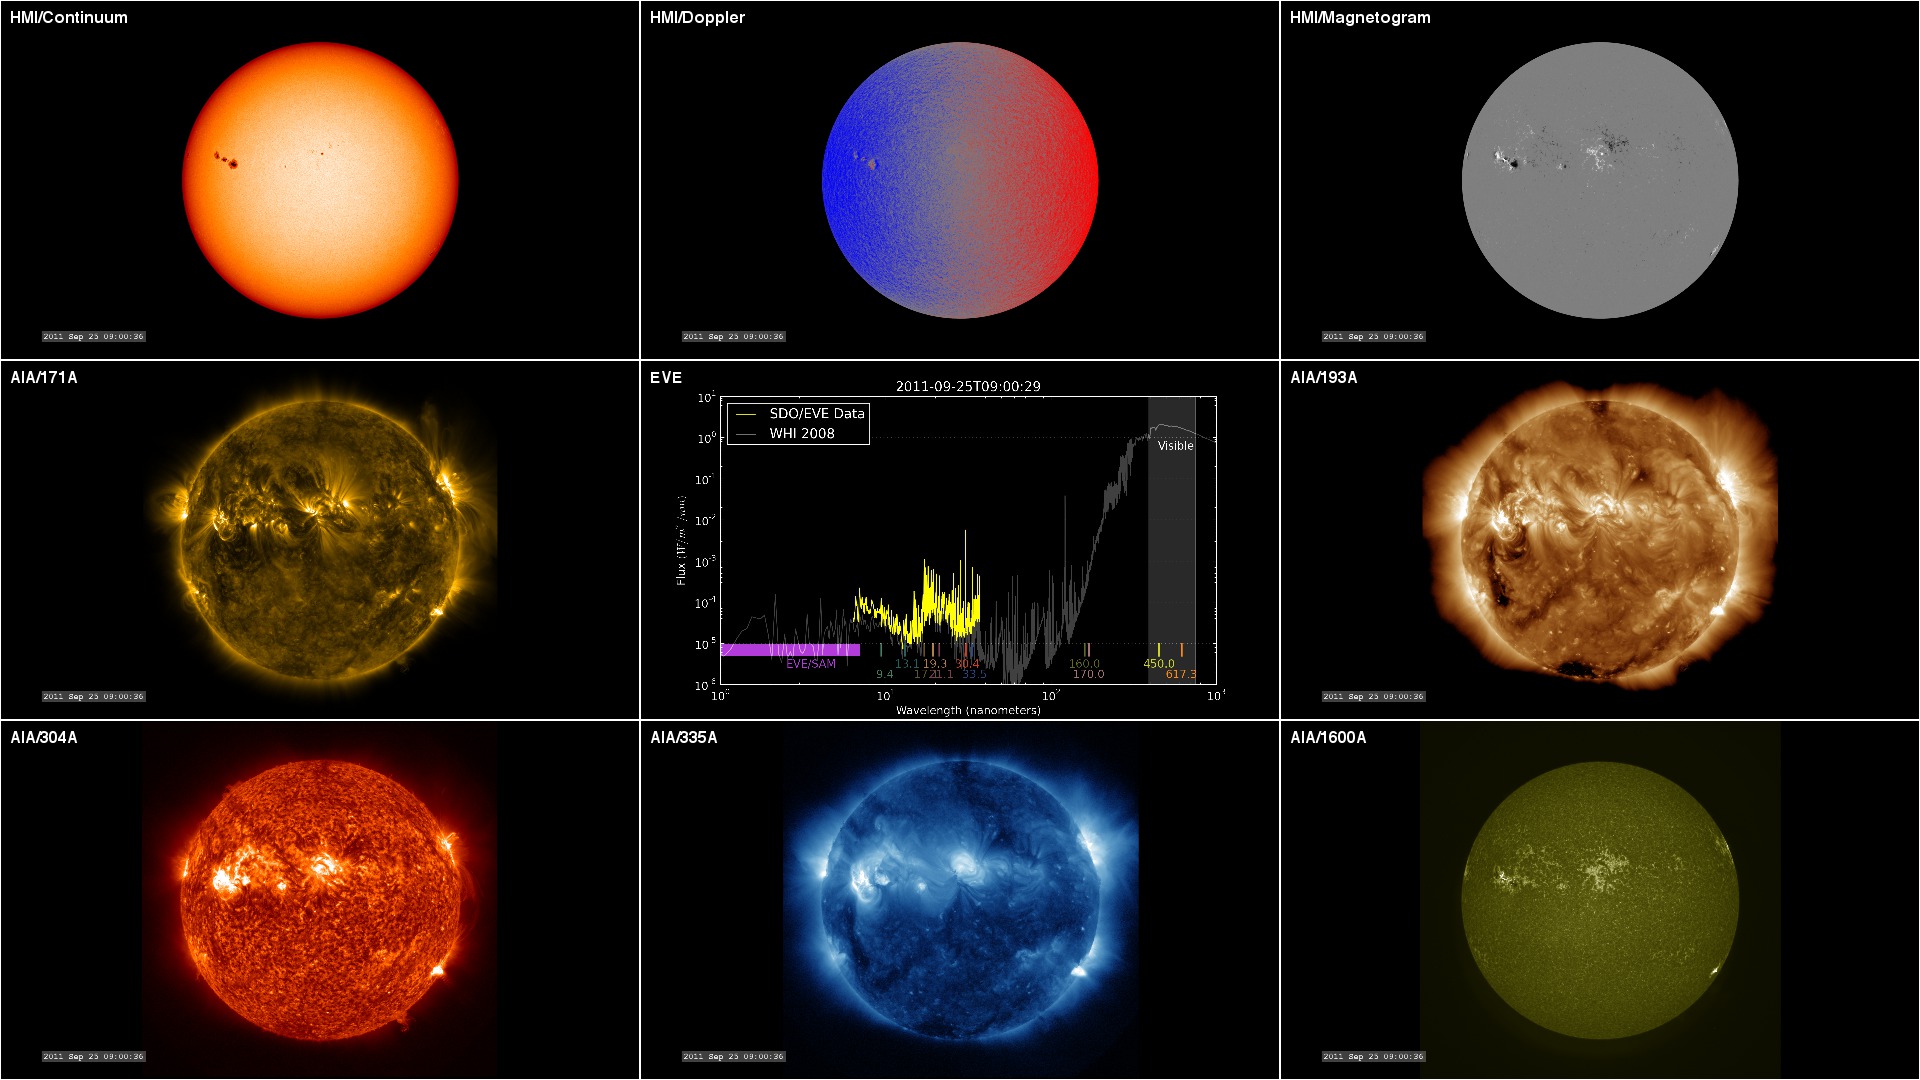
The Solar Dynamics Observatory (SDO) observes the Sun with many different instruments, in many different wavelengths of light. Many of these capabilities are not possible for ground-based observatories - hence the need for a space-based observing platform.
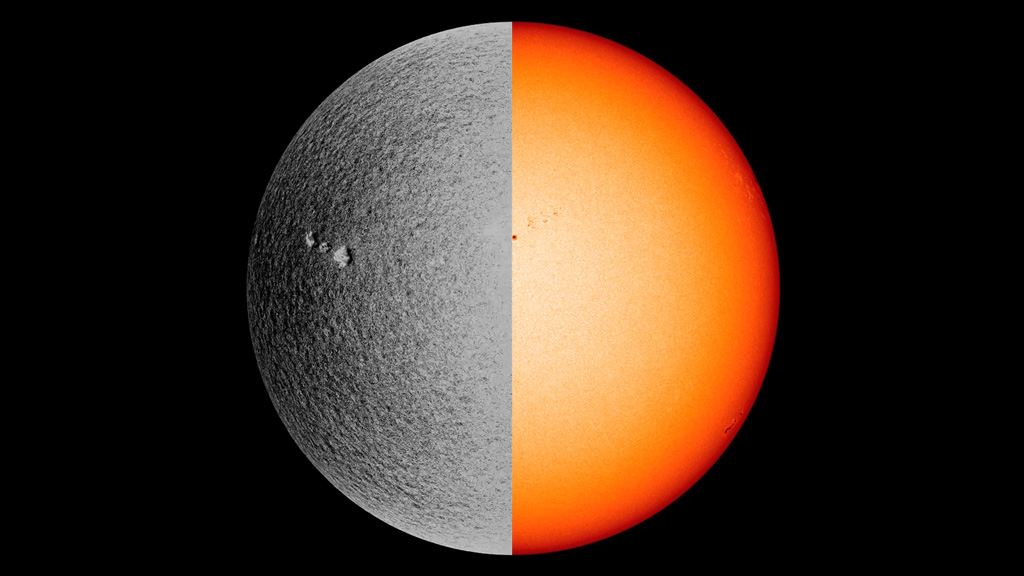
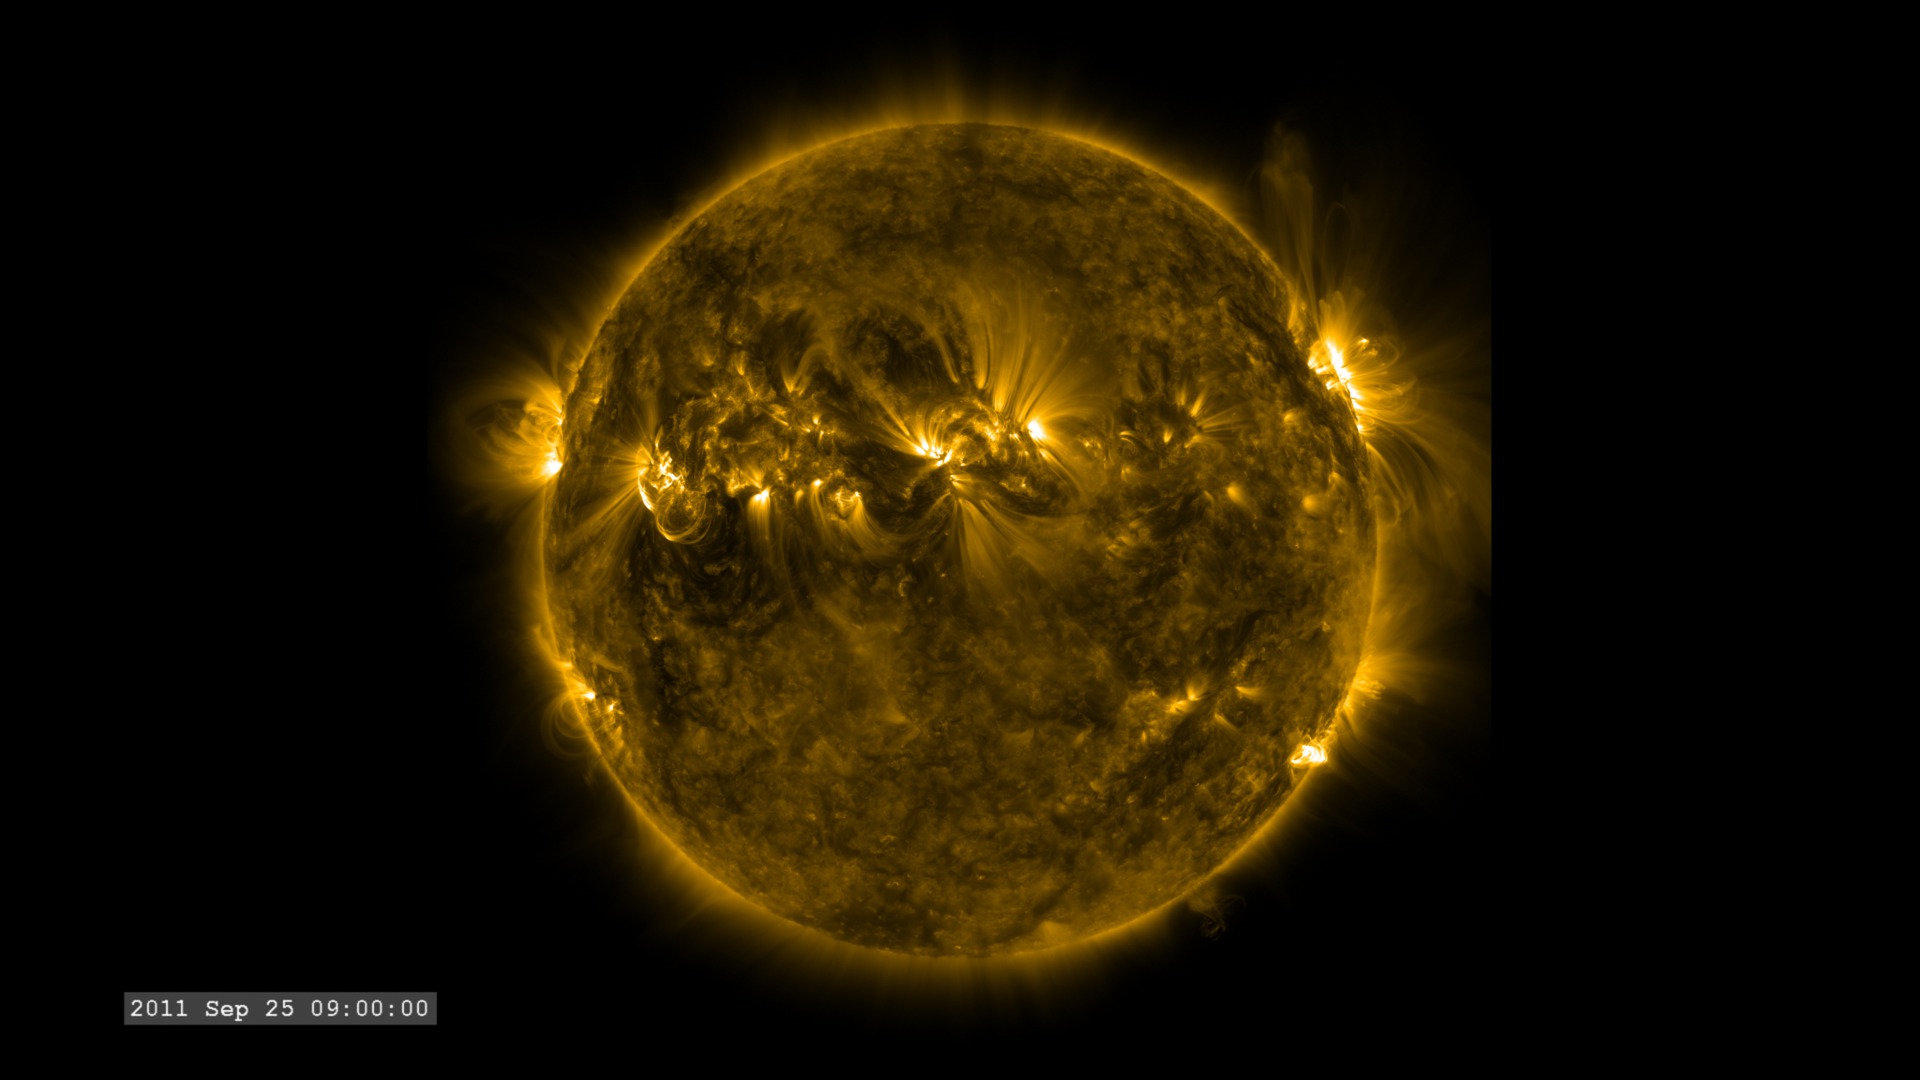
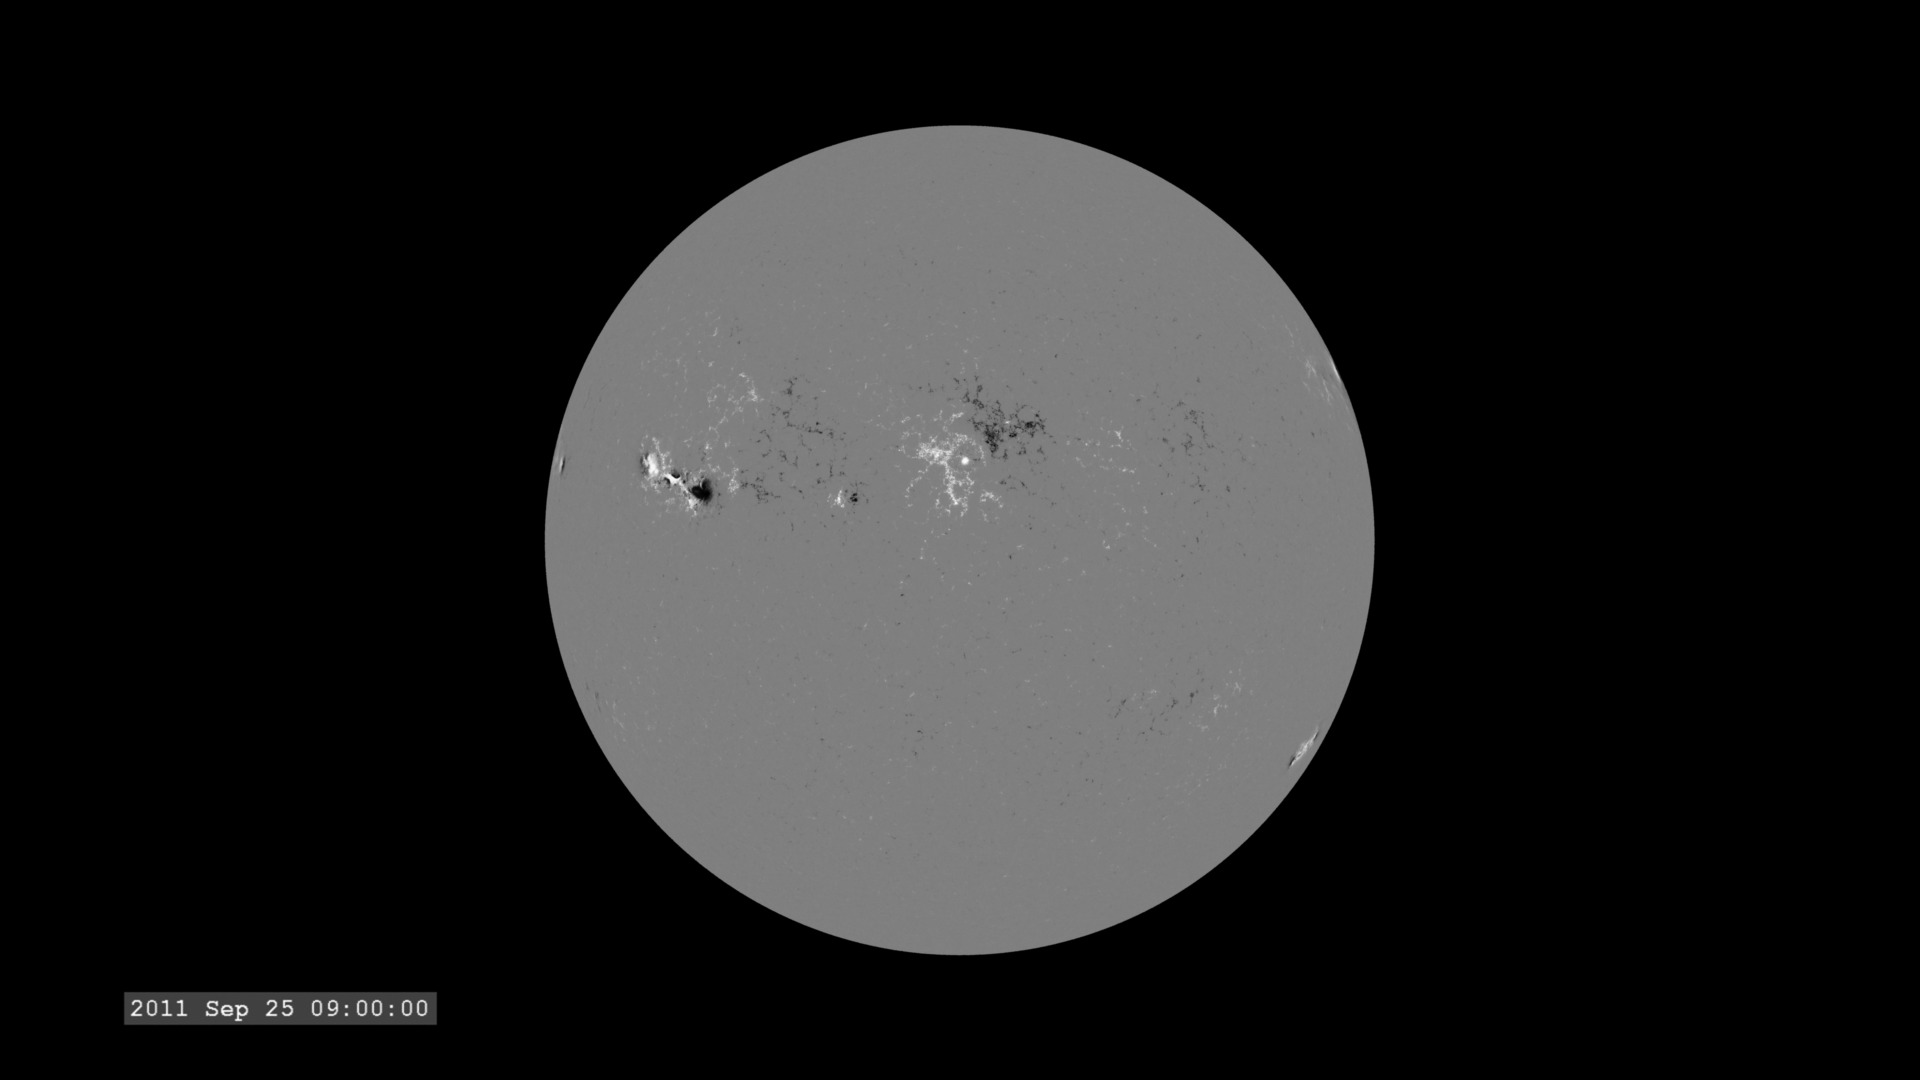
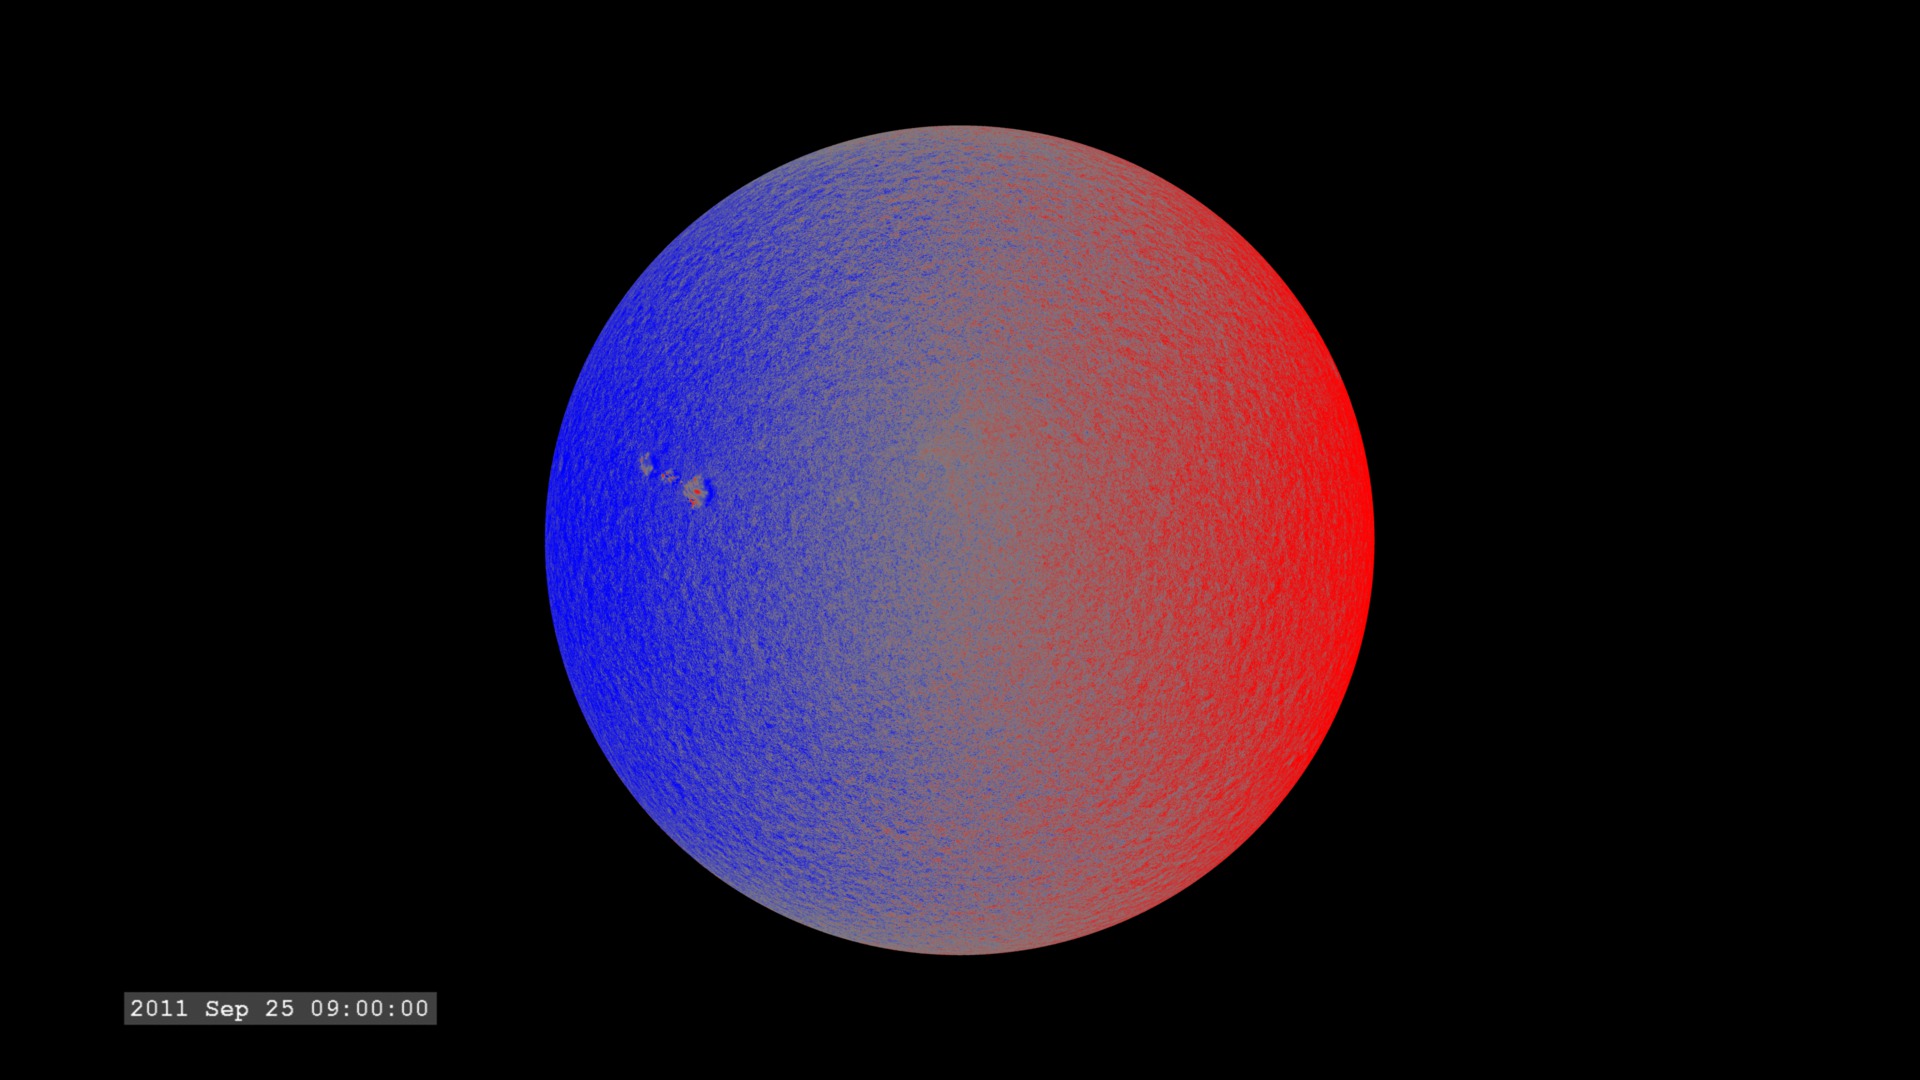
The Helioseismic Magnetic Imager (HMI) aboard the Solar Dynamics Observatory takes a series of images every 45 seconds in a very narrow range of wavelengths in visible light of the solar photosphere. The wavelengths correspond to a region around the 6173 Ångstroms (617.3 nanometers) spectral line of neutral iron (Fe I). From this series of images, it constructs a set of images which extract other characteristics of the photosphere. For this dataset, it shows the solar photosphere in visible light.
This visualization is one of a set of visualizations (others linked below) covering the same time span of 17 hours over the full wavelength range of the mission. They are setup to play synchronously on a Hyperwall, or can be run individually.
The images are sampled every 36 seconds, 1/3 of the standard time-cadence for SDO. This visualization is useful for illustrating how different solar phenomena, such as sunspots and active regions, look very different in different wavelengths of light. These differences enable scientists to study them more completely, with an eventual goal of improving Space Weather forecasting.
Stand-alone movies of HMI intensity imagery.
Full-resolution 4Kx4K frames and 1Kx1K preview movies.
Credits
Please give credit for this item to:
NASA/Goddard Space Flight Center Scientific Visualization Studio, the SDO Science Team, and the Virtual Solar Observatory.
-
Animator
- Tom Bridgman (Global Science and Technology, Inc.)
-
Producers
- Scott Wiessinger (USRA)
- Genna Duberstein (USRA)
-
Scientist
- Phil Chamberlin (NASA/GSFC)
Missions
This page is related to the following missions:Series
This page can be found in the following series:Datasets used
-
SDO Continuum (Continuum) [SDO: HMI]
ID: 674
Note: While we identify the data sets used on this page, we do not store any further details, nor the data sets themselves on our site.
Related
- ID: 11840
 Produced Video
 - ID: 4009
- ID: 3978
 Visualization
 - ID: 3979
 Visualization
 - ID: 3980
 Visualization
 - ID: 3981
 Visualization
 - ID: 3982
 Visualization
 - ID: 3983
 Visualization
 - ID: 3984
 Visualization
 - ID: 3985
 Visualization
 - ID: 3986
 Visualization
 - ID: 3987
 Visualization
 - ID: 3989
 Visualization
 - ID: 3990
 Visualization
 - ID: 4008
 Visualization
Release date
This page was originally published on Tuesday, November 20, 2012.
This page was last updated on Sunday, February 2, 2025 at 10:08 PM EST.