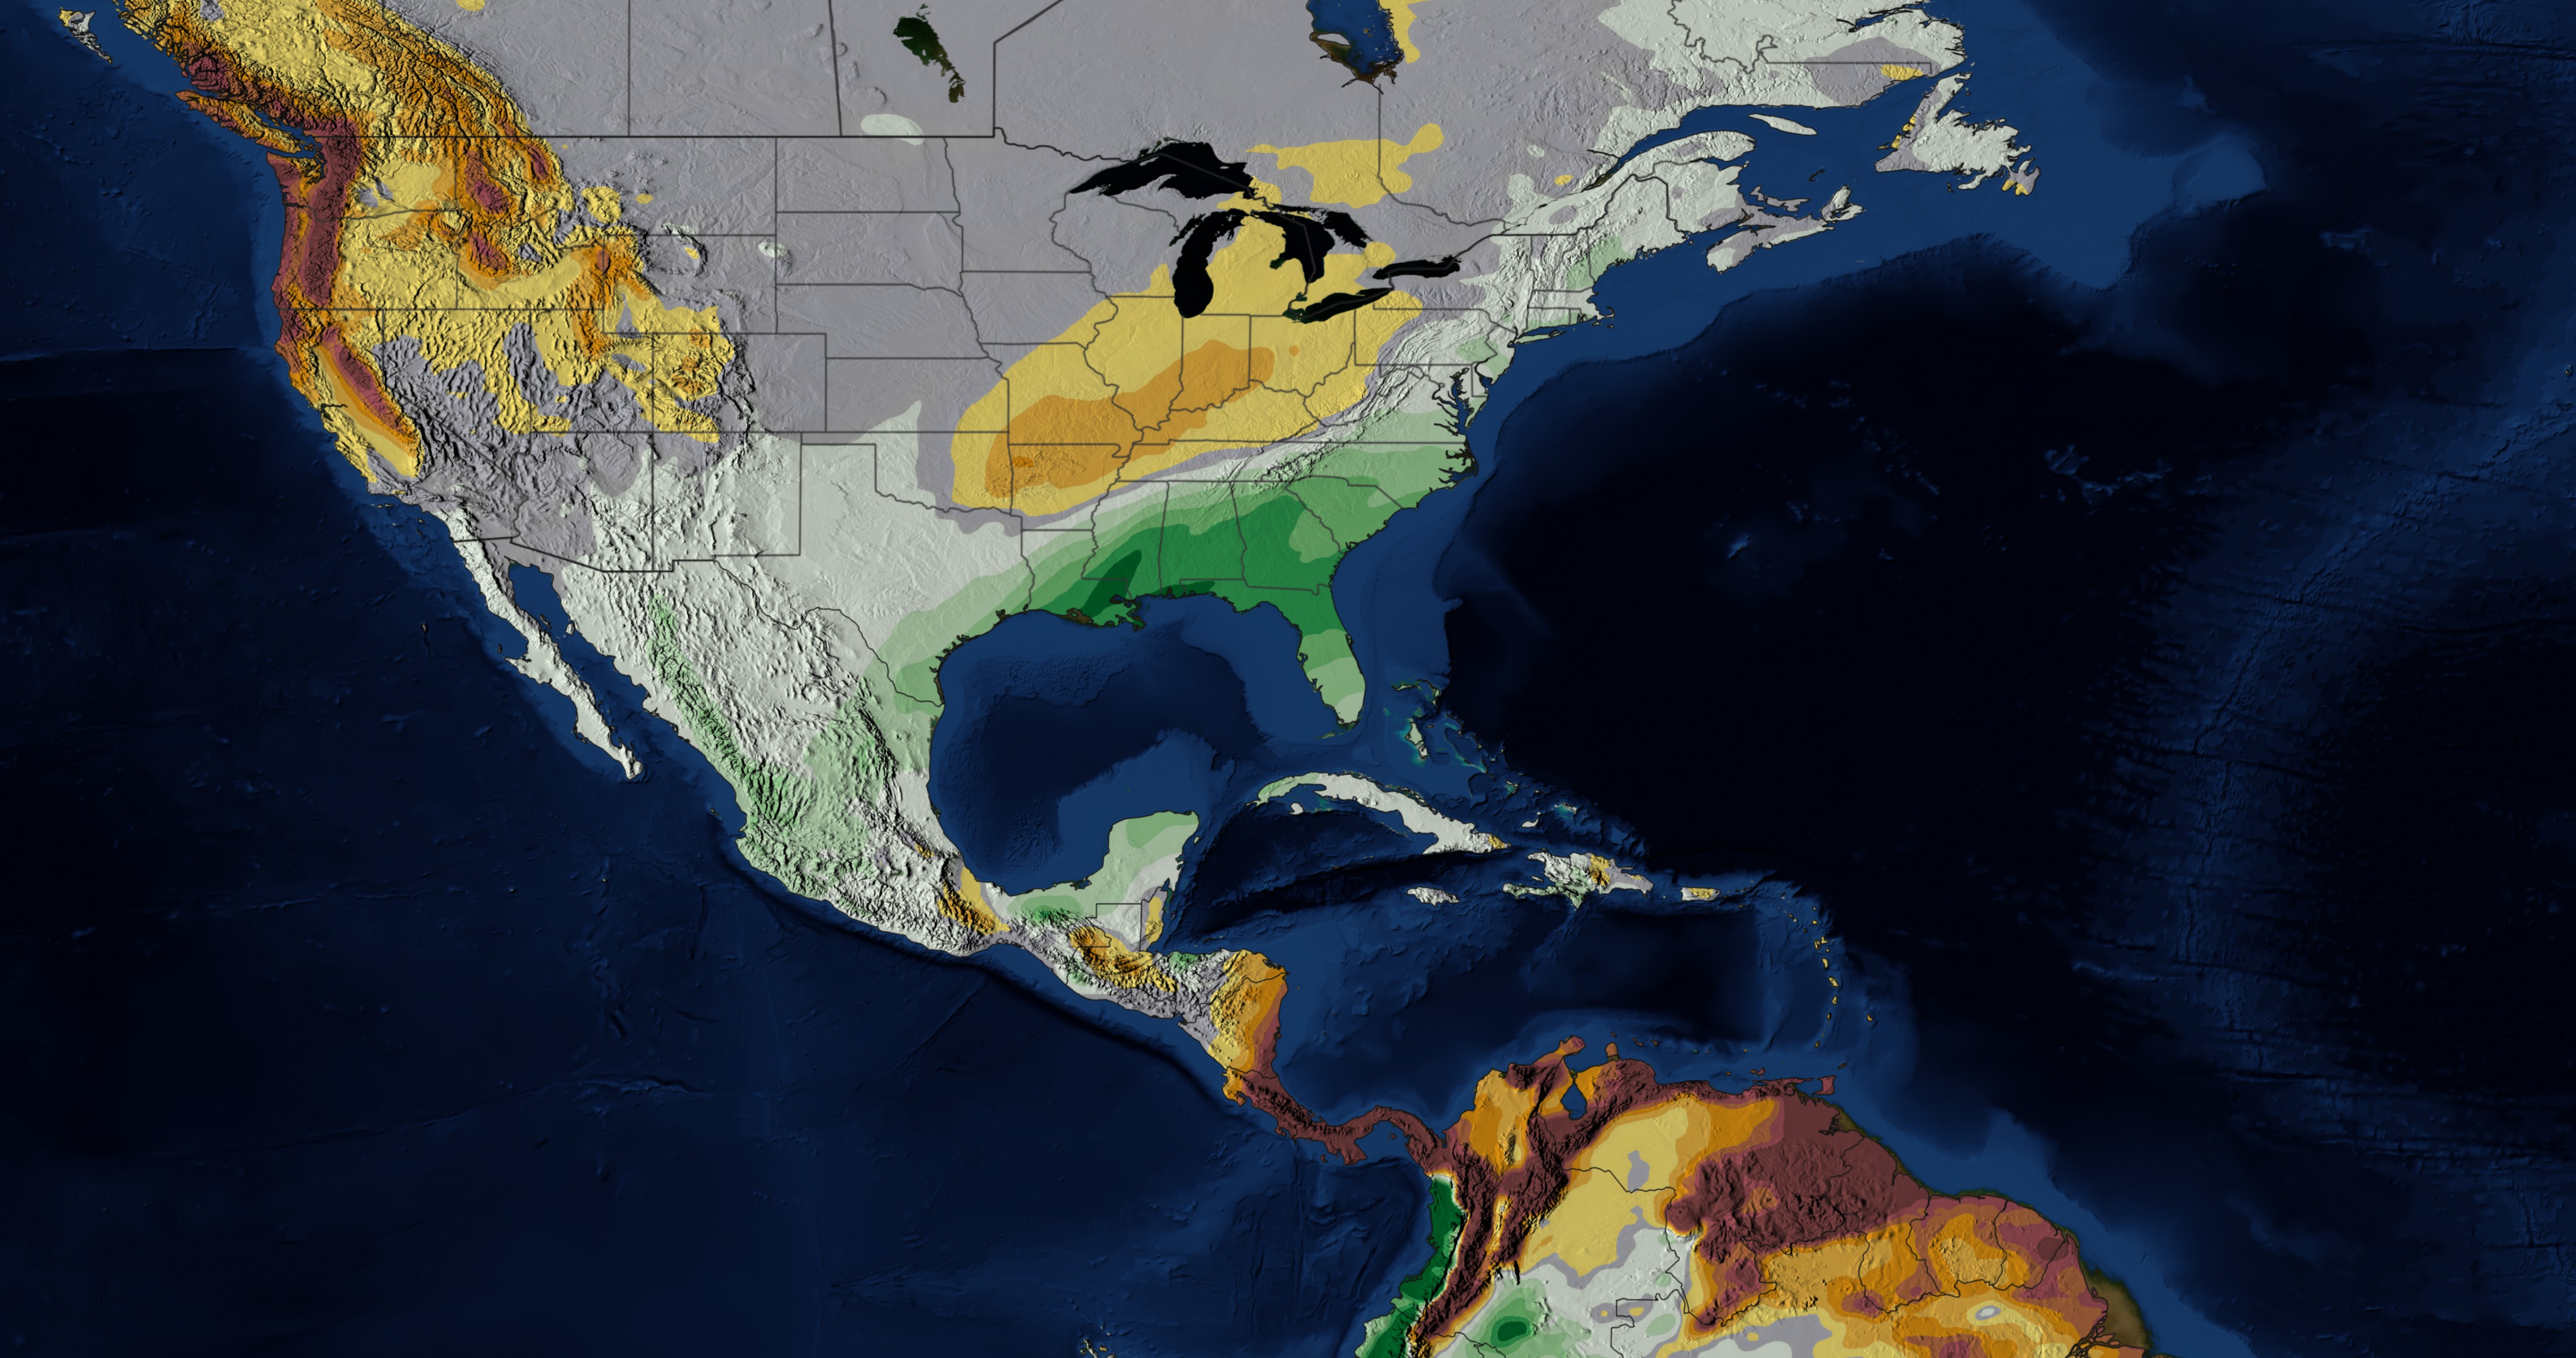
Modeled Precipitation Difference Between 2010 Snowmageddon Event and Winter of 2000
The resulting findings were that GEOS-5 simulations forced with observed Sea Surface Temperatures (SST) reproduce observed changes, including enhanced storminess along the United States east coast. The ensemble members showed that this is a robust response, and verified that anomalous weather events over the U.S. are, to a large extent, driven by El Niño SST. Furthermore, North Atlantic SST contributes to the coolor (snow-producing) temperatures along the U.S. east coast.
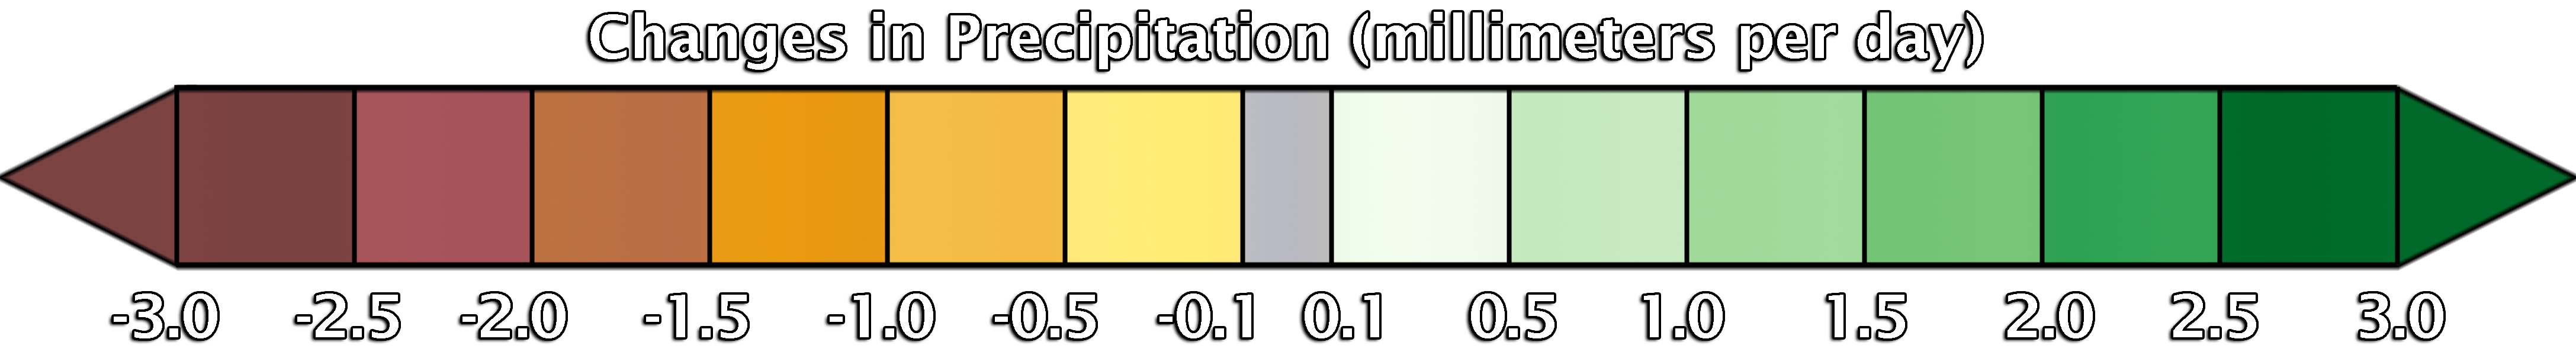
By subtracting the results of the 1999-2000 runs from the 2009-2010 a difference map can be generated showing the areas that received more precipitation and areas that received less precipitation. Areas that received more precipitation in 2009-2010 over 1999-2000 are depicted in shades of green. Areas that received less precipitation between these two winters are depicted in shades of brown.

Visualization Credits
Malissa Reyes (USRA): Producer
Ryan Fitzgibbons (USRA): Producer
Siegfried D. Schubert (NASA/GSFC): Scientist
Yehui Chang (Morgan State University): Scientist
Michele Rienecker (NASA/GSFC): Scientist
NASA/Goddard Space Flight Center Scientific Visualization Studio
https://svs.gsfc.nasa.gov/3903
Data Used:
Attribution of the Extreme U.S. East Coast Snowstorm Activity of 2010/PRECTOT (mm./day) also referred to as: Total Precipitation (mm./day)
Model - NASAThis item is part of this series:
Precipitation
Keywords:
DLESE >> Atmospheric science
DLESE >> Cryology
SVS >> HDTV
GCMD >> Earth Science >> Atmosphere >> Precipitation >> Precipitation Anomalies
GCMD >> Earth Science >> Atmosphere >> Precipitation >> Snow
GCMD >> Earth Science >> Climate Indicators >> Teleconnections >> El Nino Southern Oscillation
NASA Science >> Earth
GCMD keywords can be found on the Internet with the following citation: Olsen, L.M., G. Major, K. Shein, J. Scialdone, S. Ritz, T. Stevens, M. Morahan, A. Aleman, R. Vogel, S. Leicester, H. Weir, M. Meaux, S. Grebas, C.Solomon, M. Holland, T. Northcutt, R. A. Restrepo, R. Bilodeau, 2013. NASA/Global Change Master Directory (GCMD) Earth Science Keywords. Version 8.0.0.0.0


