Sun
ID: 3898
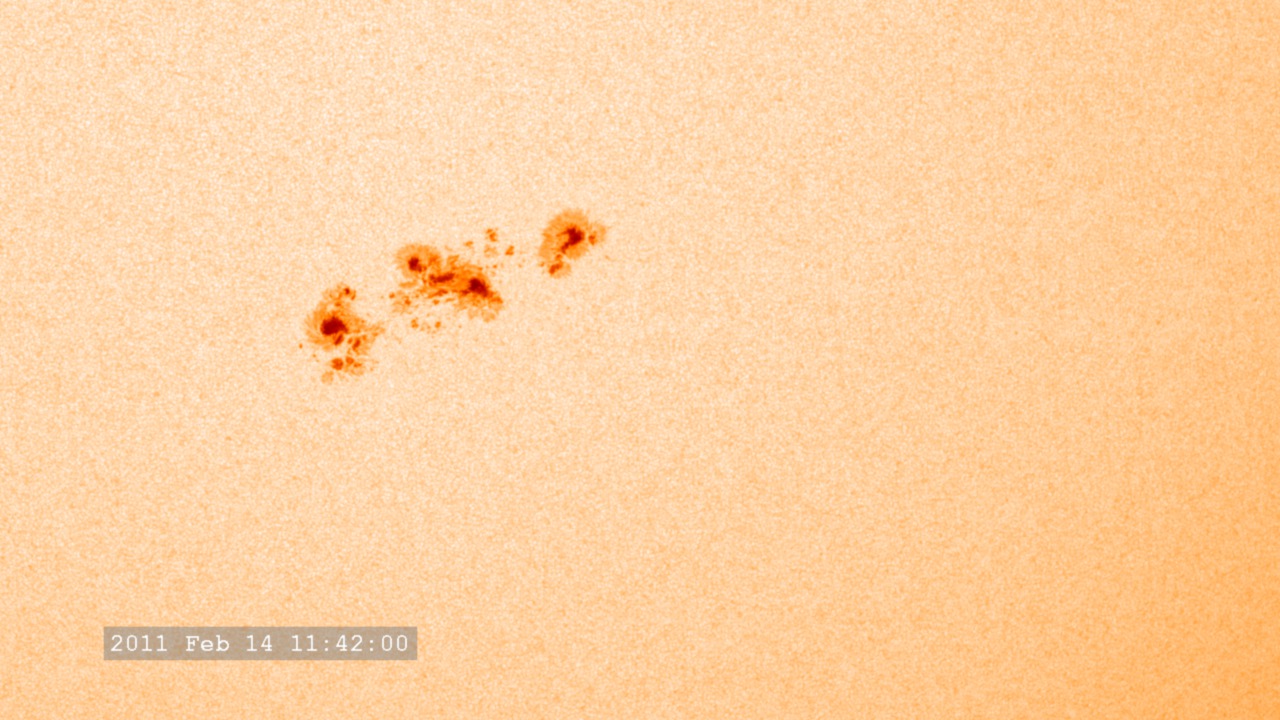
This visualization tracks the emergence and evolution of a sunspot group as seen by SDO/HMI starting in early February 2011 and continuing for two weeks. Images are sampled one hour apart.
In this version, the camera tracks the movement of the solar rotation.
At this scale, a 'shimmer' of the solar surface is visible, created by the turnover of convection cells. A higher-resolution view of these convection cells can be seen in Hinode imagery (see entry #3412, Hinode's High-resolution view of solar granulation).
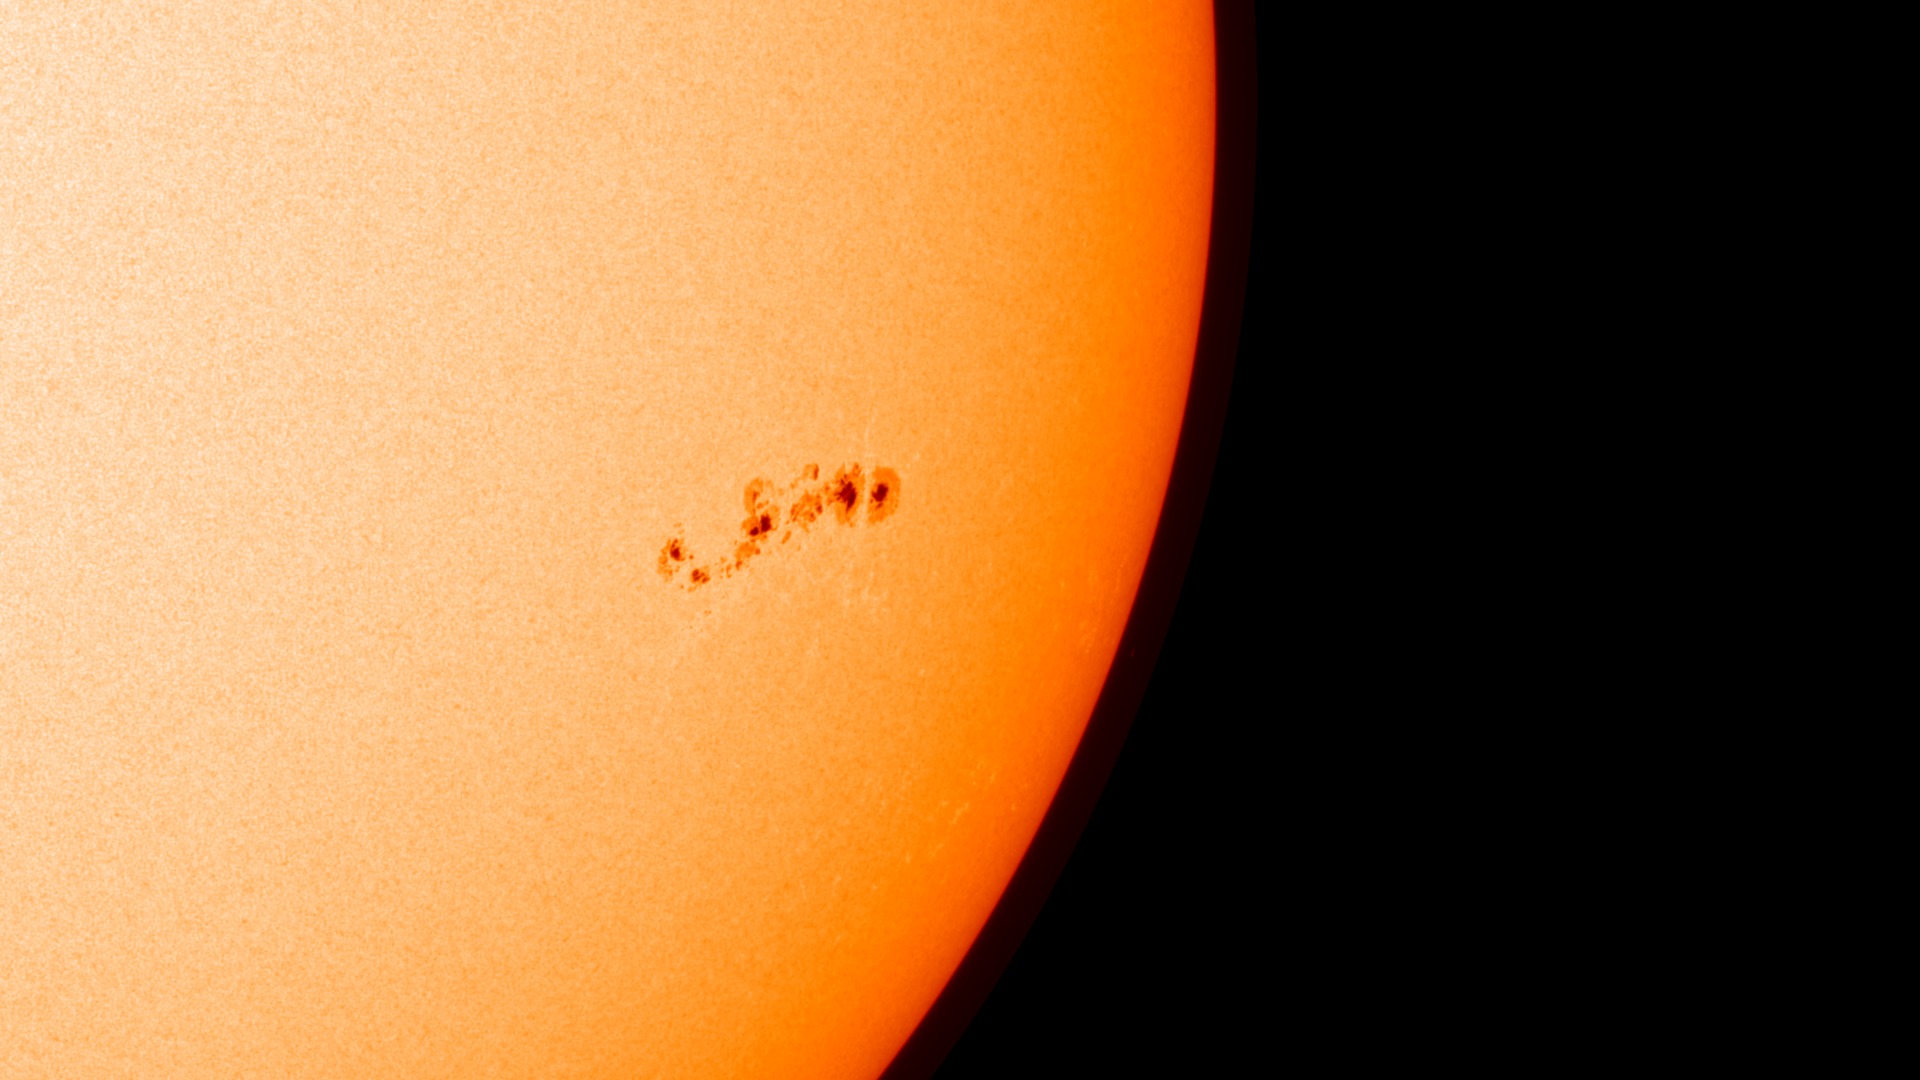
For a full-disk view of the Sun, covering the same time frame, see entry #3897, Growing Sunspots - A Full Disk View: February 2011.
Growing Sunspots - Tracking Closeup: February 2011
In this version, the camera tracks the movement of the solar rotation.
At this scale, a 'shimmer' of the solar surface is visible, created by the turnover of convection cells. A higher-resolution view of these convection cells can be seen in Hinode imagery (see entry #3412, Hinode's High-resolution view of solar granulation).
For a full-disk view of the Sun, covering the same time frame, see entry #3897, Growing Sunspots - A Full Disk View: February 2011.
Visualization Credits
Please give credit for this item to:
NASA/Goddard Space Flight Center Scientific Visualization Studio
NASA/Goddard Space Flight Center Scientific Visualization Studio
Short URL to share this page:
https://svs.gsfc.nasa.gov/3898
Mission:
SDO
Data Used:
Note: While we identify the data sets used in these visualizations, we do not store any further details nor the data sets themselves on our site.
This item is part of this series:
SDO - Visualizations
Keywords:
SVS >> HDTV
GCMD >> Earth Science >> Sun-earth Interactions >> Solar Activity >> Sunspots
SVS >> SDO
SVS >> Solar Dynamics Observatory
SVS >> Heliophysics
NASA Science >> Sun
SVS >> Visible Light Imaging
GCMD keywords can be found on the Internet with the following citation: Olsen, L.M., G. Major, K. Shein, J. Scialdone, S. Ritz, T. Stevens, M. Morahan, A. Aleman, R. Vogel, S. Leicester, H. Weir, M. Meaux, S. Grebas, C.Solomon, M. Holland, T. Northcutt, R. A. Restrepo, R. Bilodeau, 2013. NASA/Global Change Master Directory (GCMD) Earth Science Keywords. Version 8.0.0.0.0
https://svs.gsfc.nasa.gov/3898
Mission:
SDO
Data Used:
SDO/HMI/Continuum also referred to as: SDO Continuum
2011-02-06 to 2011-02-21This item is part of this series:
SDO - Visualizations
Keywords:
SVS >> HDTV
GCMD >> Earth Science >> Sun-earth Interactions >> Solar Activity >> Sunspots
SVS >> SDO
SVS >> Solar Dynamics Observatory
SVS >> Heliophysics
NASA Science >> Sun
SVS >> Visible Light Imaging
GCMD keywords can be found on the Internet with the following citation: Olsen, L.M., G. Major, K. Shein, J. Scialdone, S. Ritz, T. Stevens, M. Morahan, A. Aleman, R. Vogel, S. Leicester, H. Weir, M. Meaux, S. Grebas, C.Solomon, M. Holland, T. Northcutt, R. A. Restrepo, R. Bilodeau, 2013. NASA/Global Change Master Directory (GCMD) Earth Science Keywords. Version 8.0.0.0.0


