Seasonal sea ice and snow cover visualizations
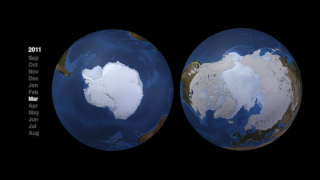
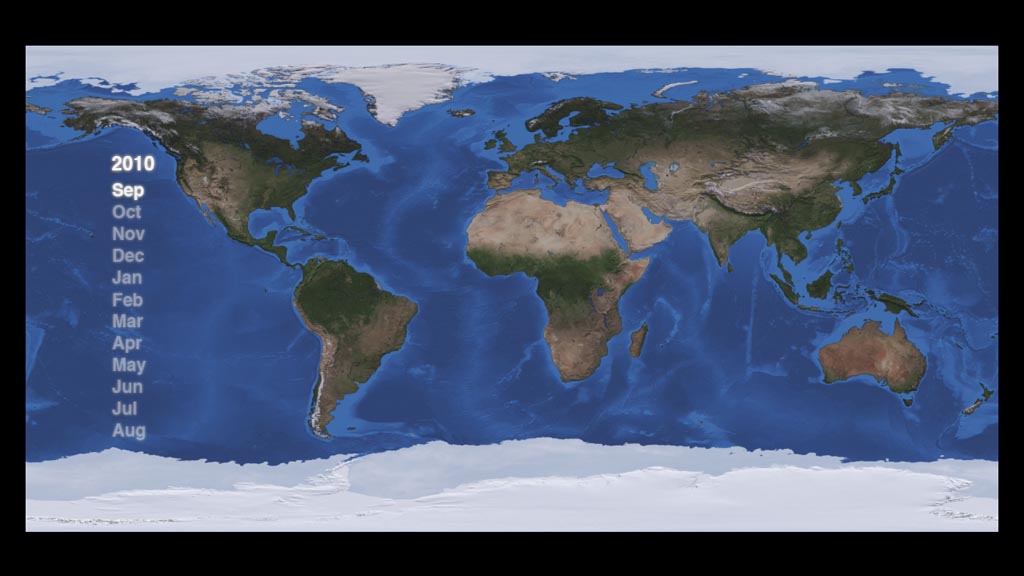
Seasonal snow cover and sea ice across the globe from September 2010 to August 2011

This set of frames provides the background layer only of the seasonal snow cover and sea ice across the globe from September 2010 to August 2011.

This set of frames provides the dates layer only of the seasonal snow cover and sea ice across the globe from September 2010 to August 2011.
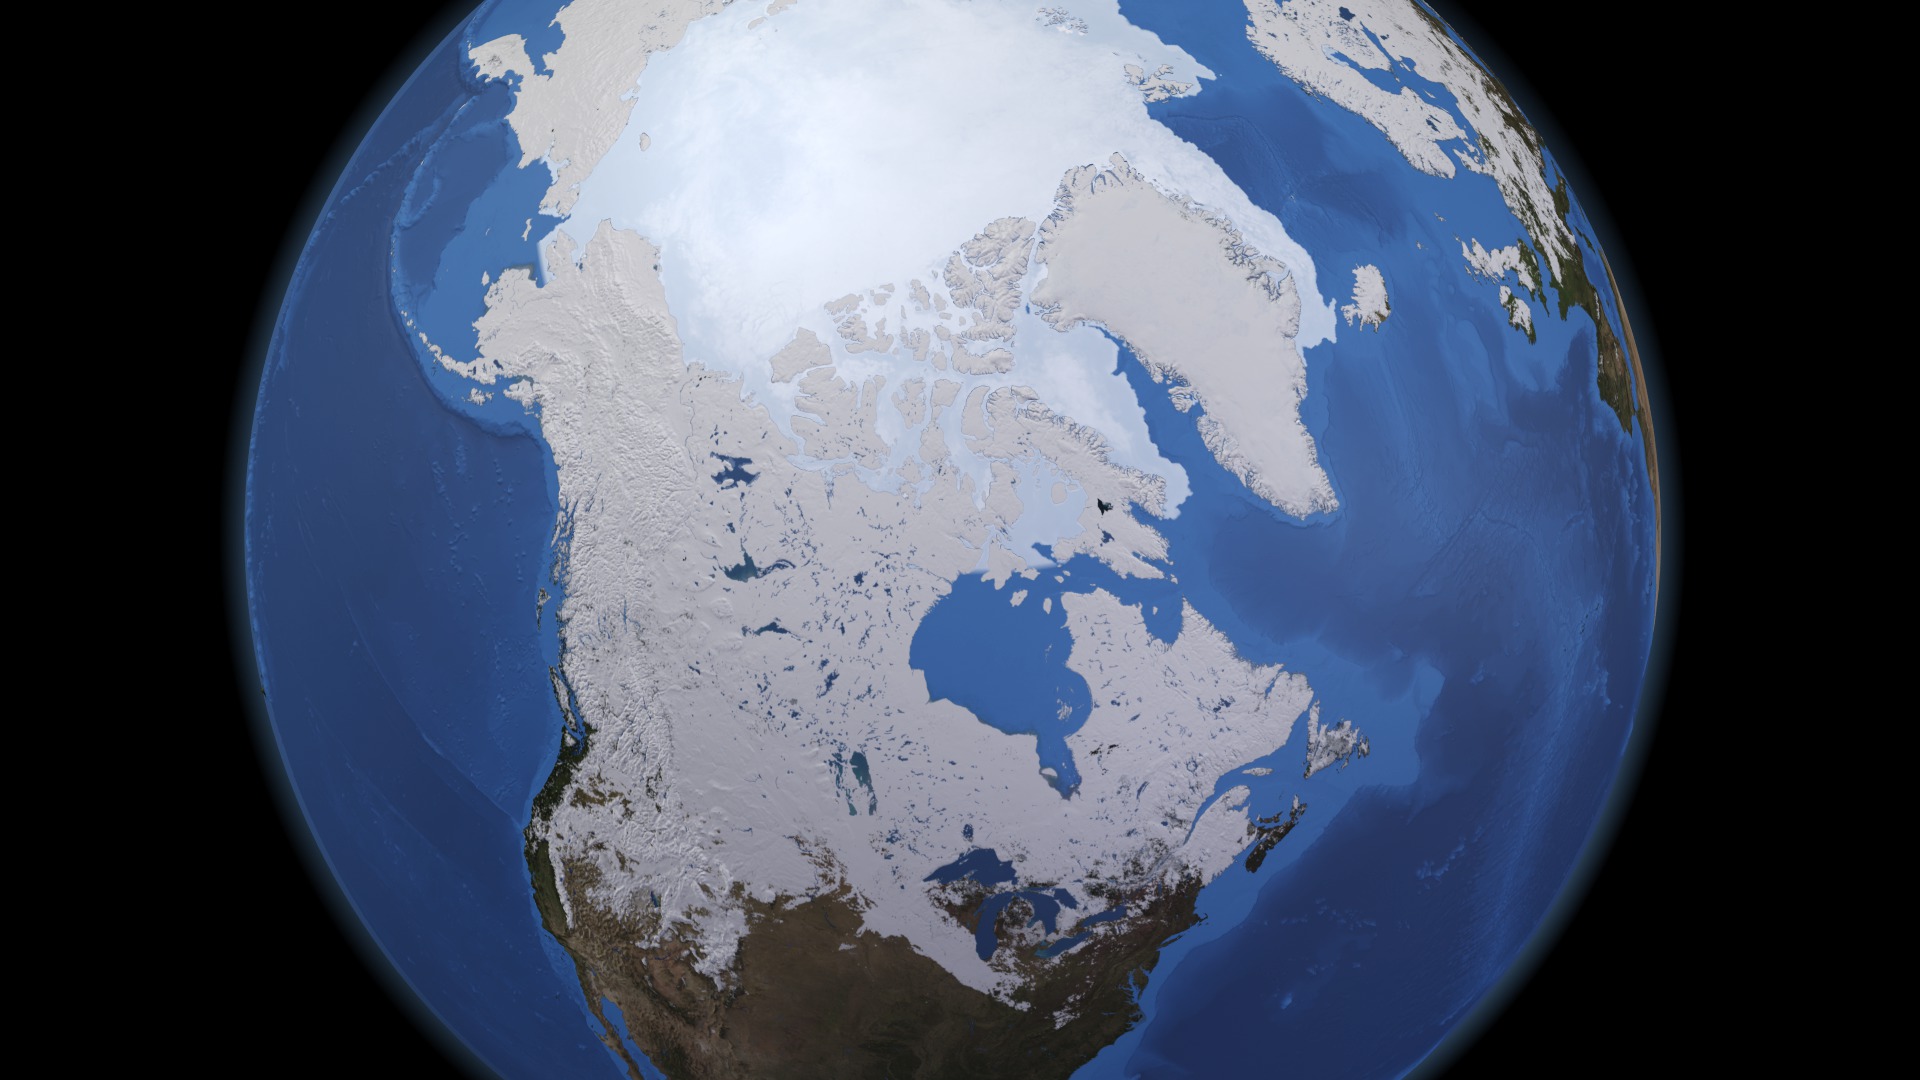
North America sea ice and snow cover from September 2010 to August 2011

This set of frames provides the background layer only of the North America sea ice and snow cover from September 2010 to August 2011

This set of frames provides the dates layer only of the North America sea ice and snow cover from September 2010 to August 2011
Data from NASA's AMSR-E instrument captures the connected patterns of snow and sea ice cover in Baffin and Hudson Bay from September 2010 to August 2011

This set of frames provides the background layer only with alpha channel of the snow and sea ice cover in Baffin and Hudson Bay from September 2010 to August 2011.

This set of frames provides the dates layer only with alpha channel of the snow and sea ice cover in Baffin and Hudson Bay from September 2010 to August 2011.
Credits
Please give credit for this item to:
NASA/Goddard Space Flight Center Scientific Visualization Studio
-
Visualizers
-
Helen-Nicole Kostis
(USRA)

-
Cindy Starr
(Global Science and Technology, Inc.)
-
Helen-Nicole Kostis
(USRA)
-
Scientist
- Thorsten Markus (NASA/GSFC)
Datasets used
-
Daily L3 6.25 km 89 GHz Brightness Temperature (Tb) [Aqua: AMSR-E]
ID: 236 -
Sea Ice Concentration (Daily L3 12.5km Tb, Sea Ice Concentration, and Snow Depth) [Aqua: AMSR-E]
ID: 237 -
Snow Cover Daily L3 Global 0.05Deg CMG (MOD10C1) [Terra: MODIS]
ID: 504 -
BMNG (Blue Marble: Next Generation) [Terra and Aqua: MODIS]
ID: 508Credit: The Blue Marble data is courtesy of Reto Stockli (NASA/GSFC).
This dataset can be found at: http://earthobservatory.nasa.gov/Newsroom/BlueMarble/
See all pages that use this dataset -
Bathymetry [Terra: MODIS]
ID: 569
Note: While we identify the data sets used on this page, we do not store any further details, nor the data sets themselves on our site.
Related
- ID: 3944
 Visualization
Used as a Source In
- ID: 4742
 Visualization
 - ID: 10881
 Produced Video
 - ID: 10850
 Produced Video
Release date
This page was originally published on Wednesday, January 4, 2017.
This page was last updated on Sunday, January 5, 2025 at 10:09 PM EST.