Earth
ID: 3887
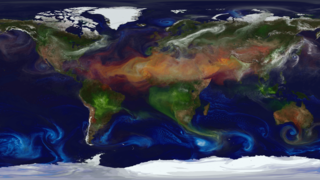
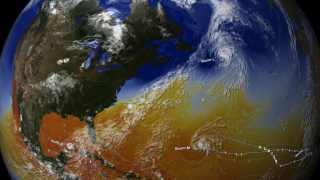
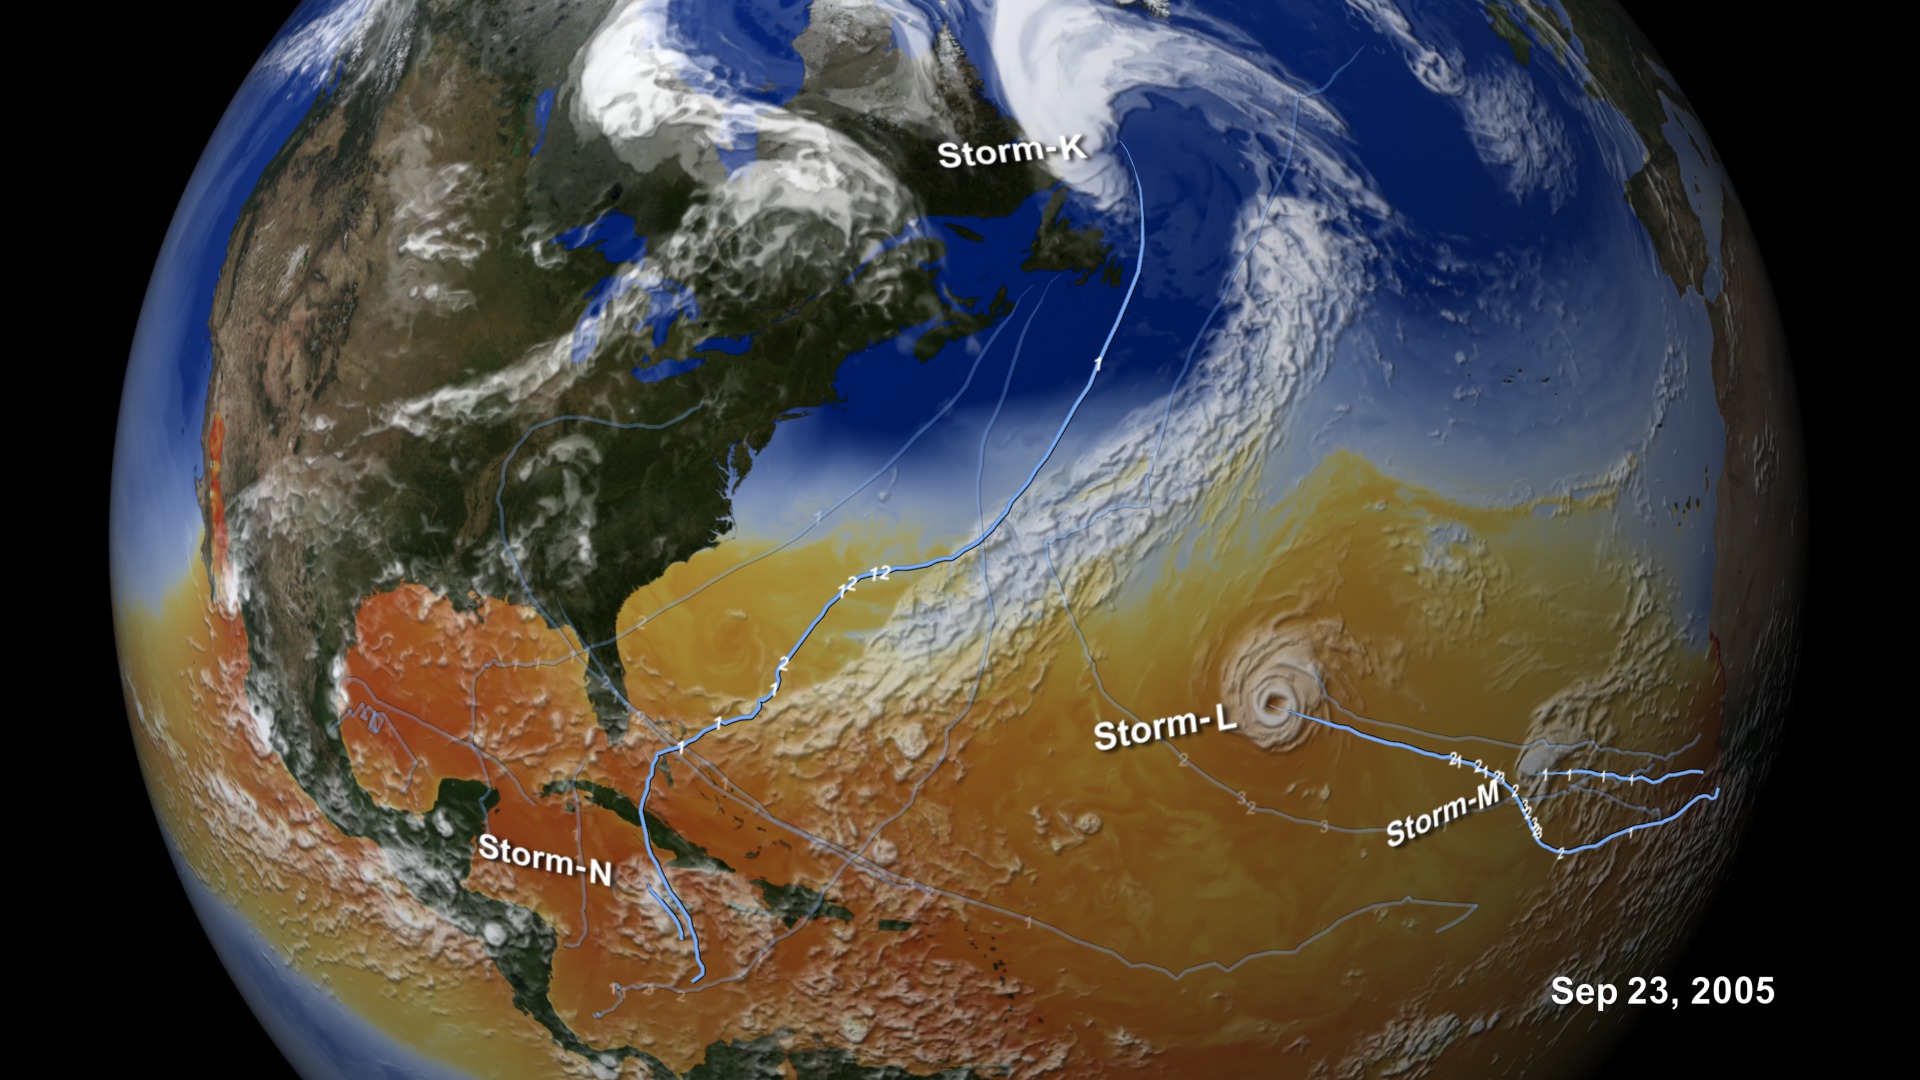
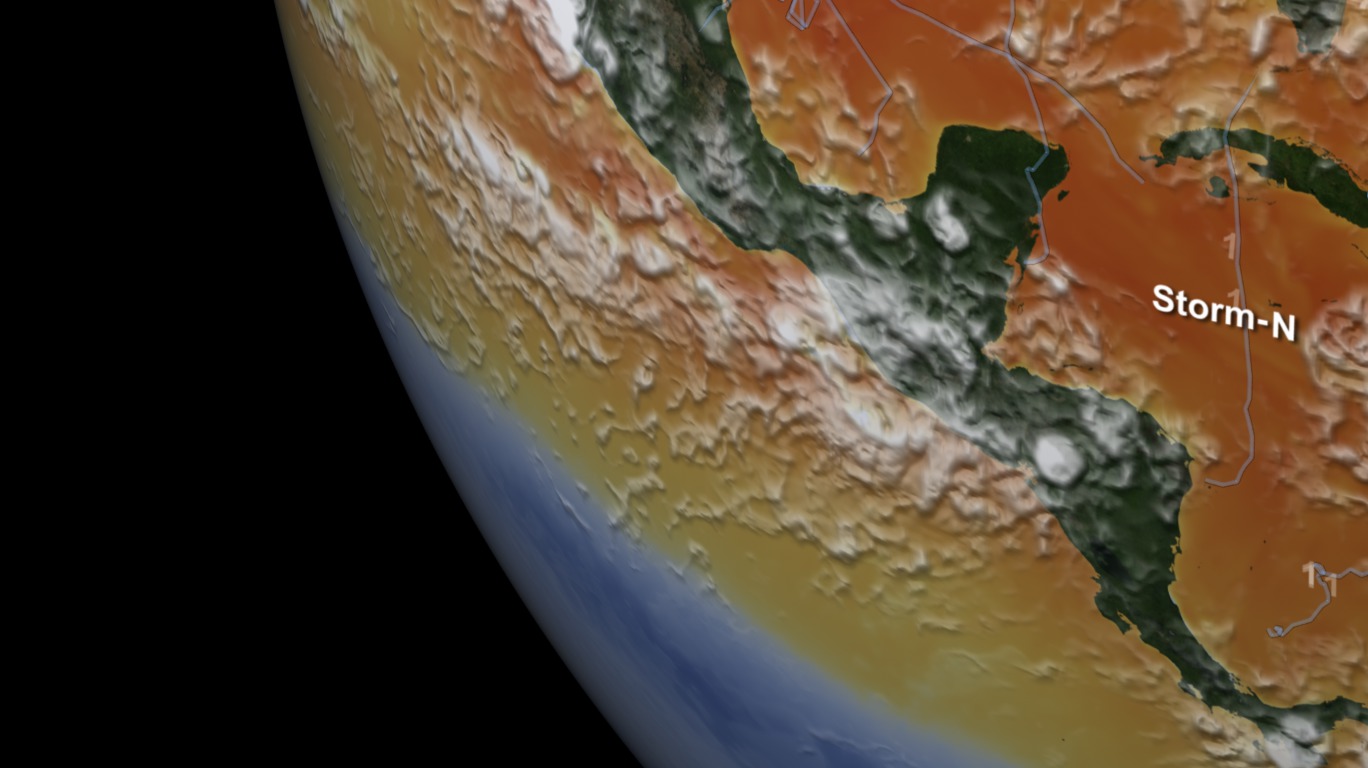
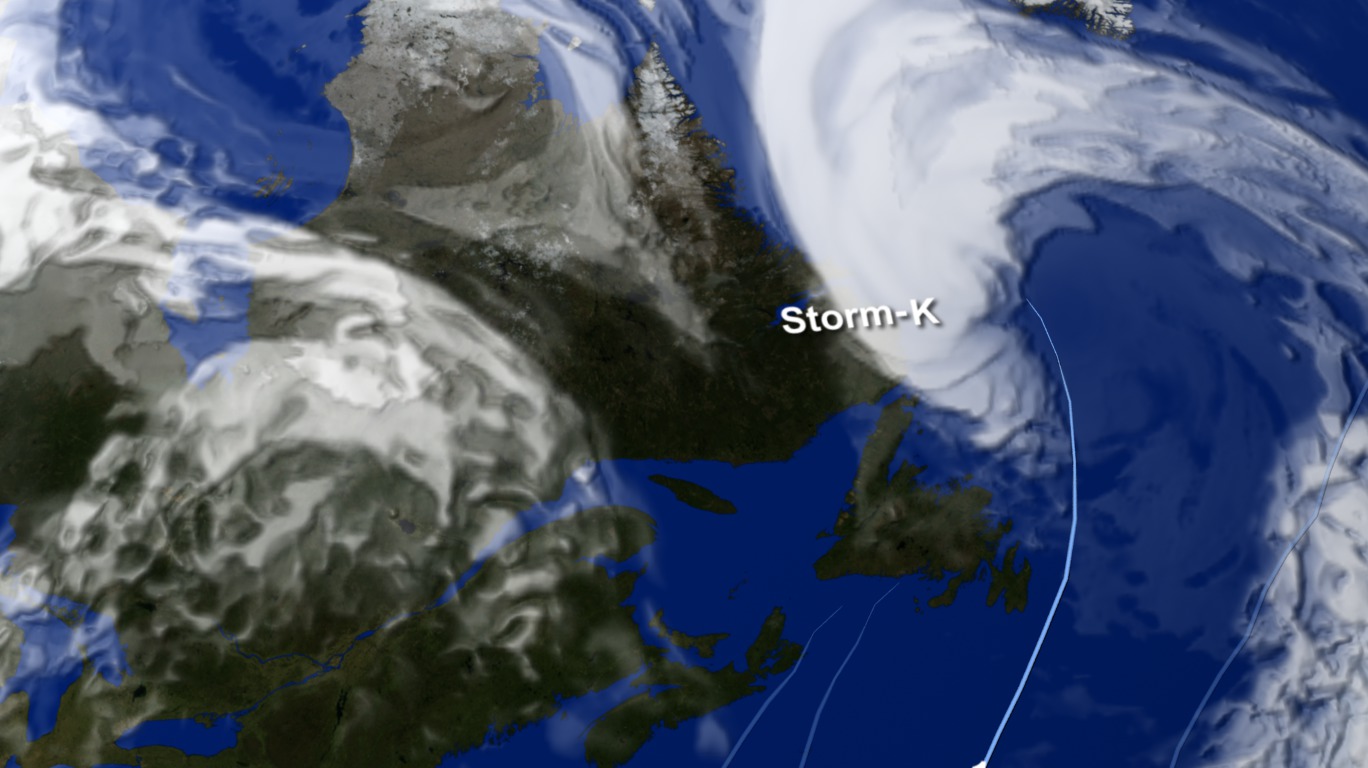
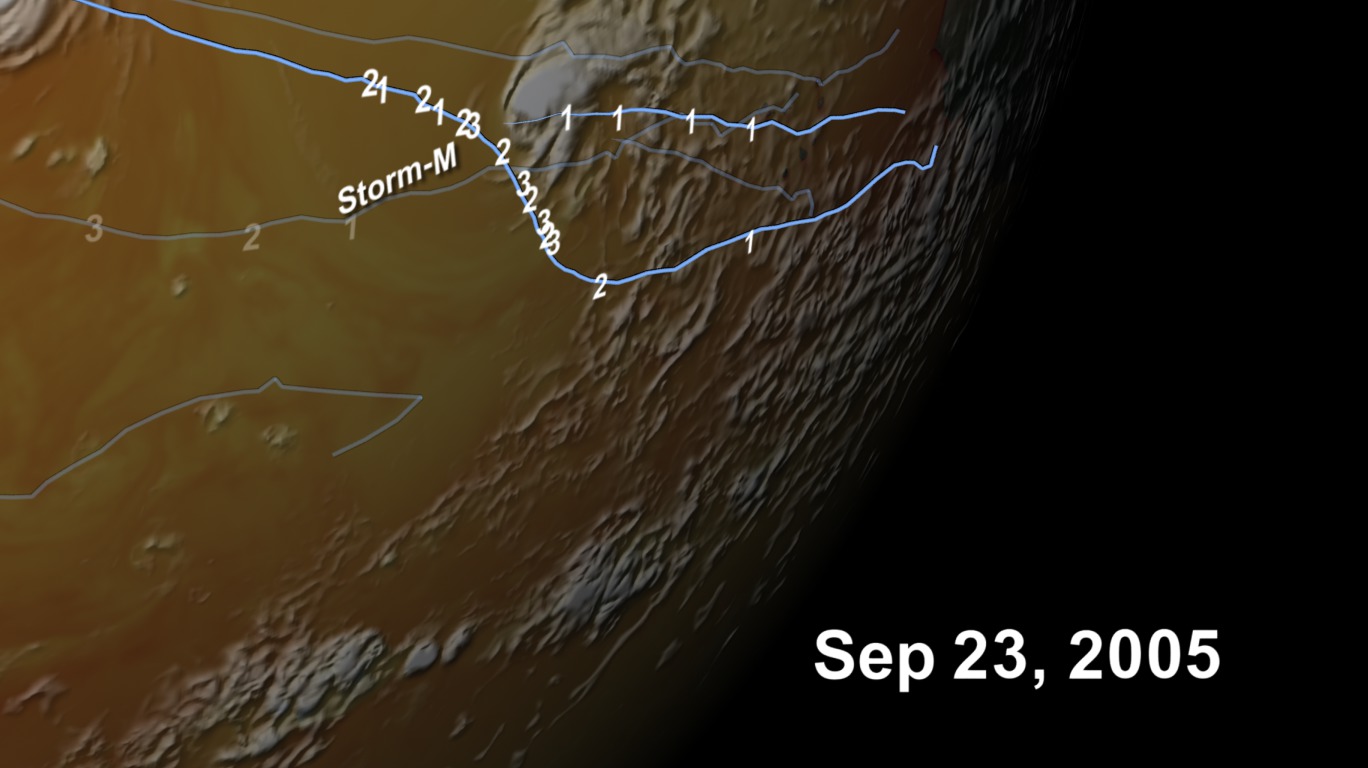
This visualization shows a Goddard Earth Observing System Model, Version 5 (GEOS-5) run of the 2005 Hurricane Season driven by Sea Surface Temperatures (SST). The simulation was seeded at the beginning of the run and then ran on its own to create the 6 months of output visualized here. What's interesting is that even though the model did not perfectly duplicate all 27 storms from that very active 2005 hurricane season, it does show 23 storms during that same period. Considering this was an anomalous year, the model did a good job of simulating the large number of storms for that season. An innovative aspect of this global model is the ability to represent realistic hurricane intensities, including 6 hurricanes in the Atlantic for 2005 reaching major strength (category 3 or higher on the Saffir-Simpson scale). This finding could help shape future climate models in predicting hurricane season intensities.

GEOS-5 Nature Run
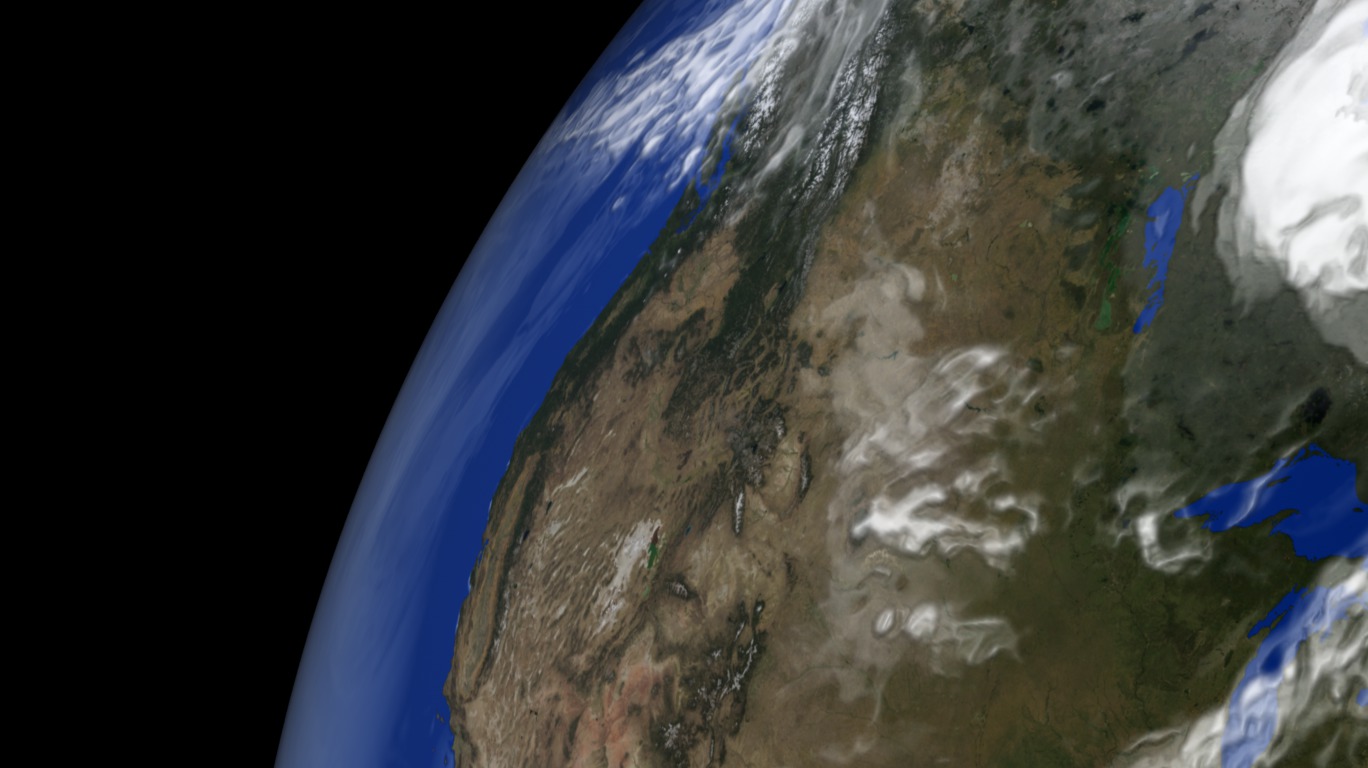
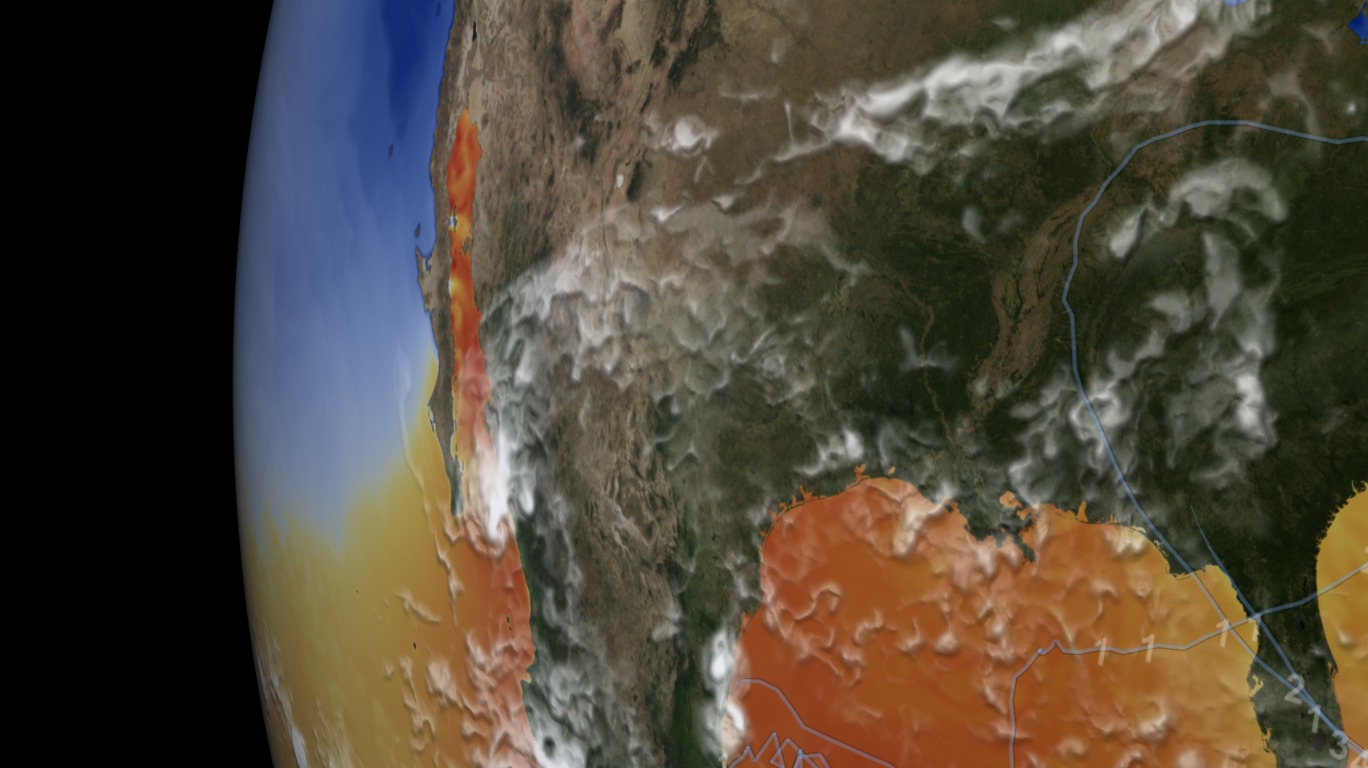
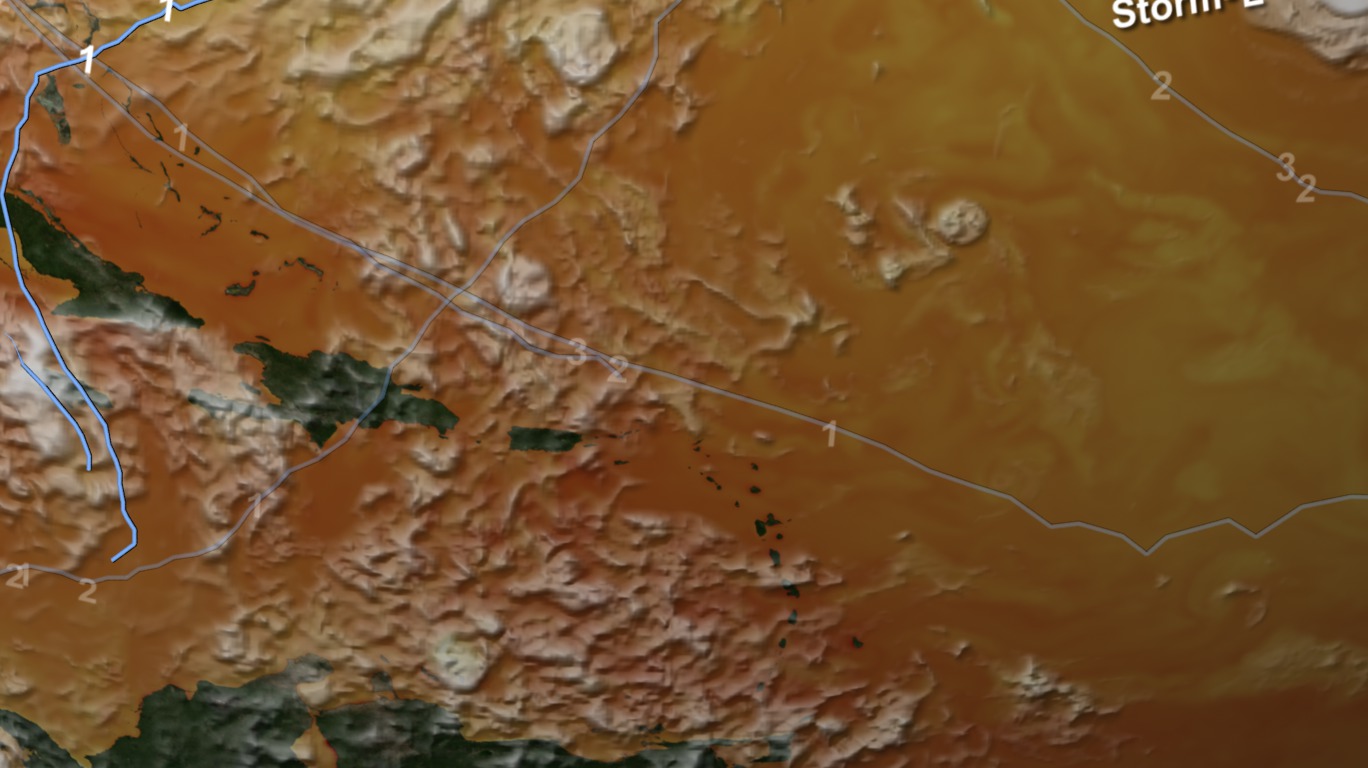
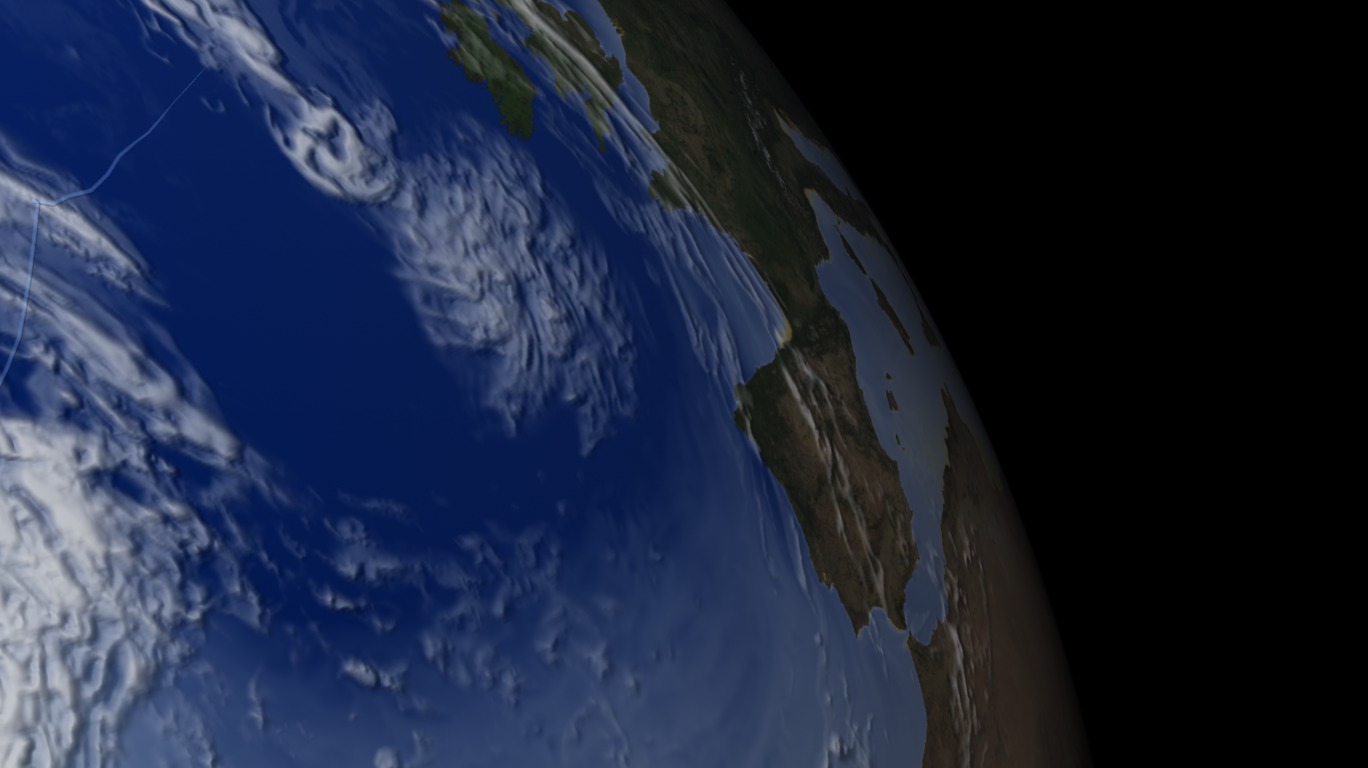
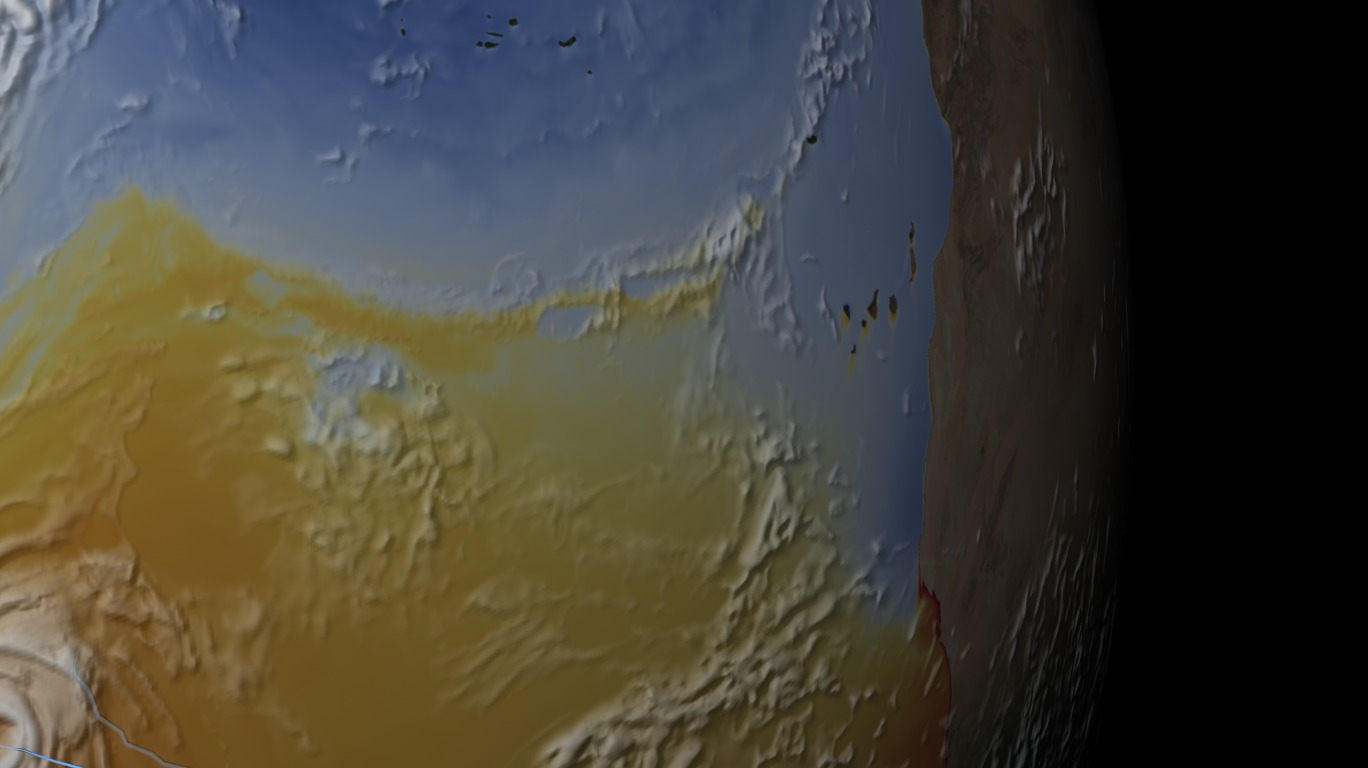
Ocean colors ranging from blue to orange depict air temperatures 2 meters (T2M) above sea level. Since SSTs are typically measured at sea level and below, the T2M model output behaves somewhat differently. Nonetheless, it is a reasonable proxy to SST. Landcover information is taken from the Next Generation Blue Marble dataset. Sea Ice is depicted as solid white and clouds are shades of white.
Related
Visualization Credits
Alex Kekesi (Global Science and Technology, Inc.): Lead Animator
Greg Shirah (NASA/GSFC): Animator
William Putman (NASA/GSFC): Scientist
Greg Shirah (NASA/GSFC): Animator
William Putman (NASA/GSFC): Scientist
Please give credit for this item to:
NASA/Goddard Space Flight Center Scientific Visualization Studio
NASA/Goddard Space Flight Center Scientific Visualization Studio
Science Paper:
Putman, W. M., and M. Suarez (2011), Cloud-system resolving simulations with the NASA Goddard Earth Observing System global atmospheric model (GEOS-5), Geophys. Res. Lett., 38, L16809, doi:10.1029/2011GL048438.
Short URL to share this page:
https://svs.gsfc.nasa.gov/3887
Data Used:
Note: While we identify the data sets used in these visualizations, we do not store any further details nor the data sets themselves on our site.
Keywords:
DLESE >> Atmospheric science
SVS >> HDTV
DLESE >> Natural hazards
DLESE >> Physical oceanography
GCMD >> Earth Science >> Atmosphere >> Atmospheric Phenomena >> Hurricanes
SVS >> Hyperwall
SVS >> Hurricane Track
NASA Science >> Earth
SVS >> Presentation
GCMD keywords can be found on the Internet with the following citation: Olsen, L.M., G. Major, K. Shein, J. Scialdone, S. Ritz, T. Stevens, M. Morahan, A. Aleman, R. Vogel, S. Leicester, H. Weir, M. Meaux, S. Grebas, C.Solomon, M. Holland, T. Northcutt, R. A. Restrepo, R. Bilodeau, 2013. NASA/Global Change Master Directory (GCMD) Earth Science Keywords. Version 8.0.0.0.0
Putman, W. M., and M. Suarez (2011), Cloud-system resolving simulations with the NASA Goddard Earth Observing System global atmospheric model (GEOS-5), Geophys. Res. Lett., 38, L16809, doi:10.1029/2011GL048438.
Short URL to share this page:
https://svs.gsfc.nasa.gov/3887
Data Used:
GEOS Atmospheric Model
Model - NASA GMAO - 6/1/05-12/31/05Keywords:
DLESE >> Atmospheric science
SVS >> HDTV
DLESE >> Natural hazards
DLESE >> Physical oceanography
GCMD >> Earth Science >> Atmosphere >> Atmospheric Phenomena >> Hurricanes
SVS >> Hyperwall
SVS >> Hurricane Track
NASA Science >> Earth
SVS >> Presentation
GCMD keywords can be found on the Internet with the following citation: Olsen, L.M., G. Major, K. Shein, J. Scialdone, S. Ritz, T. Stevens, M. Morahan, A. Aleman, R. Vogel, S. Leicester, H. Weir, M. Meaux, S. Grebas, C.Solomon, M. Holland, T. Northcutt, R. A. Restrepo, R. Bilodeau, 2013. NASA/Global Change Master Directory (GCMD) Earth Science Keywords. Version 8.0.0.0.0


