How has the Atmospheric Carbon Uptake from Plants Changed in the Last Decade?
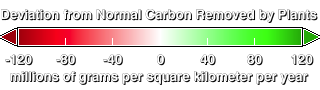
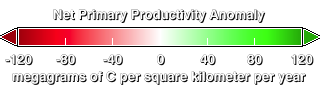
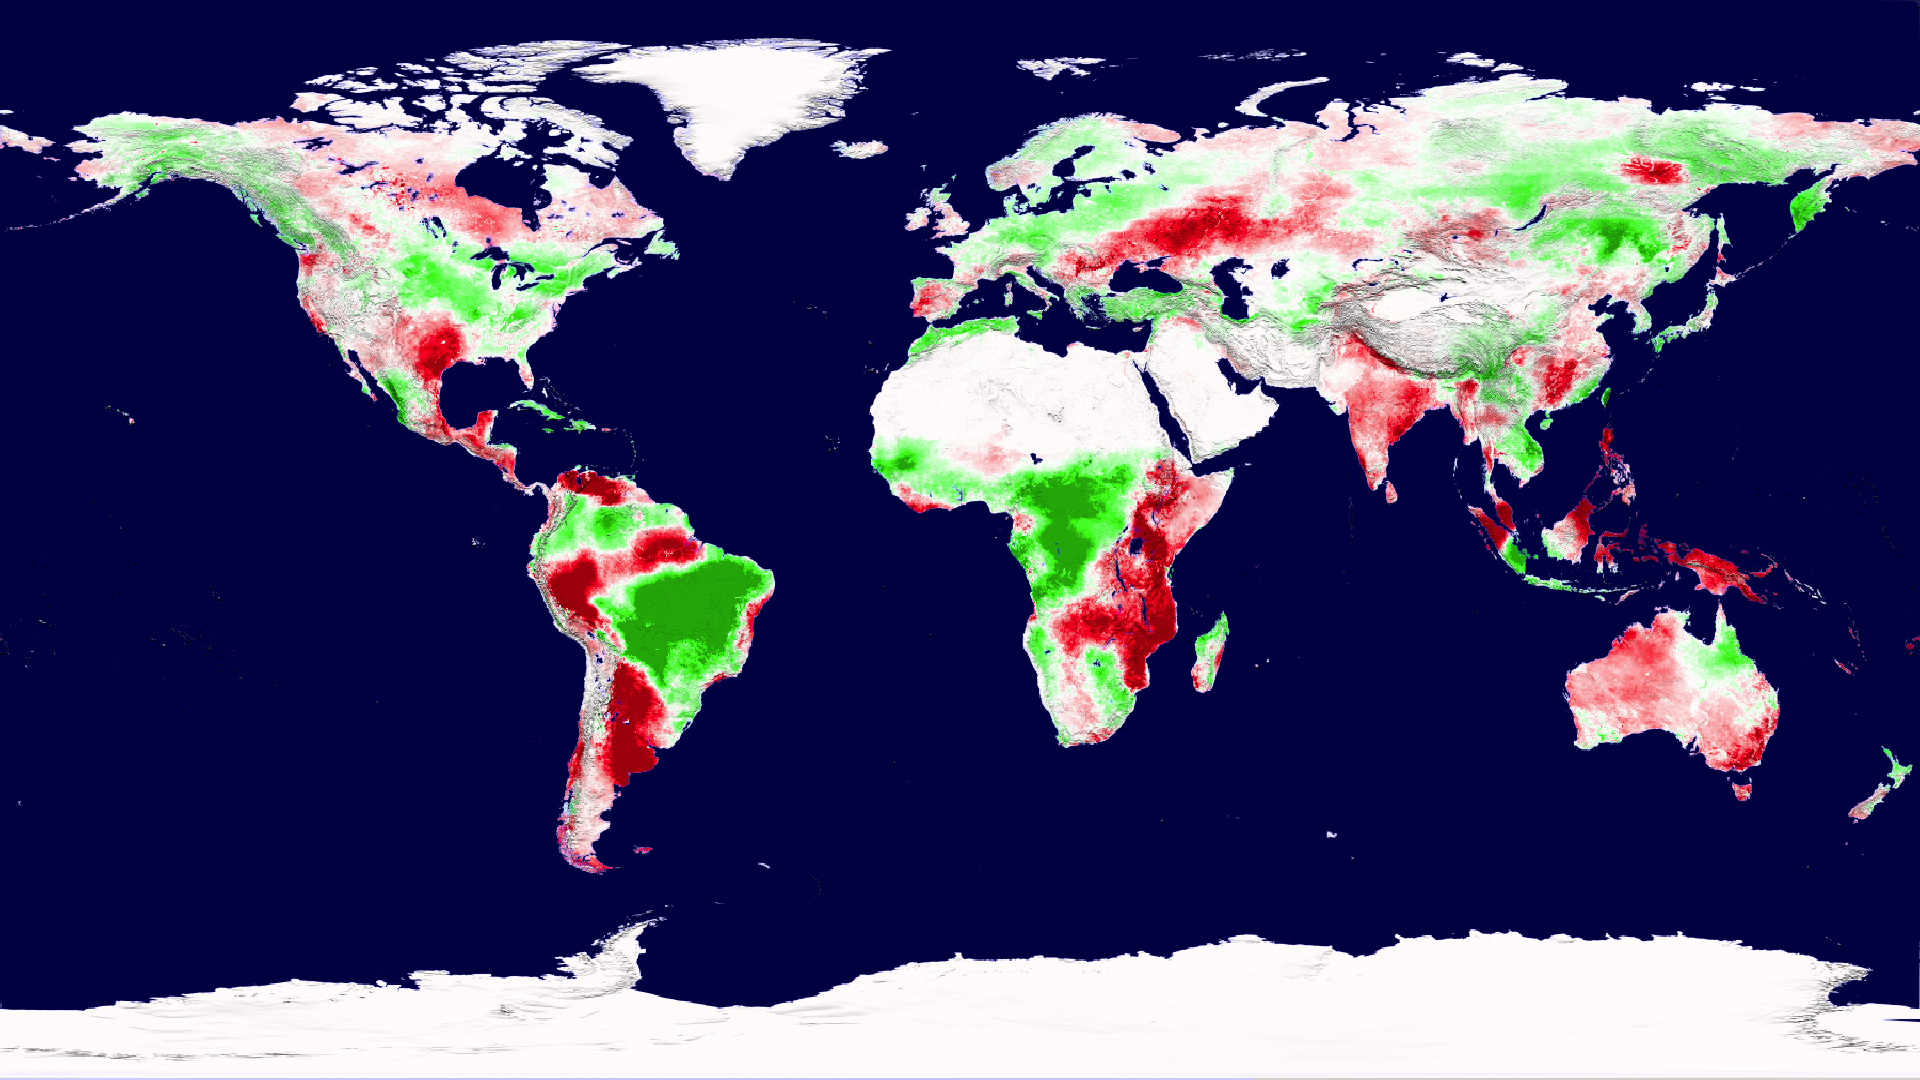
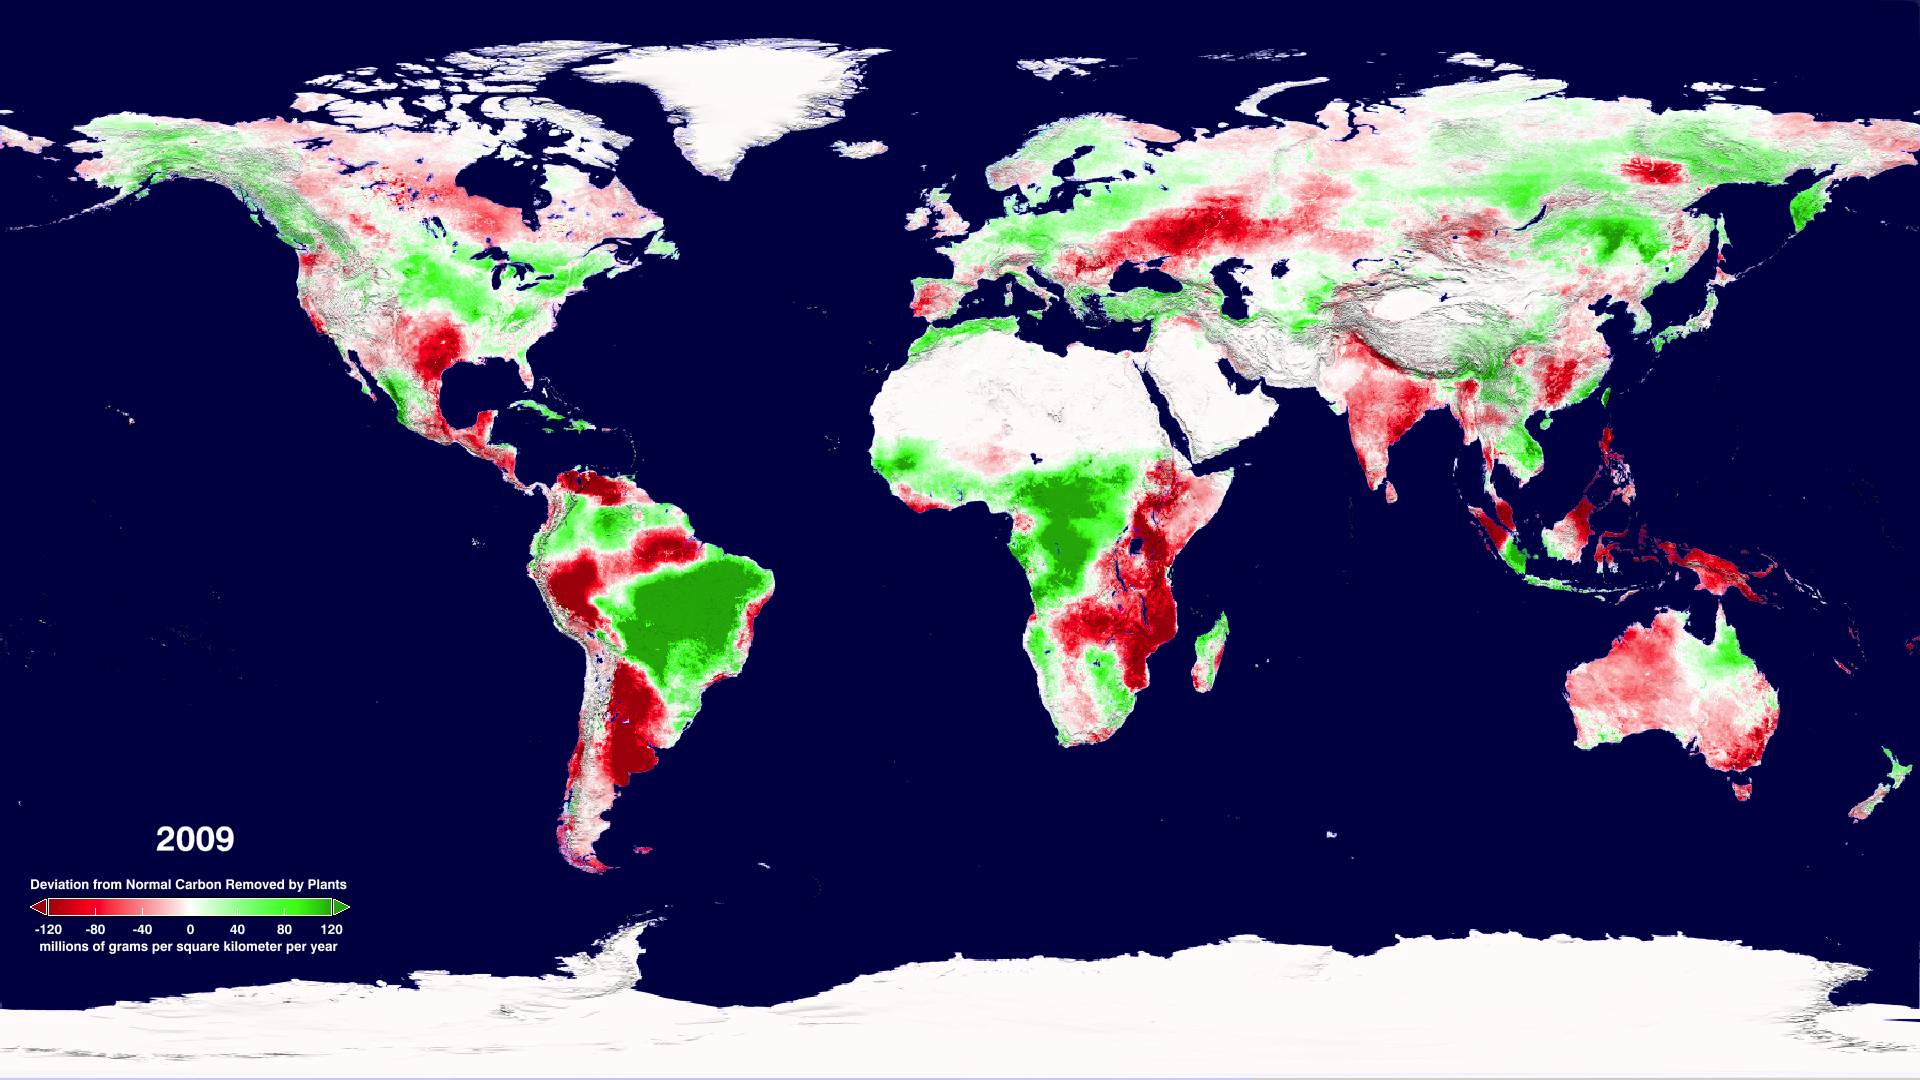
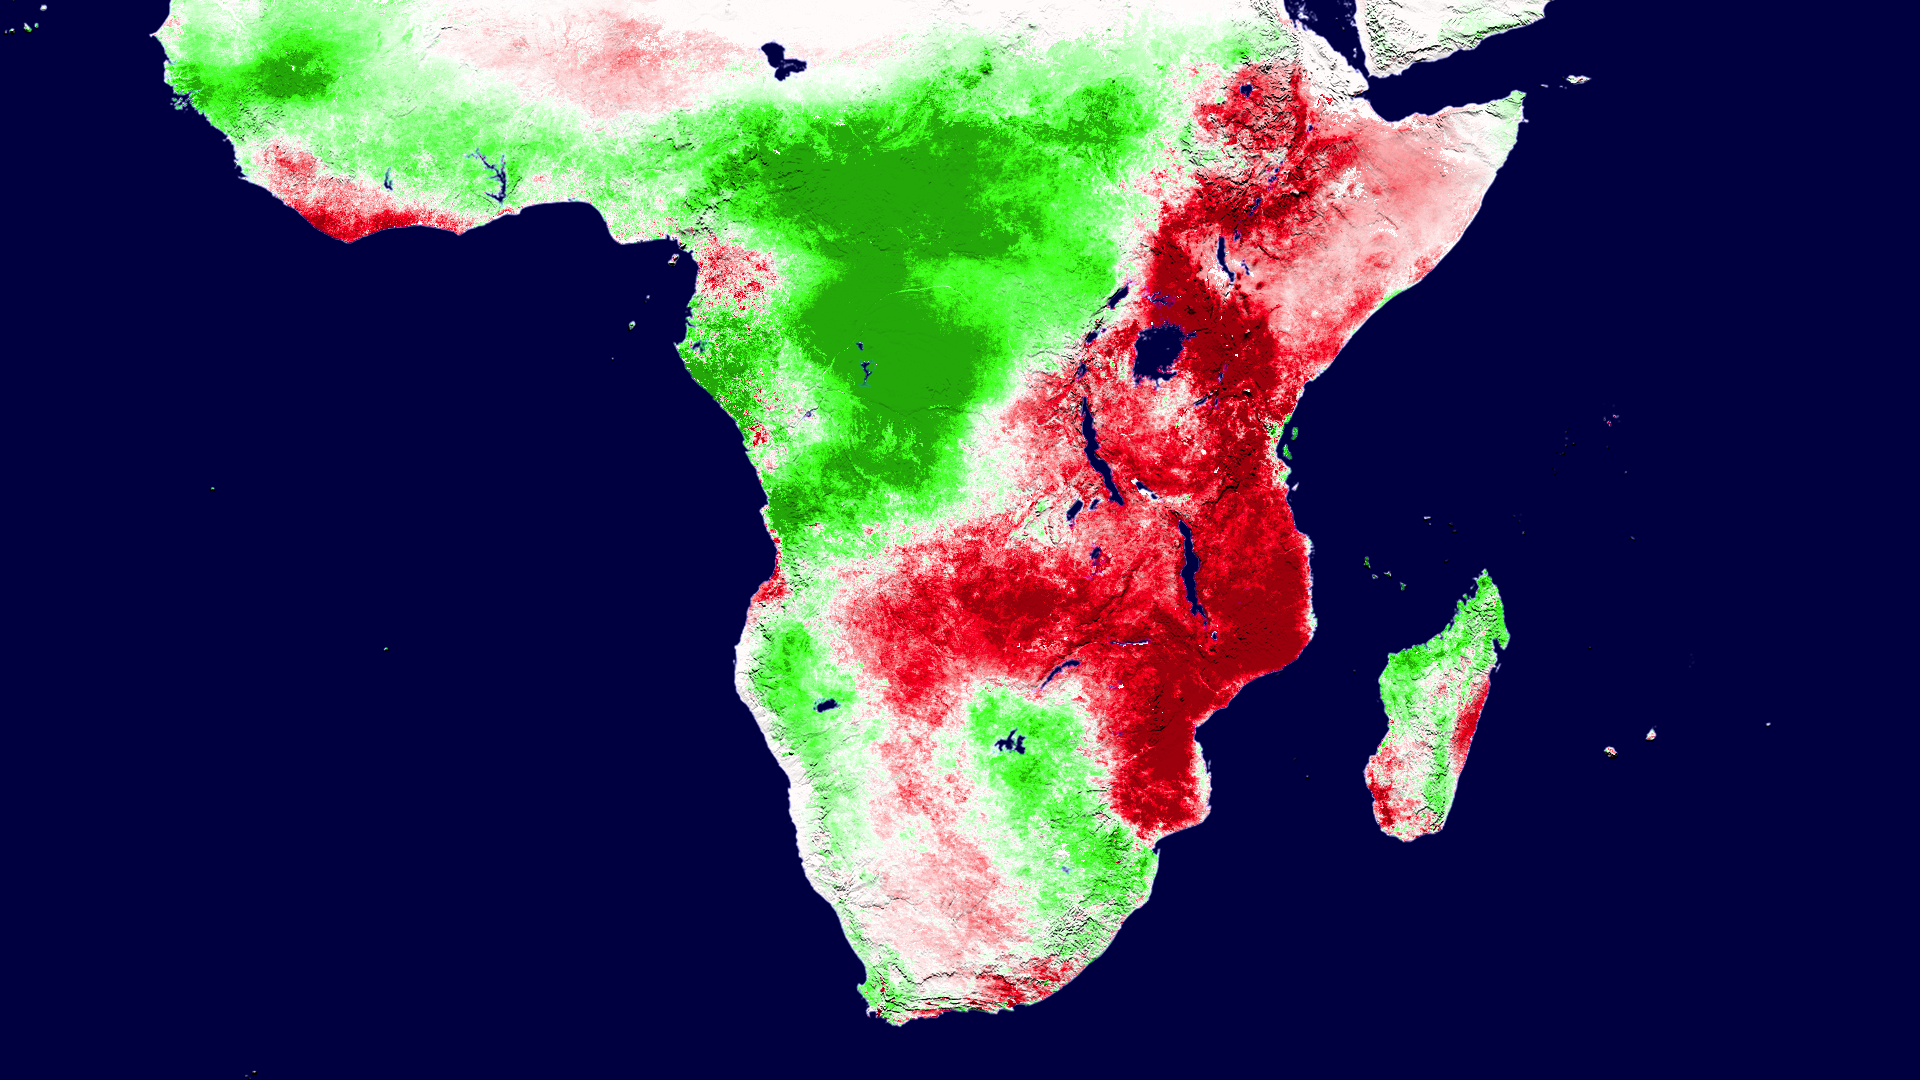
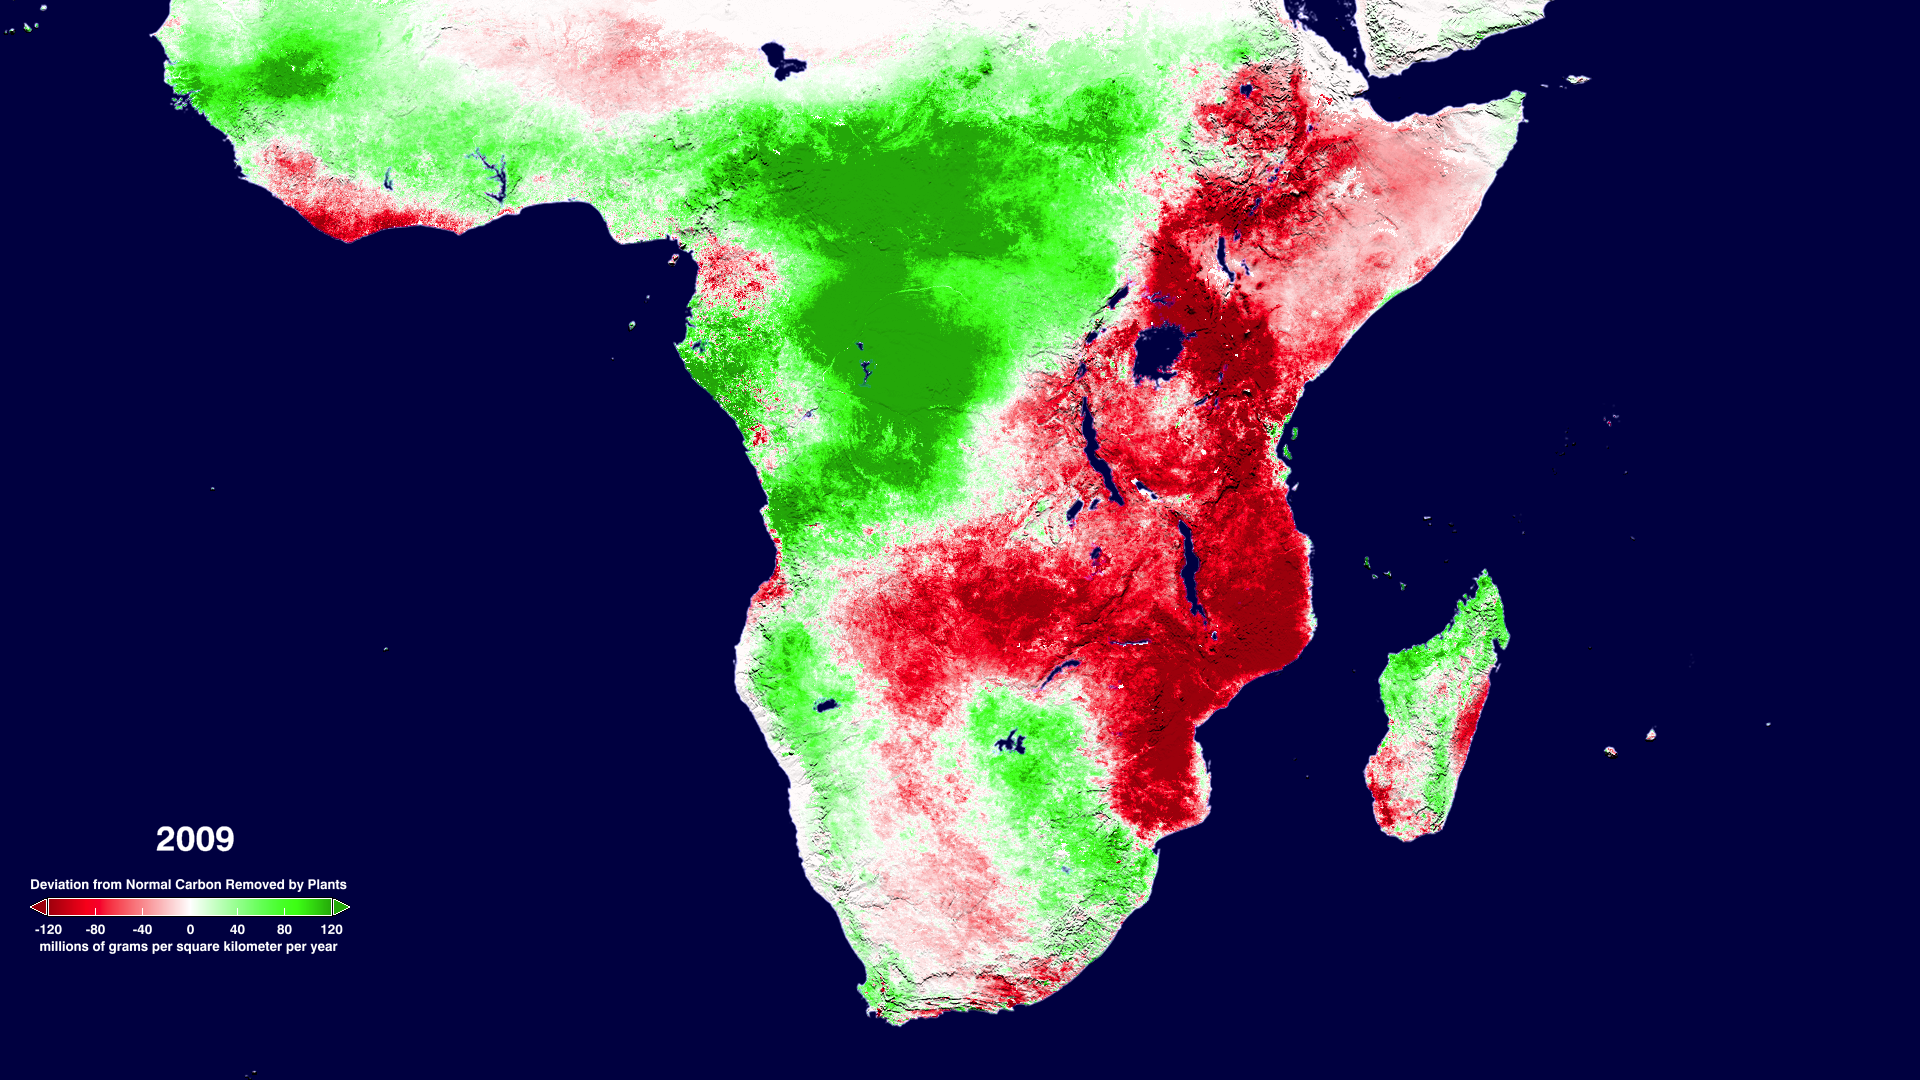
The change in NPP due to rising global temperatures is a very important factor in the response of the Earth to climate change. Measurements of radiation and leaf area from the MODIS instrument on NASA's Terra satellite have recently been used to calculate the change in NPP for the whole world for the last 10 years. This animation shows a time sequence of annual NPP deviation from normal (or 'anomaly') on land as measured by MODIS during the years 2000 through 2009. Annual NPP, especially its departures from a long-term mean condition, will demonstrate the effects of environmental drivers such as ENSO (El Niño) events, climate change, droughts, pollution episodes, land degradation, and agricultural expansion.
Earlier studies of productivity between 1982 and 1999 showed that prouctivity went up as global temperatures rose, because longer, warmer growing seasons were better for plant growth. This new study indicates that this is still true in the northern hemisphere, but that increased temperatures have meant increased drought and dryness in the tropics and the southern hemisphere. As a result, the global net productivity has actually decreased in the period from 2000 through 2009.
Regionally, negative annual NPP anomalies were mainly caused by large-scale droughts. In 2000, droughts reduced NPP in North America and China; in 2002, droughts reduced NPP in North America and Australia; in 2003, drought caused by a major heat wave reduced NPP in Europe; in 2005, severe droughts in the Amazon, Africa, and Australia greatly reduced both regional and global NPP; from 2007 through 2009 over large parts of Australia, continuous droughts reduced continental NPP.
For an animation of daily productivity, see the page How Much Carbon do Plants Take from the Atmosphere?.
Visualization Credits
Michelle Williams (UMBC): Producer
Maosheng Zhao (University of Montana): Scientist
Steven W Running (University of Montana): Scientist
NASA/Goddard Space Flight Center Scientific Visualization Studio Data was provided by Maosheng Zhao.
Zhao, M. and S. W. Running, 2010, Drought-induced reduction in global terrestrial net primary production from 2000 through 2009. Science, 329: 940-943.
Short URL to share this page:
https://svs.gsfc.nasa.gov/3765
Missions:
Global Precipitation Measurement (GPM)
Terra
Data Used:
Terra/MODIS/FPAR/LAI also referred to as: Leaf Area Index
GTOPO30 Topography and Bathymetry
Data Compilation - USGSKeywords:
DLESE >> Biology
DLESE >> Ecology
SVS >> HDTV
DLESE >> Physical geography
GCMD >> Earth Science >> Biosphere >> Ecological Dynamics >> Photosynthesis
GCMD >> Earth Science >> Biosphere >> Vegetation >> Leaf Characteristics
GCMD >> Earth Science >> Climate Indicators >> Drought Indices >> Palmer Drought Severity Index
GCMD >> Earth Science >> Land Surface >> Land Use/Land Cover >> Land Productivity
SVS >> Hyperwall
NASA Science >> Earth
SVS >> Presentation
GCMD keywords can be found on the Internet with the following citation: Olsen, L.M., G. Major, K. Shein, J. Scialdone, S. Ritz, T. Stevens, M. Morahan, A. Aleman, R. Vogel, S. Leicester, H. Weir, M. Meaux, S. Grebas, C.Solomon, M. Holland, T. Northcutt, R. A. Restrepo, R. Bilodeau, 2013. NASA/Global Change Master Directory (GCMD) Earth Science Keywords. Version 8.0.0.0.0


