Space Weather Event: Incoming View
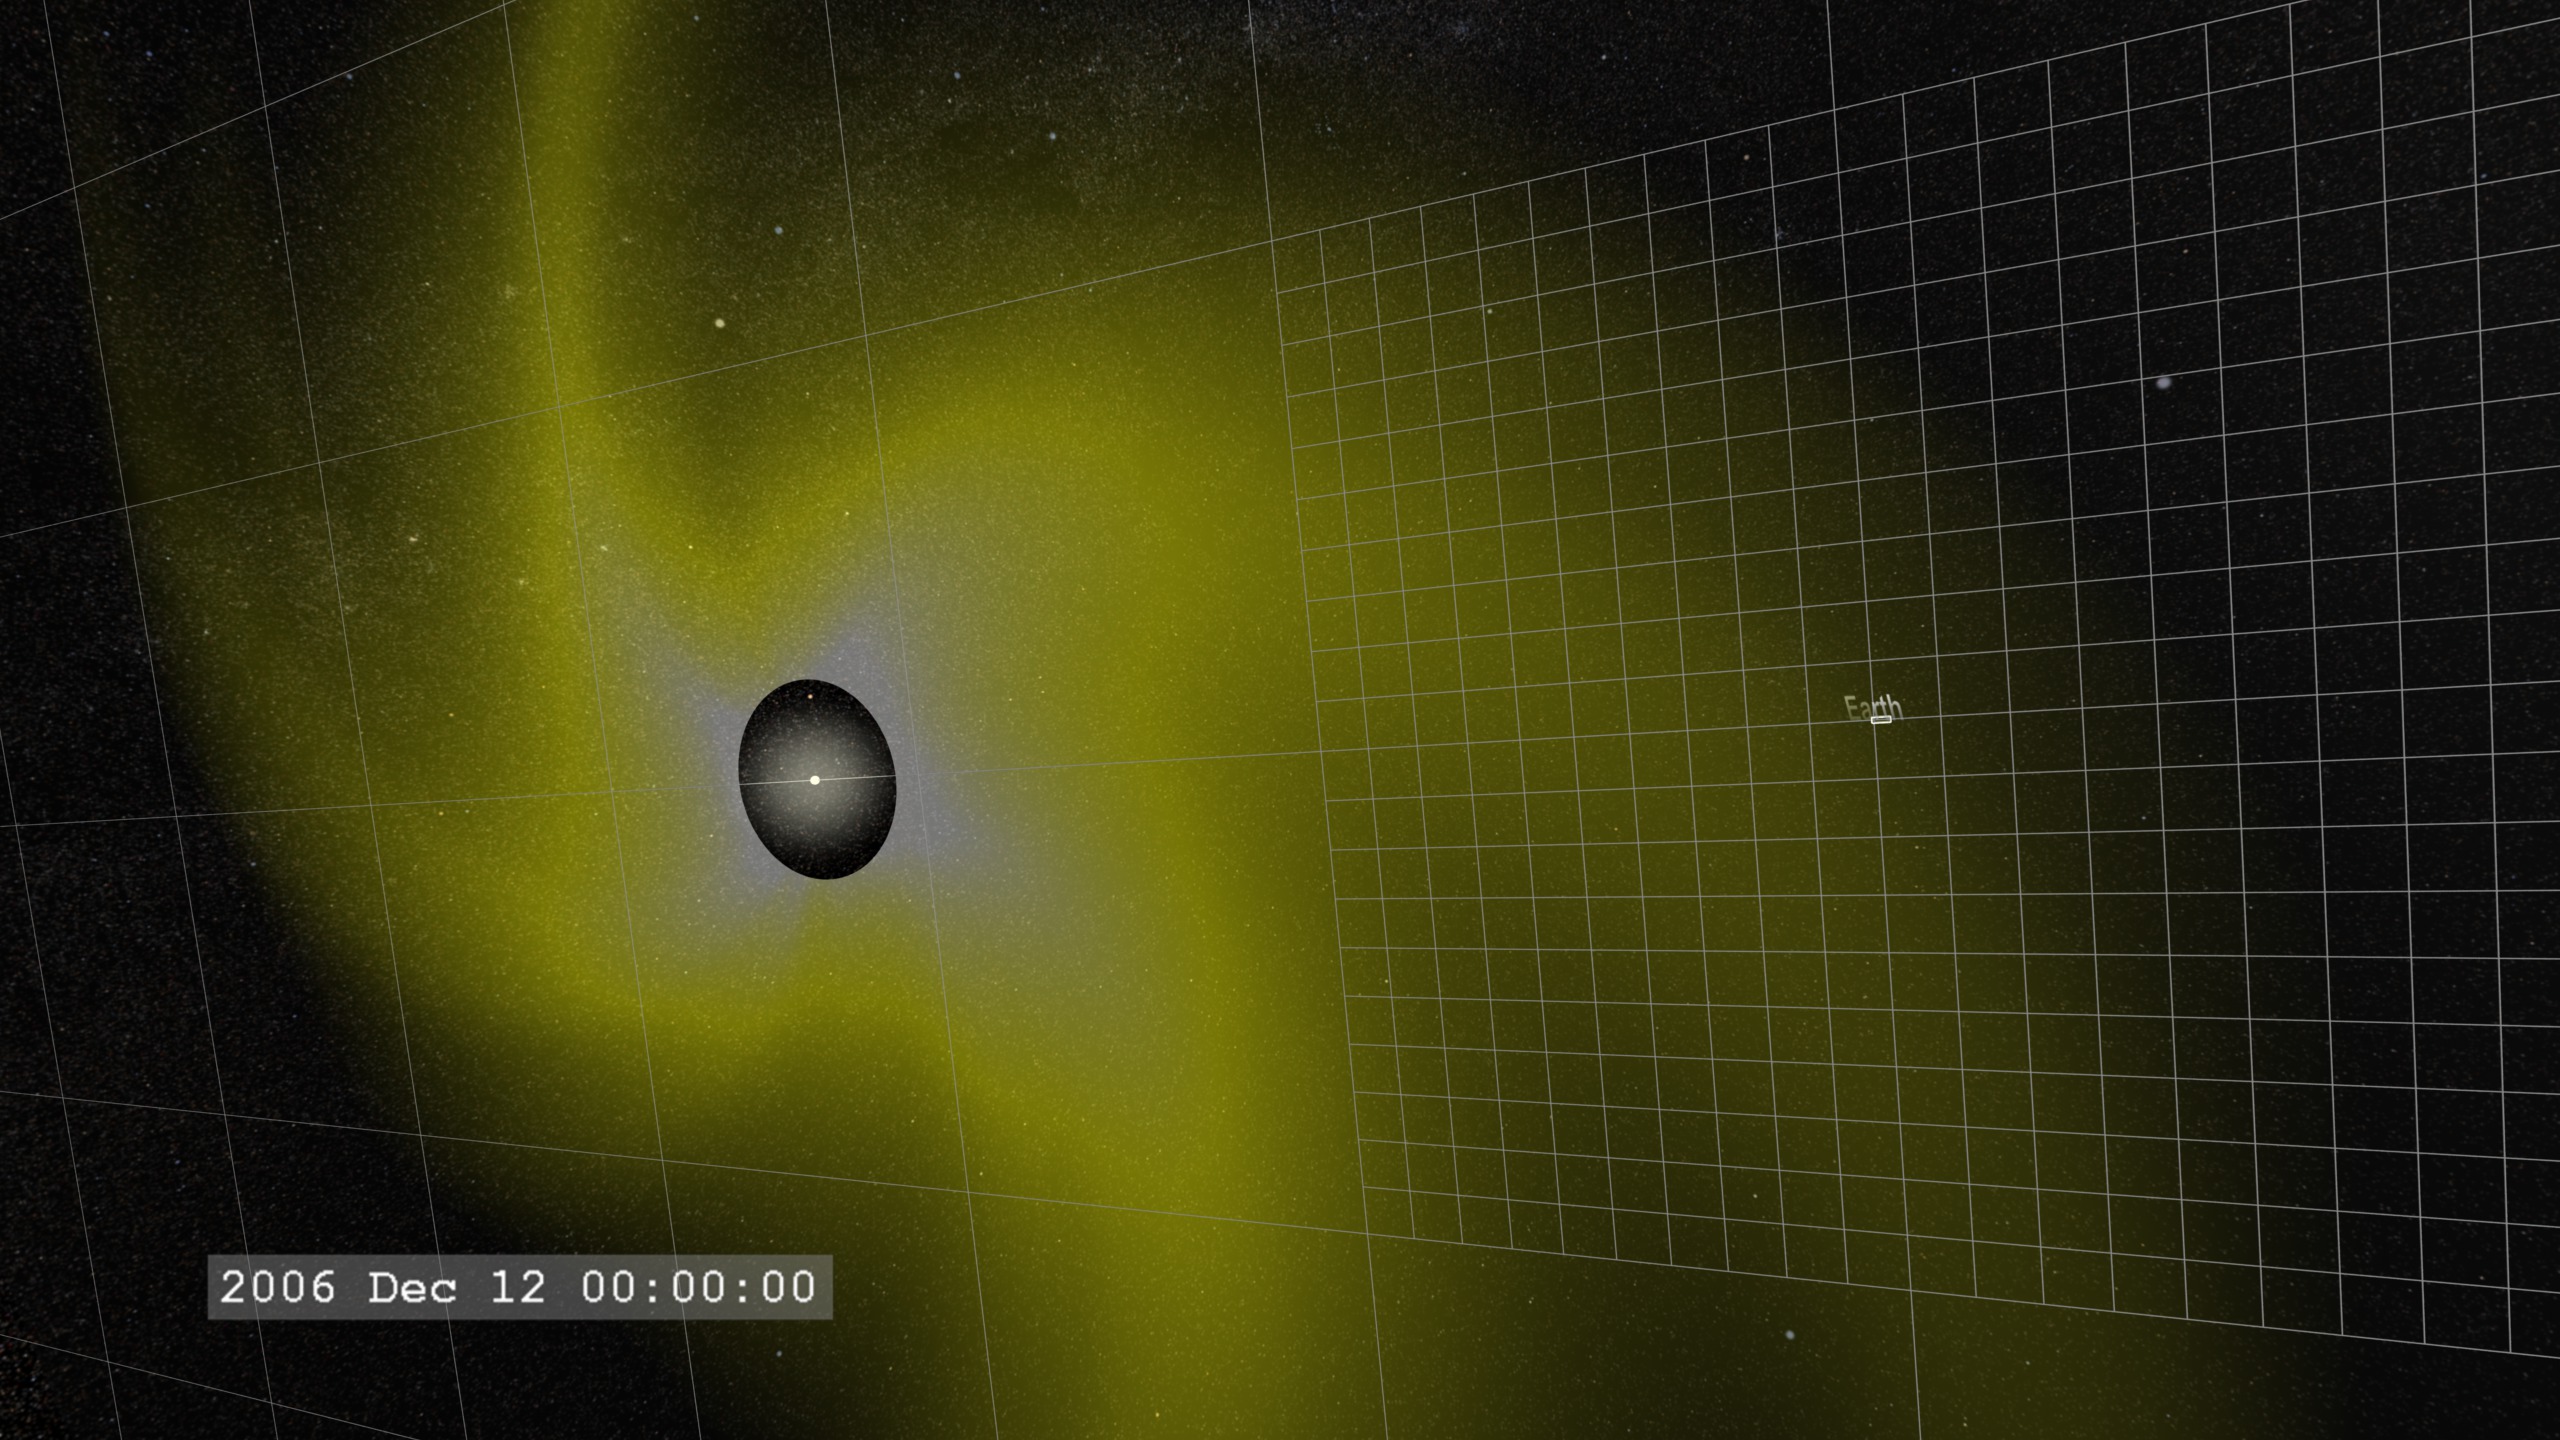
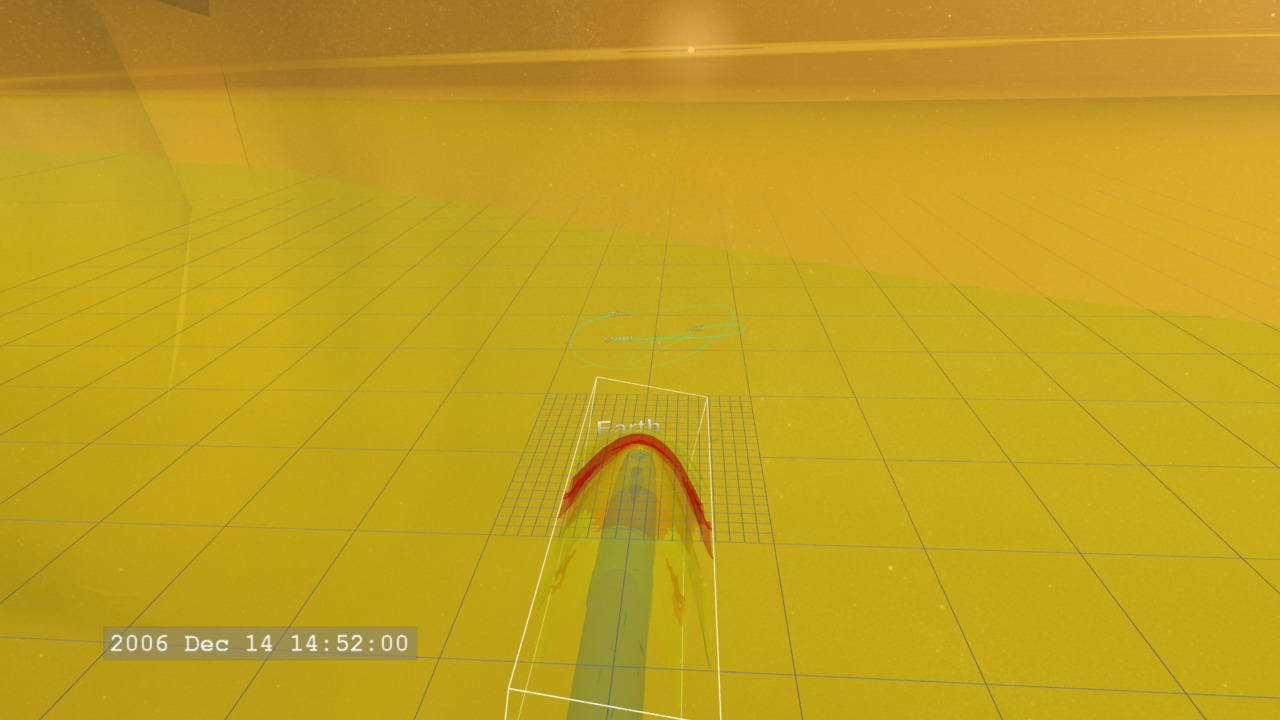
We zoom down to the Earth as the CME (orange surface) erupts in the direction of the Earth, then move into a position behind the Earth with the Sun visible in the distance.
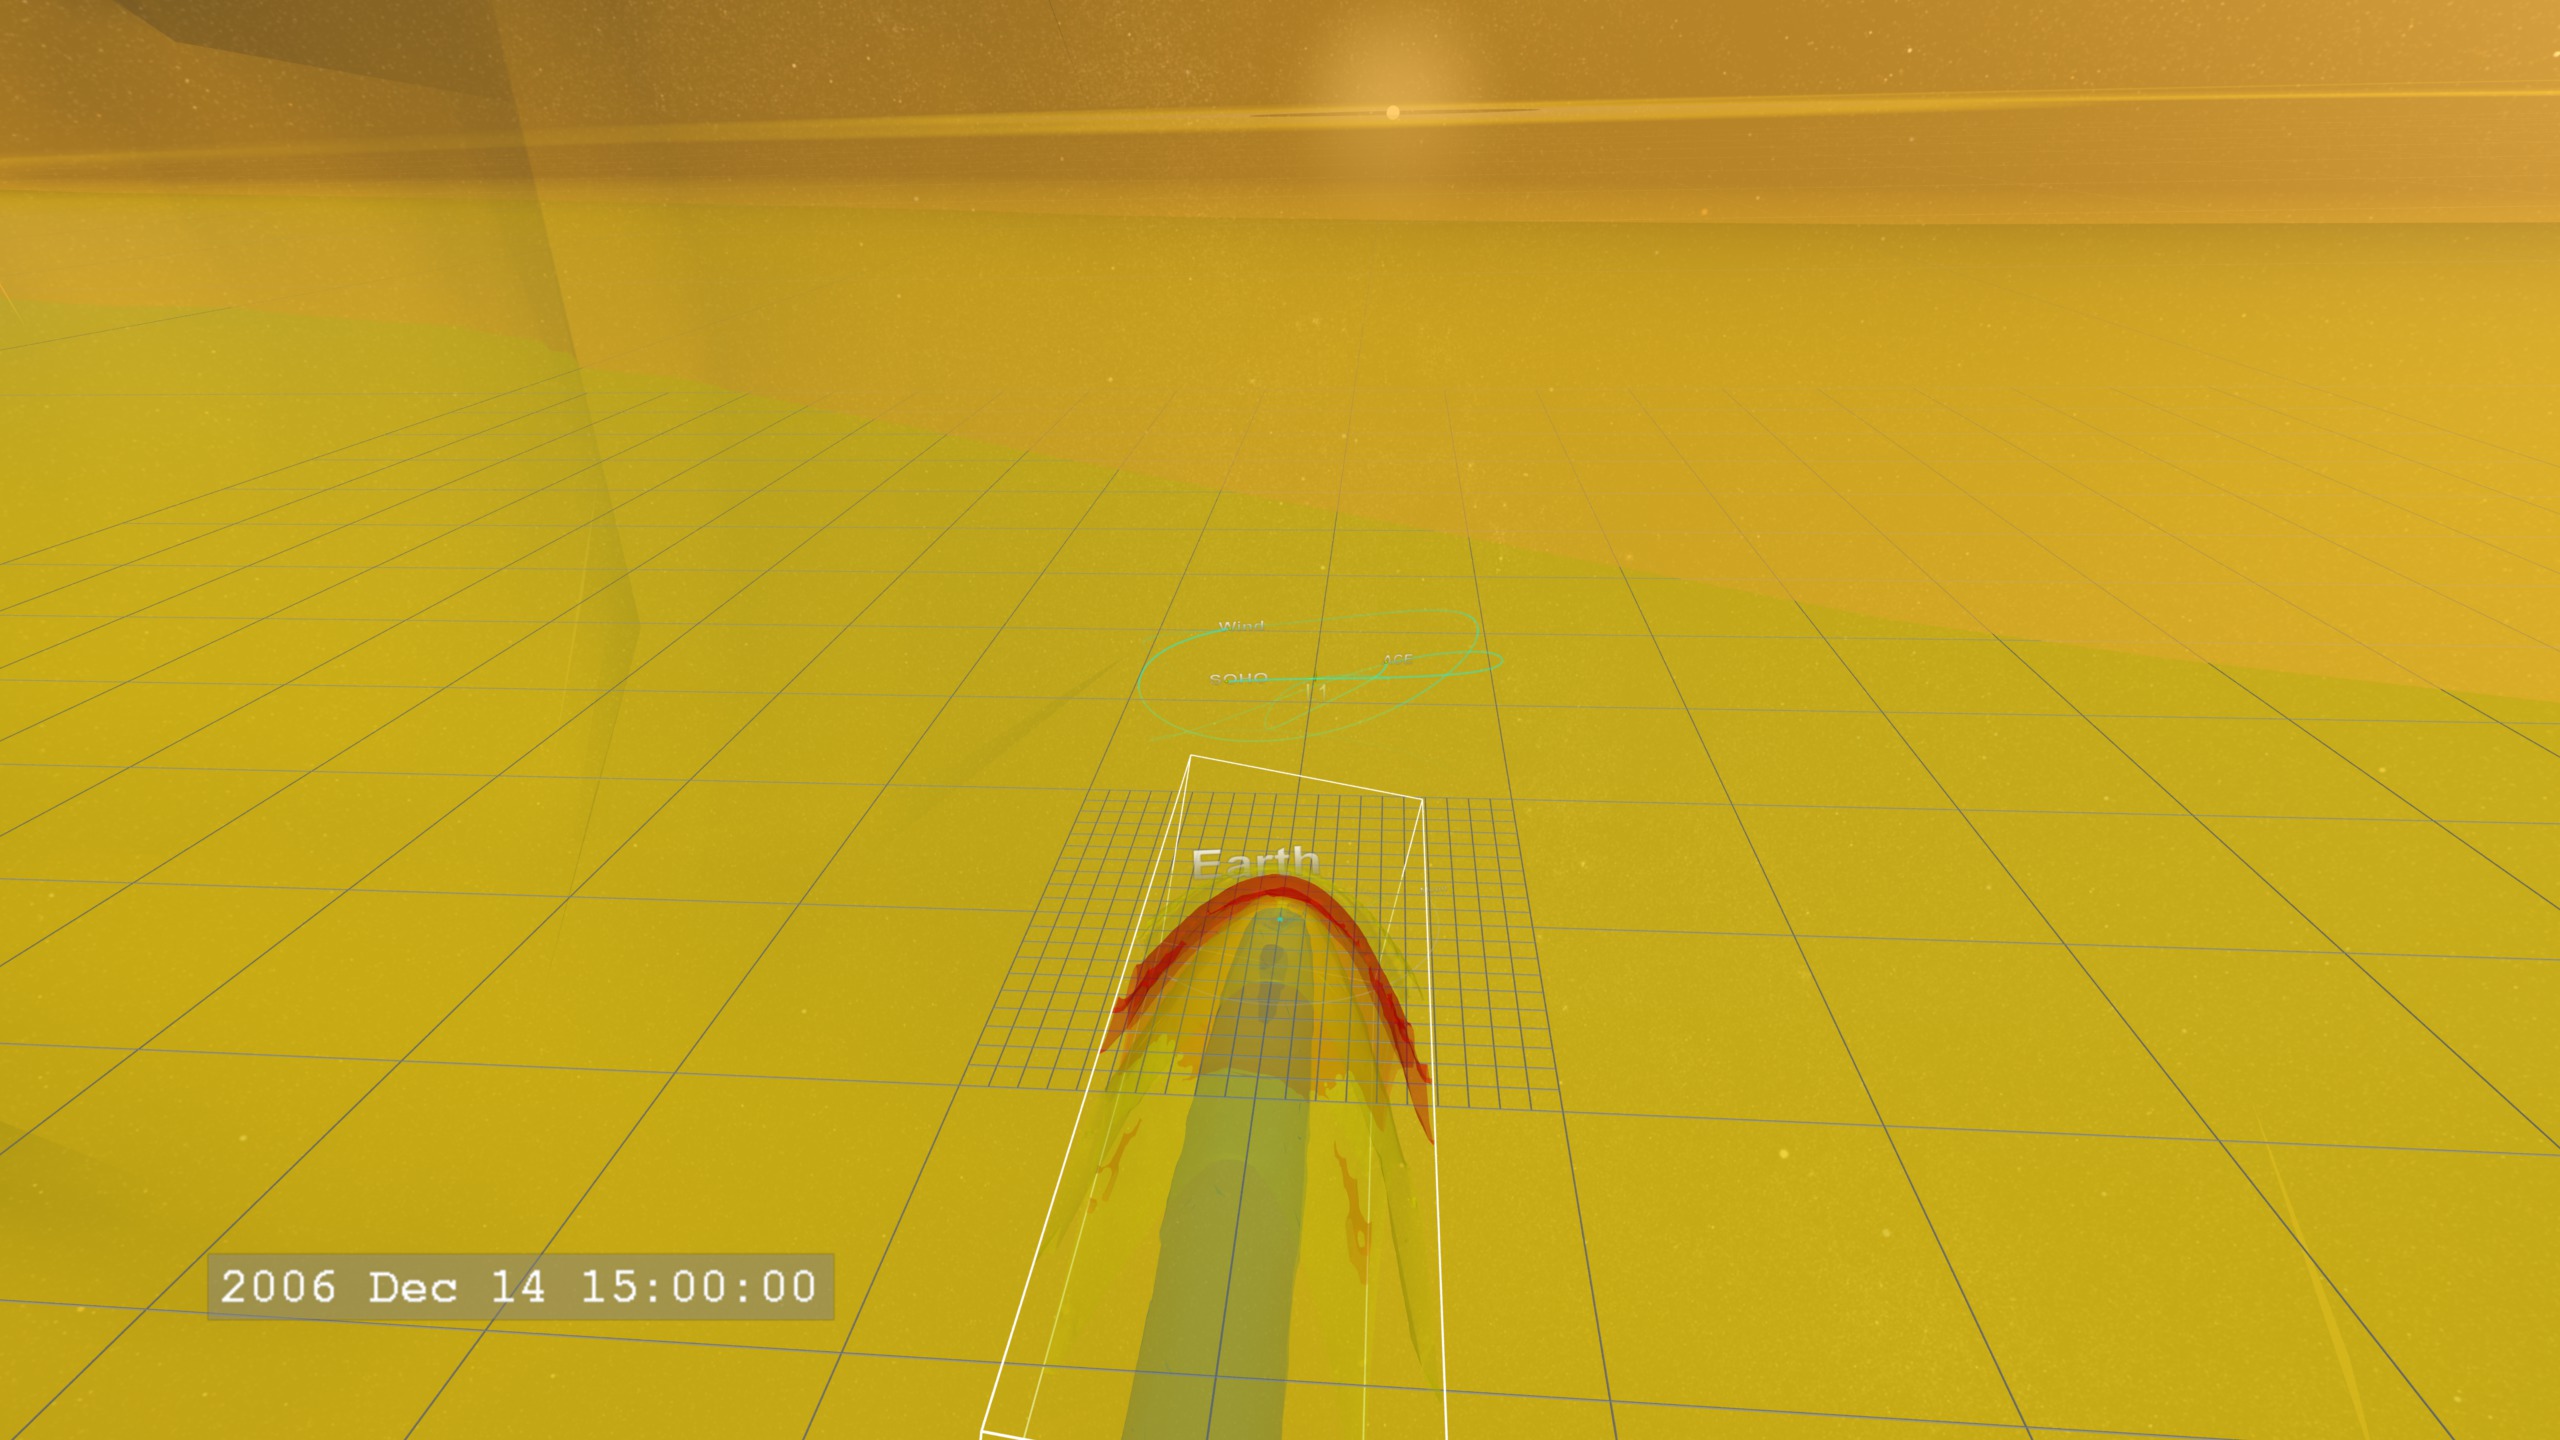
As the particle density enhancement from the CME strikes the Earth, we see the Earth's magnetosphere respond, with the outer, high density surface (red) 'blown away'. This surface location corresponds roughly to the location of the bow shock. The bow shock has not been eliminated, only some of its particles have been depleted, to be carried off in the CME and solar wind. As the densest material of the CME passes (orange surface), plasma from the CME continues to flow by the Earth, stretching the magnetosphere into a long, thin structure behind the Earth.
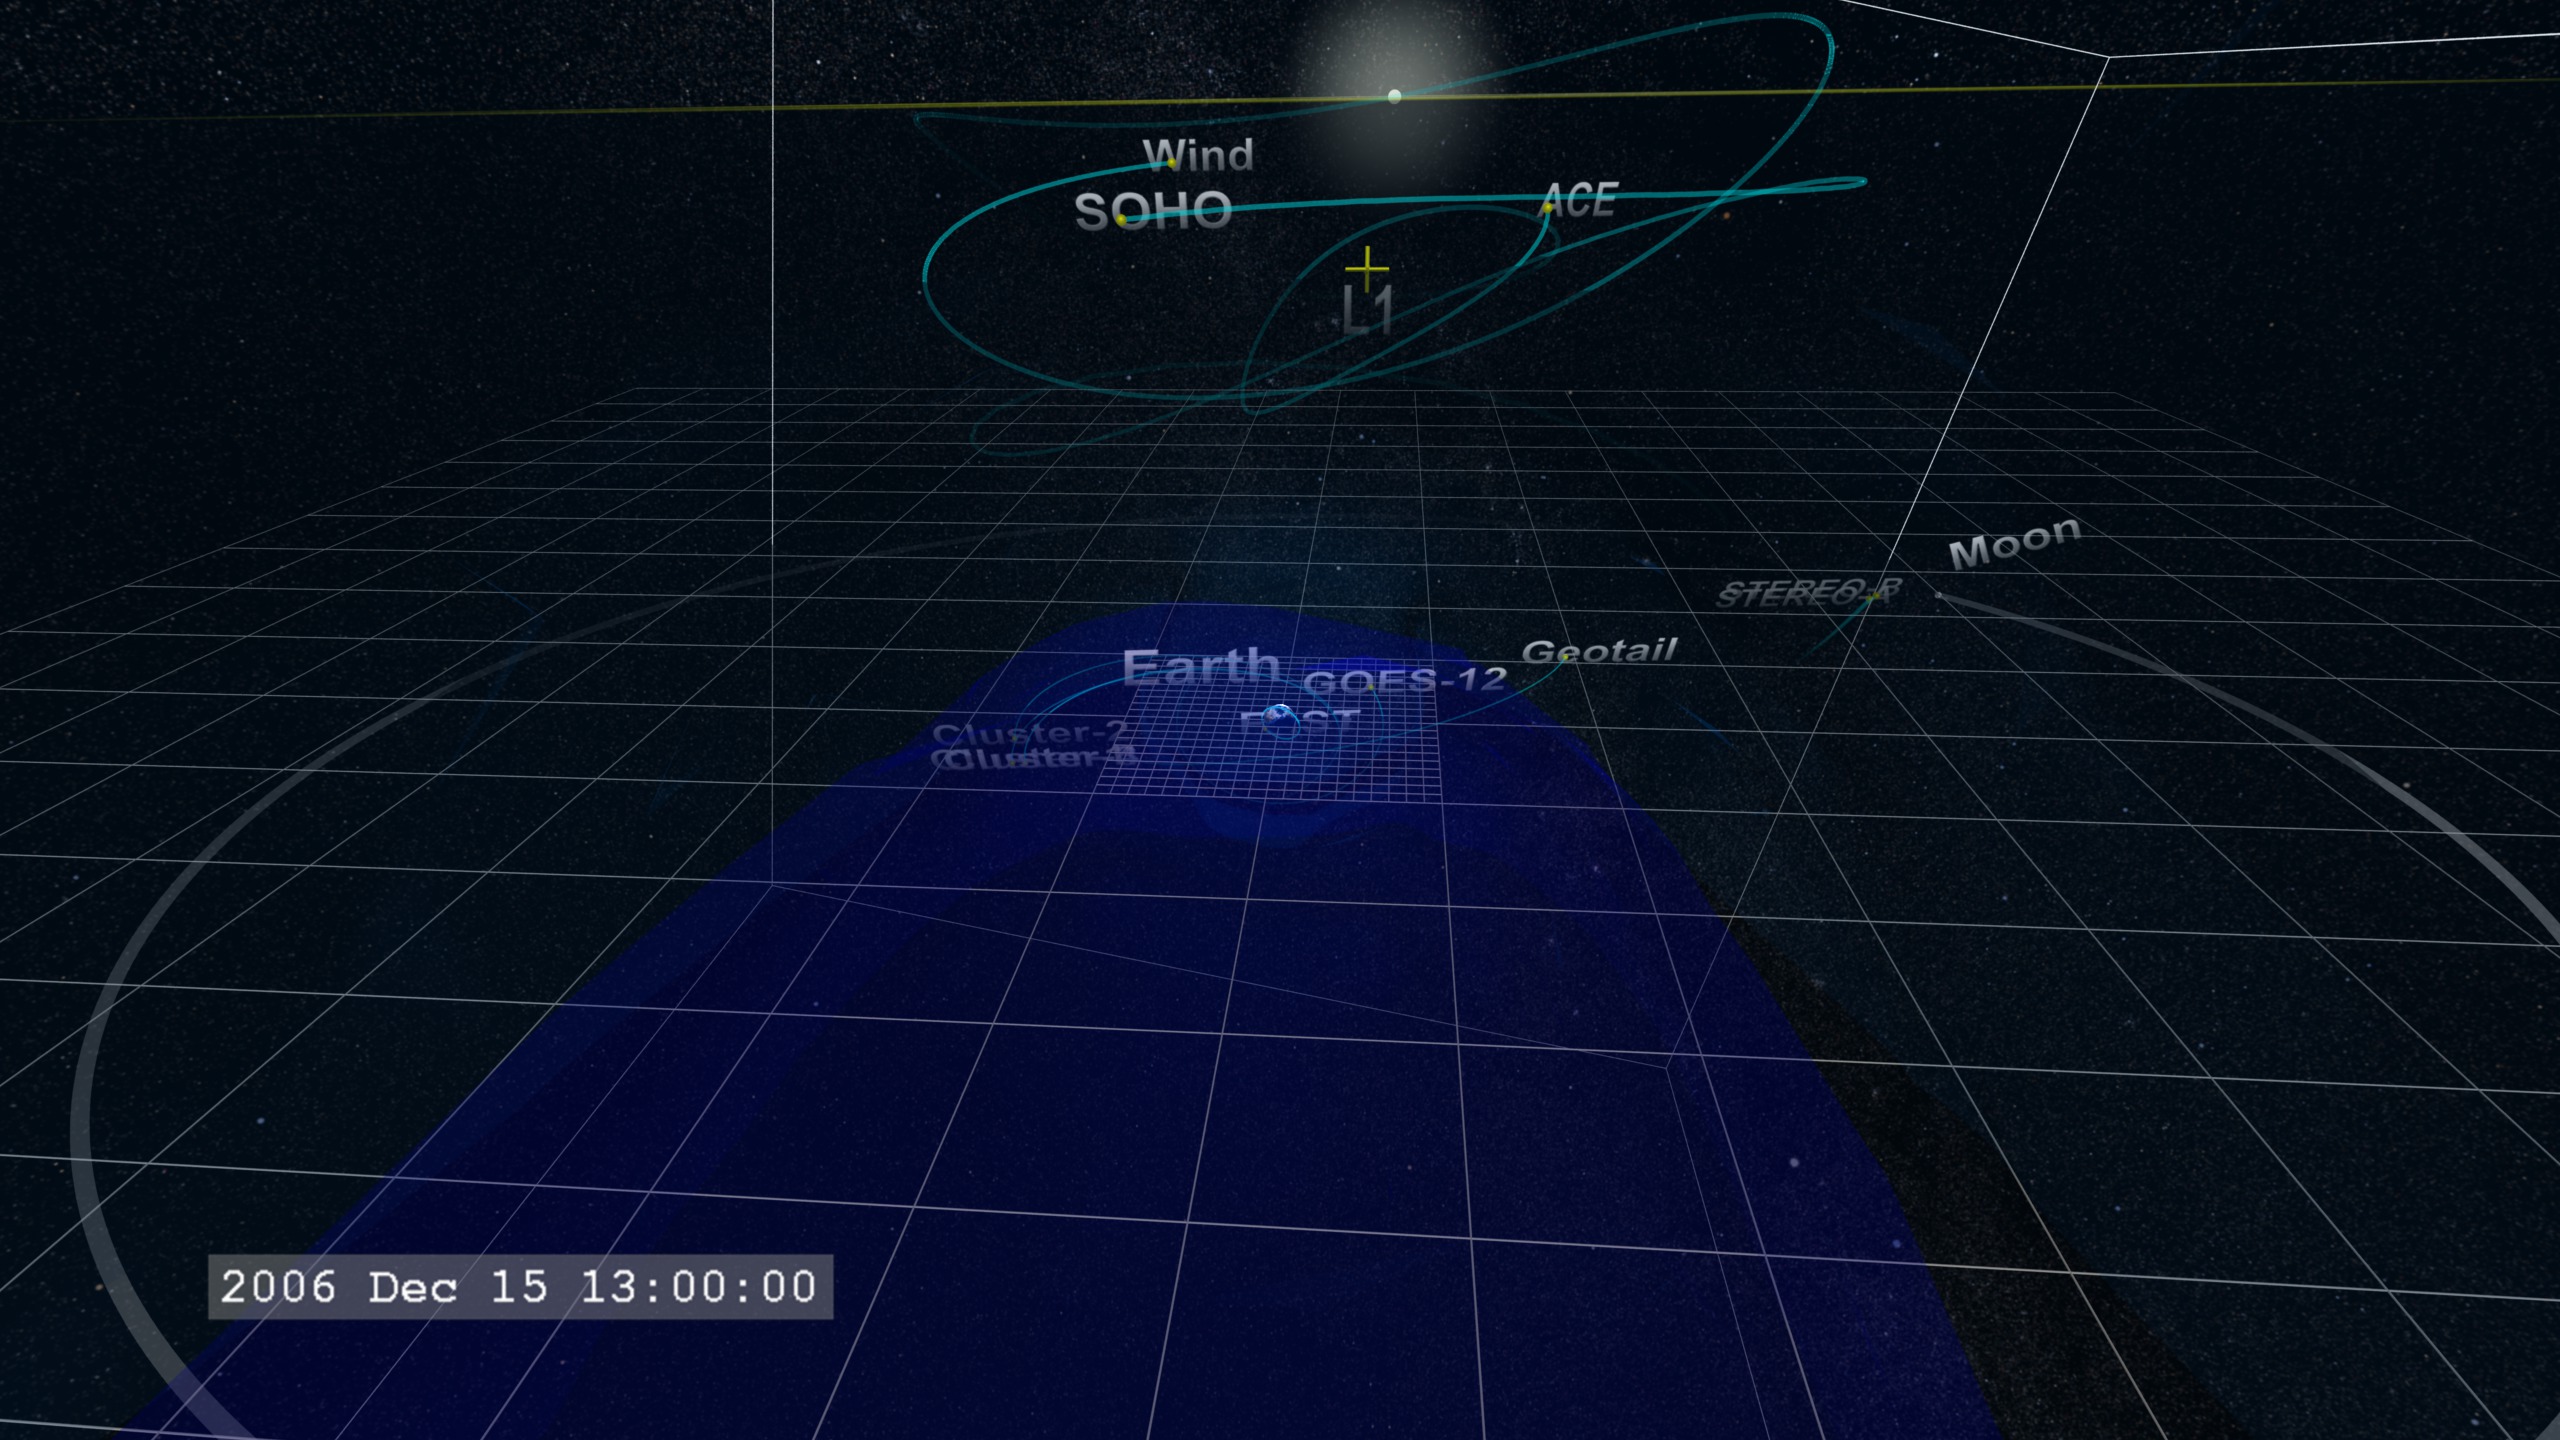
The magnetosphere slowly recovers from the 'impact', and regions that can confine higher particle densities reform - the red surfaces return. But not for long as the rarefaction (Wikipedia) behind the CME reaches the Earth. This lower density region provides fewer particles to repopulate the magnetosphere and makes it easier for particles confined in the magnetosphere to 'leak' out into the solar wind.
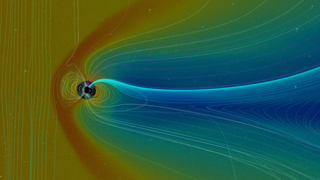
For the BATS-R-US model, the isosurface colors correpond to densities of: red=20 AMUs per cubic centimeter, yellow=10.0 AMUs per cubic centimeter, light blue=1.0 AMUs per cubic centimeter, and blue=0.1 AMUs per cubic centimeter. An AMU corresponds to about the mass of a hydrogen atom, so the value roughly corresponds to the number of atoms per cubic centimeter.
This visualization is part of a series of visualizations on space weather modeling.

Related
Visualization Credits
Greg Shirah (NASA/GSFC): Animator
Scott Wiessinger (UMBC): Producer
Michael Hesse (NASA/GSFC): Scientist
https://svs.gsfc.nasa.gov/3739
Data Used:
BATS-R-US Magnetosphere Model
Model - Community Coordinated Modeling Center (CCMC) - 2006/12/14T13:00:00 - 2006/12/15T13:00:00SSCweb also referred to as: SSCweb ephemerides
Ephemeris - NASA/GSFC Space Physics Data Facility - 2006/1211T02:24:42 -2006/12/15T23:55:02Enlil Heliospheric Model also referred to as: Enlil Heliospheric Model
Model - Community Coordinated Modeling Center (CCMC) - 2006/1211T02:24:42 -2006/12/15T23:55:02JPL/Horizon Orbital Ephemerides
Ephemeris - NASA/JPL - 2006/1211T02:24:42 -2006/12/15T23:55:02This item is part of this series:
Space Weather Modeling
Keywords:
SVS >> Computer Model
SVS >> Geomagnetic Field
SVS >> HDTV
SVS >> Magnetosphere
GCMD >> Earth Science >> Sun-earth Interactions
GCMD >> Earth Science >> Sun-earth Interactions >> Solar Activity
SVS >> Space Weather
NASA Science >> Sun
GCMD >> Earth Science >> Sun-earth Interactions >> Solar Activity >> Coronal Mass Ejections
GCMD keywords can be found on the Internet with the following citation: Olsen, L.M., G. Major, K. Shein, J. Scialdone, S. Ritz, T. Stevens, M. Morahan, A. Aleman, R. Vogel, S. Leicester, H. Weir, M. Meaux, S. Grebas, C.Solomon, M. Holland, T. Northcutt, R. A. Restrepo, R. Bilodeau, 2013. NASA/Global Change Master Directory (GCMD) Earth Science Keywords. Version 8.0.0.0.0


