Sun
ID: 4188
In an effort to understand and predict the impact of space weather events on Earth, the Community-Coordinated Modeling Center (CCMC) at NASA Goddard Space Flight Center, routinely runs computer models of the many historical events. These model runs are then compared to actual data to determine ways to improve the model, and therefore forecasts of the impacts of future space weather events.
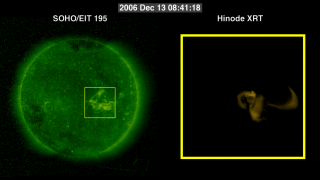
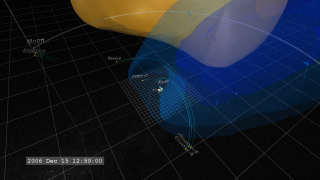
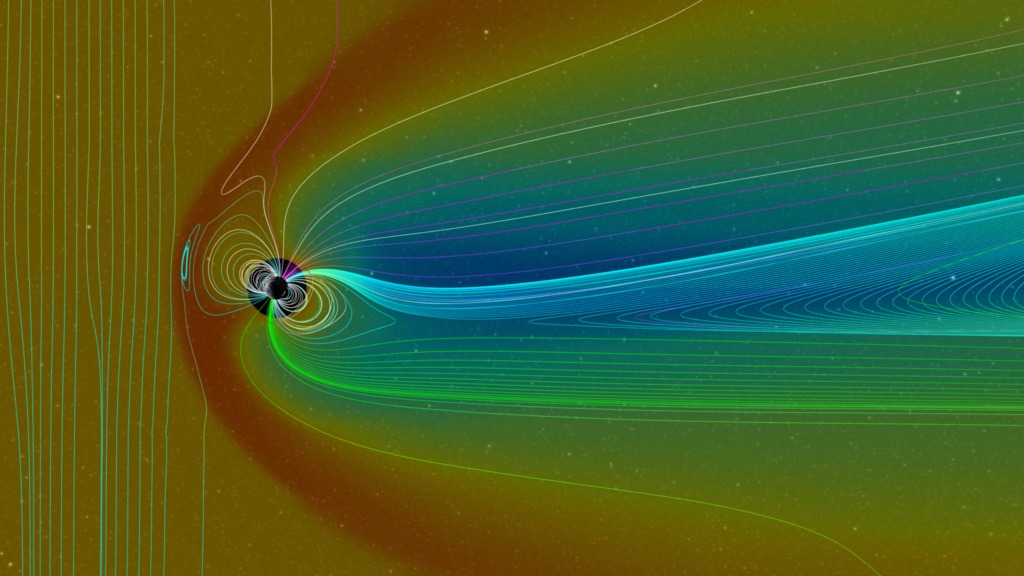
In mid-December of 2006, the Sun erupted with a bright flare and coronal mass ejection (CME) that launched particles Earthward. While not the brightest or largest event observed, its impact on Earth was substantial, requiring some effort to protect satellites (ESA: Reacting to a solar flare).
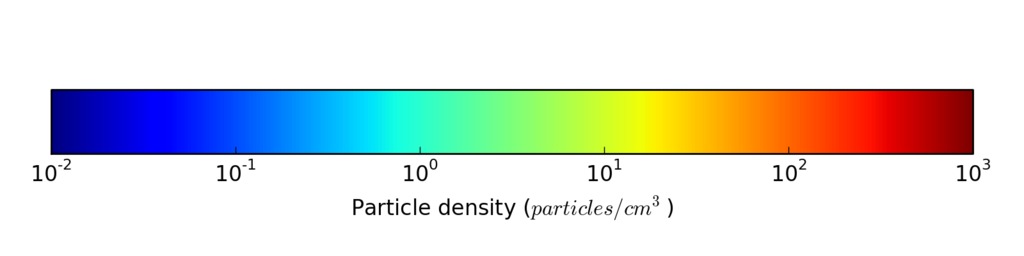
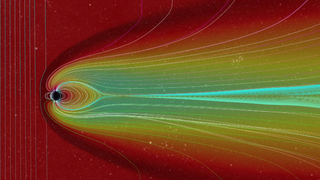
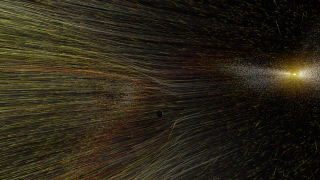
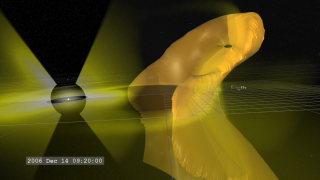
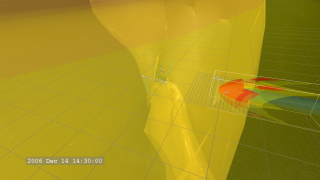
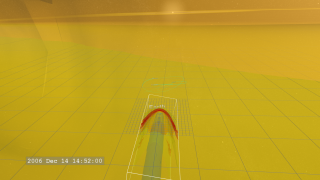
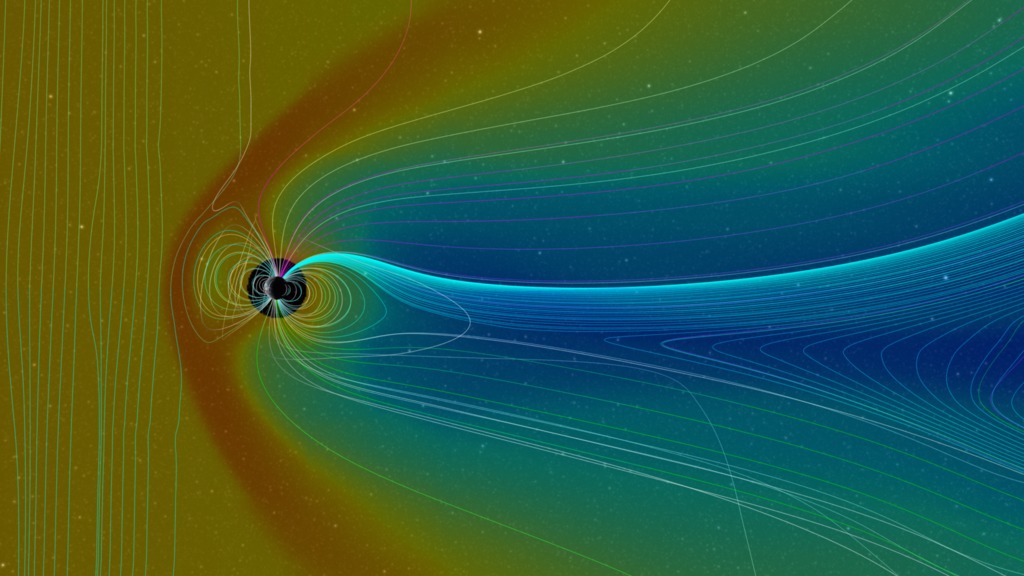
The visualization presented here is a CCMC run of a BATS-R-US model simulating the impact of this event on Earth. Here, lines are used to represent the 'flow direction' of magnetic field of the solar wind impacting Earth, as well as the effects on Earth's geomagnetic field. A 'cut-plane' through the data illustrates the changes in the particle density in the solar wind and magnetosphere. The color of the data represents a logarithmic scaling of density, with red as the highest (1000 particles per cubic centimeter) down to blue (0.01 particles per cubic centimeter). In this simulation, each frame of the movie corresponds to two minutes of real time.
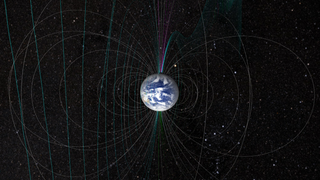
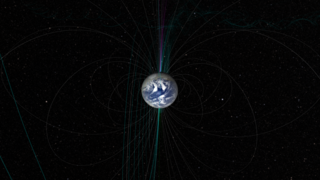
In the movie, we see vertical field lines of magnetic field carried by the solar wind, coming in from the left. As this field, and the plasma carrying it, strike Earth's magnetic field, they bend and reconnect, around the Earth. Some field lines actually reconnect to the polar regions of the Earth, providing a ready flow-path for particles to reach the ionosphere and generate aurora. This interaction between the solar wind and the plasma trapped in Earth's magnetosphere also creates a density enhancement between Earth and the solar wind helping to shield Earth from some of the effects. A lower density wake forms behind Earth (the blue region). There is a circular 'hole' around the Earth which is a gap in the model.
Comparative Magnetospheres: A Noteworthy Coronal Mass Ejection
In mid-December of 2006, the Sun erupted with a bright flare and coronal mass ejection (CME) that launched particles Earthward. While not the brightest or largest event observed, its impact on Earth was substantial, requiring some effort to protect satellites (ESA: Reacting to a solar flare).
The visualization presented here is a CCMC run of a BATS-R-US model simulating the impact of this event on Earth. Here, lines are used to represent the 'flow direction' of magnetic field of the solar wind impacting Earth, as well as the effects on Earth's geomagnetic field. A 'cut-plane' through the data illustrates the changes in the particle density in the solar wind and magnetosphere. The color of the data represents a logarithmic scaling of density, with red as the highest (1000 particles per cubic centimeter) down to blue (0.01 particles per cubic centimeter). In this simulation, each frame of the movie corresponds to two minutes of real time.
In the movie, we see vertical field lines of magnetic field carried by the solar wind, coming in from the left. As this field, and the plasma carrying it, strike Earth's magnetic field, they bend and reconnect, around the Earth. Some field lines actually reconnect to the polar regions of the Earth, providing a ready flow-path for particles to reach the ionosphere and generate aurora. This interaction between the solar wind and the plasma trapped in Earth's magnetosphere also creates a density enhancement between Earth and the solar wind helping to shield Earth from some of the effects. A lower density wake forms behind Earth (the blue region). There is a circular 'hole' around the Earth which is a gap in the model.
Related
Visualization Credits
Tom Bridgman (Global Science and Technology, Inc.): Lead Animator
Genna Duberstein (USRA): Producer
Michael Hesse (NASA/GSFC): Scientist
Laurence Schuler (ADNET Systems, Inc.): Project Support
Ian Jones (ADNET Systems, Inc.): Project Support
Genna Duberstein (USRA): Producer
Michael Hesse (NASA/GSFC): Scientist
Laurence Schuler (ADNET Systems, Inc.): Project Support
Ian Jones (ADNET Systems, Inc.): Project Support
Short URL to share this page:
https://svs.gsfc.nasa.gov/4188
Data Used:
Note: While we identify the data sets used in these visualizations, we do not store any further details nor the data sets themselves on our site.
This item is part of this series:
Comparative Magnetospheres
Keywords:
SVS >> Magnetosphere
SVS >> Solar Wind
GCMD >> Location >> Magnetotail
SVS >> Space Weather
SVS >> Hyperwall
SVS >> Heliophysics
NASA Science >> Sun
GCMD >> Earth Science >> Sun-earth Interactions >> Solar Activity >> Coronal Mass Ejections
GCMD keywords can be found on the Internet with the following citation: Olsen, L.M., G. Major, K. Shein, J. Scialdone, S. Ritz, T. Stevens, M. Morahan, A. Aleman, R. Vogel, S. Leicester, H. Weir, M. Meaux, S. Grebas, C.Solomon, M. Holland, T. Northcutt, R. A. Restrepo, R. Bilodeau, 2013. NASA/Global Change Master Directory (GCMD) Earth Science Keywords. Version 8.0.0.0.0
https://svs.gsfc.nasa.gov/4188
Data Used:
BATS-R-US Magnetosphere Model
Model - Community Coordinated Modeling Center (CCMC) - 2006/12/14T13:00:00 - 2006/12/15T13:00:00
MHD Magnetospheric simulation
This item is part of this series:
Comparative Magnetospheres
Keywords:
SVS >> Magnetosphere
SVS >> Solar Wind
GCMD >> Location >> Magnetotail
SVS >> Space Weather
SVS >> Hyperwall
SVS >> Heliophysics
NASA Science >> Sun
GCMD >> Earth Science >> Sun-earth Interactions >> Solar Activity >> Coronal Mass Ejections
GCMD keywords can be found on the Internet with the following citation: Olsen, L.M., G. Major, K. Shein, J. Scialdone, S. Ritz, T. Stevens, M. Morahan, A. Aleman, R. Vogel, S. Leicester, H. Weir, M. Meaux, S. Grebas, C.Solomon, M. Holland, T. Northcutt, R. A. Restrepo, R. Bilodeau, 2013. NASA/Global Change Master Directory (GCMD) Earth Science Keywords. Version 8.0.0.0.0


