Earth
ID: 3678
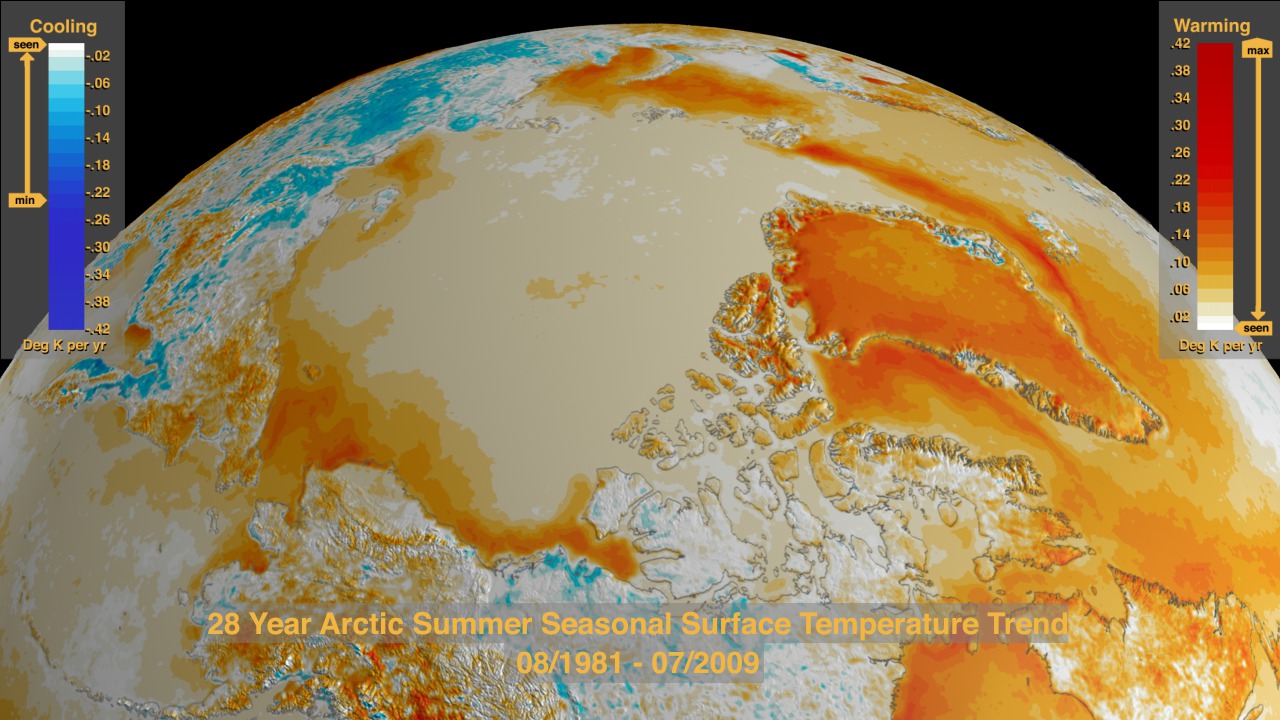
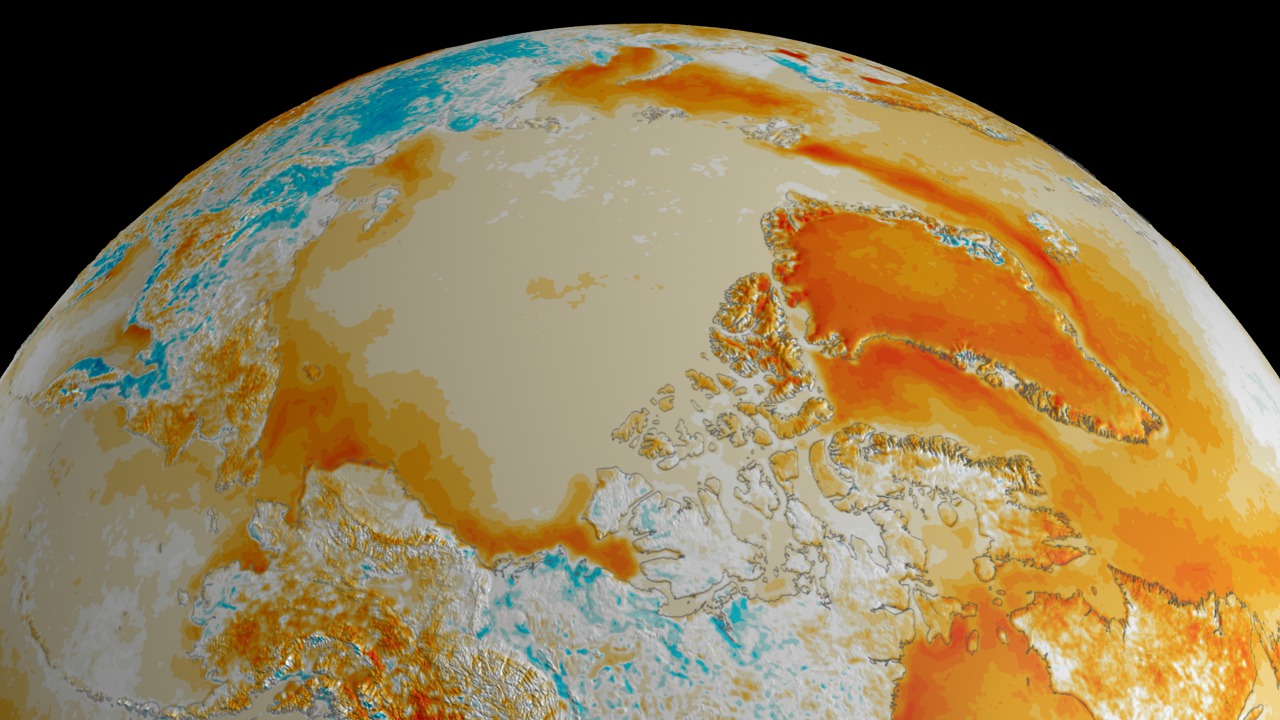
The Arctic region has been an area of scientific interest because it is expected that global warming signals will be amplified in the region because of ice-albedo feedback effect. Such effect is associated with the high albedo of snow and sea ice covered areas compared to that of ice free ocean and land areas. This animation depicts the 28-year summer seasonal surface temperature trend over the Arctic region determined from data collected during the months of June, July and August between 1982 and 2009.

28 Year Arctic Summer Seasonal Temperature Trend
In this animation, the warming and cooling regions are revealed in steps of .02 degrees change per year starting with the regions of greatest change and progressing to the areas of least change. Blue hues indicate cooling regions while red hues depict warming. The neutral region of -.01 to +.01 degrees is shown in white. Brighter regions indicate greater temperature change while light regions indicate less. On the left side, the colarbar shows cooling temperatures ranging from -0.42 to zero degrees Kelvin, while the colorbar on the right shows warming temperatures ranging from zero to +0.42 degrees per year. An animated bar beside each colorbar brackets the range of data values being displayed.
Visualization Credits
Cindy Starr (Global Science and Technology, Inc.): Lead Visualizer
Josefino Comiso (NASA/GSFC): Scientist
Josefino Comiso (NASA/GSFC): Scientist
Please give credit for this item to:
NASA/Goddard Space Flight Center Scientific Visualization Studio
NASA/Goddard Space Flight Center Scientific Visualization Studio
Short URL to share this page:
https://svs.gsfc.nasa.gov/3678
Data Used:
Note: While we identify the data sets used in these visualizations, we do not store any further details nor the data sets themselves on our site.
This item is part of this series:
28 Year Arctic Temperature Trend
Keywords:
SVS >> Global Warming
SVS >> HDTV
SVS >> Ice Sheets
SVS >> Sea Ice
SVS >> Surface Temperature
SVS >> Temperature Trend
SVS >> For Educators
SVS >> Cryosphere >> Snow/ice
SVS >> Glaciers
SVS >> Seasons >> Vegetation
NASA Science >> Earth
https://svs.gsfc.nasa.gov/3678
Data Used:
NOAA-7, 9, 11, 14, 16, 17, 18/AVHRR/Arctic Temperature Trends
Data Compilation - Josefino Comiso - June, July and August from 1982 through 2009This item is part of this series:
28 Year Arctic Temperature Trend
Keywords:
SVS >> Global Warming
SVS >> HDTV
SVS >> Ice Sheets
SVS >> Sea Ice
SVS >> Surface Temperature
SVS >> Temperature Trend
SVS >> For Educators
SVS >> Cryosphere >> Snow/ice
SVS >> Glaciers
SVS >> Seasons >> Vegetation
NASA Science >> Earth


