Earth
ID: 3661
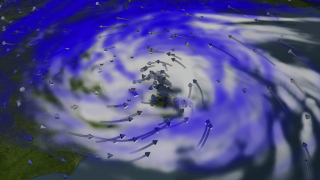
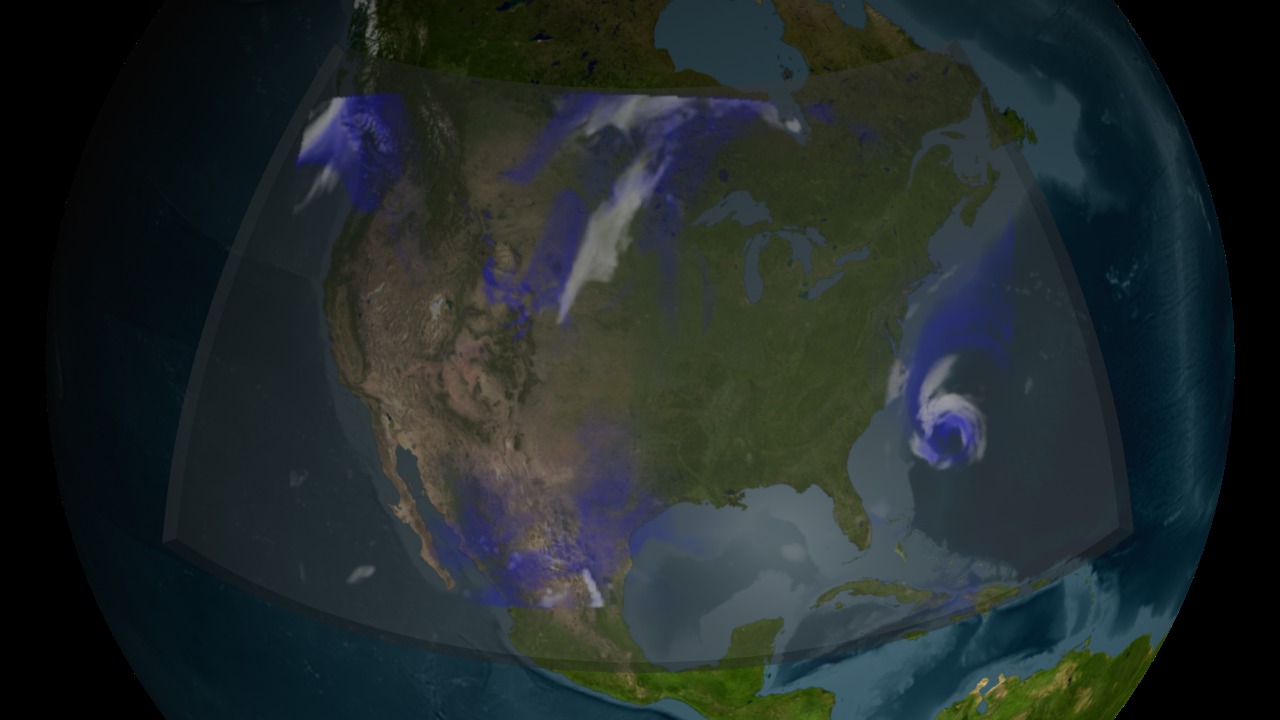
This visualization shows cloud and ice data from an atmospheric simulation using the Weather Research and Forecasting (WRF) Model. Clouds are shown as levels of white; and, ice is shown as levels of blue. Cloud and ice data from the model are volumetric (i.e. in multiple pressure levels).
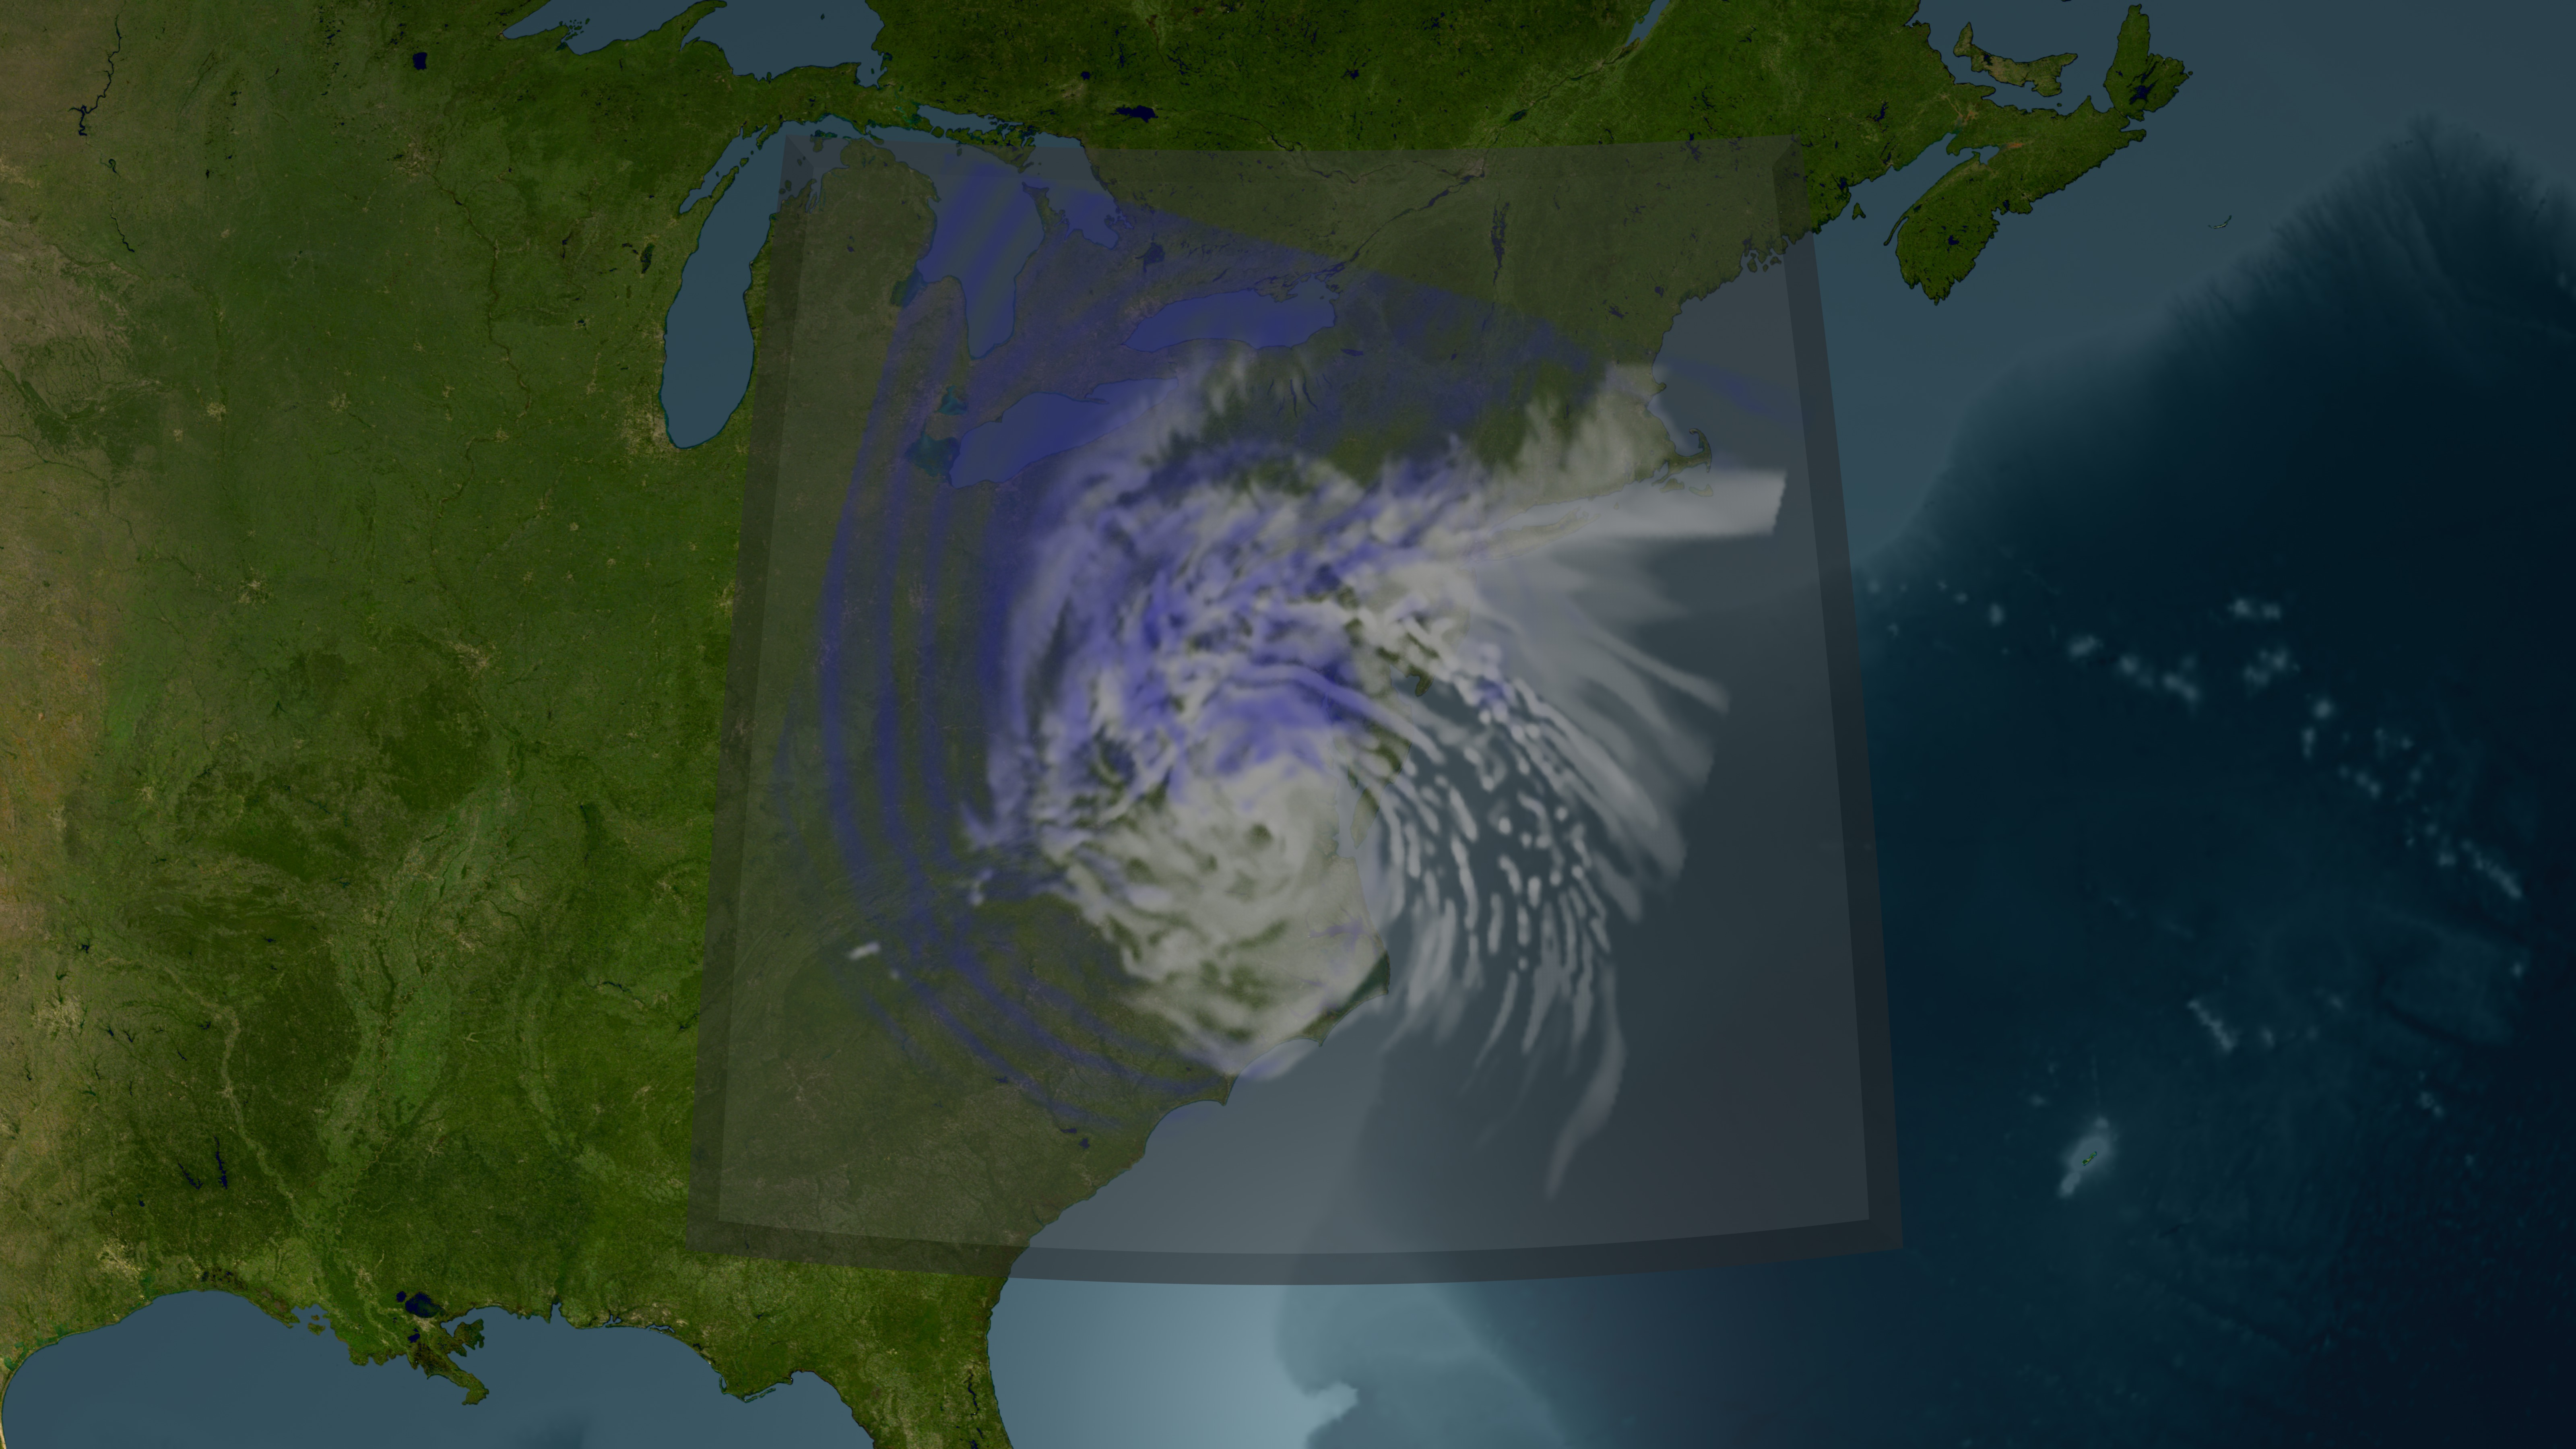
Volume Renderings of Hurricane Isabel based on the WRF Computational Model (Three Resolutions)
Three different reolution runs are shown as the camera moves in towards the East coast:
1. 36 km per grid cell every hour covering most of the northern hemisphere (volume size: 415x270x27)
2. 12 km per grid cell every hour covering central North America (volume size: 438x300x27)
3. 4 km per grid cell every 5 minutes covering the US East coast (volume size: 300x300x27)
This visualization was created in support of a video about the Climate in a Box project. for the Fall 2009 American Geophysical Union (AGU) conference.
Related
Visualization Credits
Greg Shirah (NASA/GSFC): Animator
Horace Mitchell (NASA/GSFC): Animator
Victoria Weeks (HTSI): Video Editor
Michael Starobin (HTSI): Producer
Tsendgar J. Lee (NASA/HQ): Scientist
Horace Mitchell (NASA/GSFC): Animator
Victoria Weeks (HTSI): Video Editor
Michael Starobin (HTSI): Producer
Tsendgar J. Lee (NASA/HQ): Scientist
Please give credit for this item to:
NASA/Goddard Space Flight Center Scientific Visualization Studio The Blue Marble Next Generation data is courtesy of Reto Stockli (NASA/GSFC) and NASA's Earth Observatory.
NASA/Goddard Space Flight Center Scientific Visualization Studio The Blue Marble Next Generation data is courtesy of Reto Stockli (NASA/GSFC) and NASA's Earth Observatory.
Short URL to share this page:
https://svs.gsfc.nasa.gov/3661
Mission:
Terra
Data Used:
Note: While we identify the data sets used in these visualizations, we do not store any further details nor the data sets themselves on our site.
This item is part of this series:
Climate in a Box
Keywords:
SVS >> Clouds
SVS >> HDTV
SVS >> Ice
GCMD >> Earth Science >> Atmosphere >> Atmospheric Phenomena
GCMD >> Earth Science >> Human Dimensions >> Natural Hazards >> Fires
SVS >> Hyperwall
SVS >> iPod
SVS >> For Educators
SVS >> Atmosphere >> Winds >> Circulation
SVS >> Water Cycle >> Condensation
SVS >> Hurricanes >> Jeanne
NASA Science >> Earth
GCMD keywords can be found on the Internet with the following citation: Olsen, L.M., G. Major, K. Shein, J. Scialdone, S. Ritz, T. Stevens, M. Morahan, A. Aleman, R. Vogel, S. Leicester, H. Weir, M. Meaux, S. Grebas, C.Solomon, M. Holland, T. Northcutt, R. A. Restrepo, R. Bilodeau, 2013. NASA/Global Change Master Directory (GCMD) Earth Science Keywords. Version 8.0.0.0.0
https://svs.gsfc.nasa.gov/3661
Mission:
Terra
Data Used:
WRF Computational Model also referred to as: WRF
Model - 09/18/2003 through 09/19/2003Terra and Aqua/MODIS/Blue Marble: Next Generation also referred to as: BMNG
1/1/2004 - 12/31/2004
Credit:
The Blue Marble data is courtesy of Reto Stockli (NASA/GSFC).
The Blue Marble data is courtesy of Reto Stockli (NASA/GSFC).
This item is part of this series:
Climate in a Box
Keywords:
SVS >> Clouds
SVS >> HDTV
SVS >> Ice
GCMD >> Earth Science >> Atmosphere >> Atmospheric Phenomena
GCMD >> Earth Science >> Human Dimensions >> Natural Hazards >> Fires
SVS >> Hyperwall
SVS >> iPod
SVS >> For Educators
SVS >> Atmosphere >> Winds >> Circulation
SVS >> Water Cycle >> Condensation
SVS >> Hurricanes >> Jeanne
NASA Science >> Earth
GCMD keywords can be found on the Internet with the following citation: Olsen, L.M., G. Major, K. Shein, J. Scialdone, S. Ritz, T. Stevens, M. Morahan, A. Aleman, R. Vogel, S. Leicester, H. Weir, M. Meaux, S. Grebas, C.Solomon, M. Holland, T. Northcutt, R. A. Restrepo, R. Bilodeau, 2013. NASA/Global Change Master Directory (GCMD) Earth Science Keywords. Version 8.0.0.0.0


