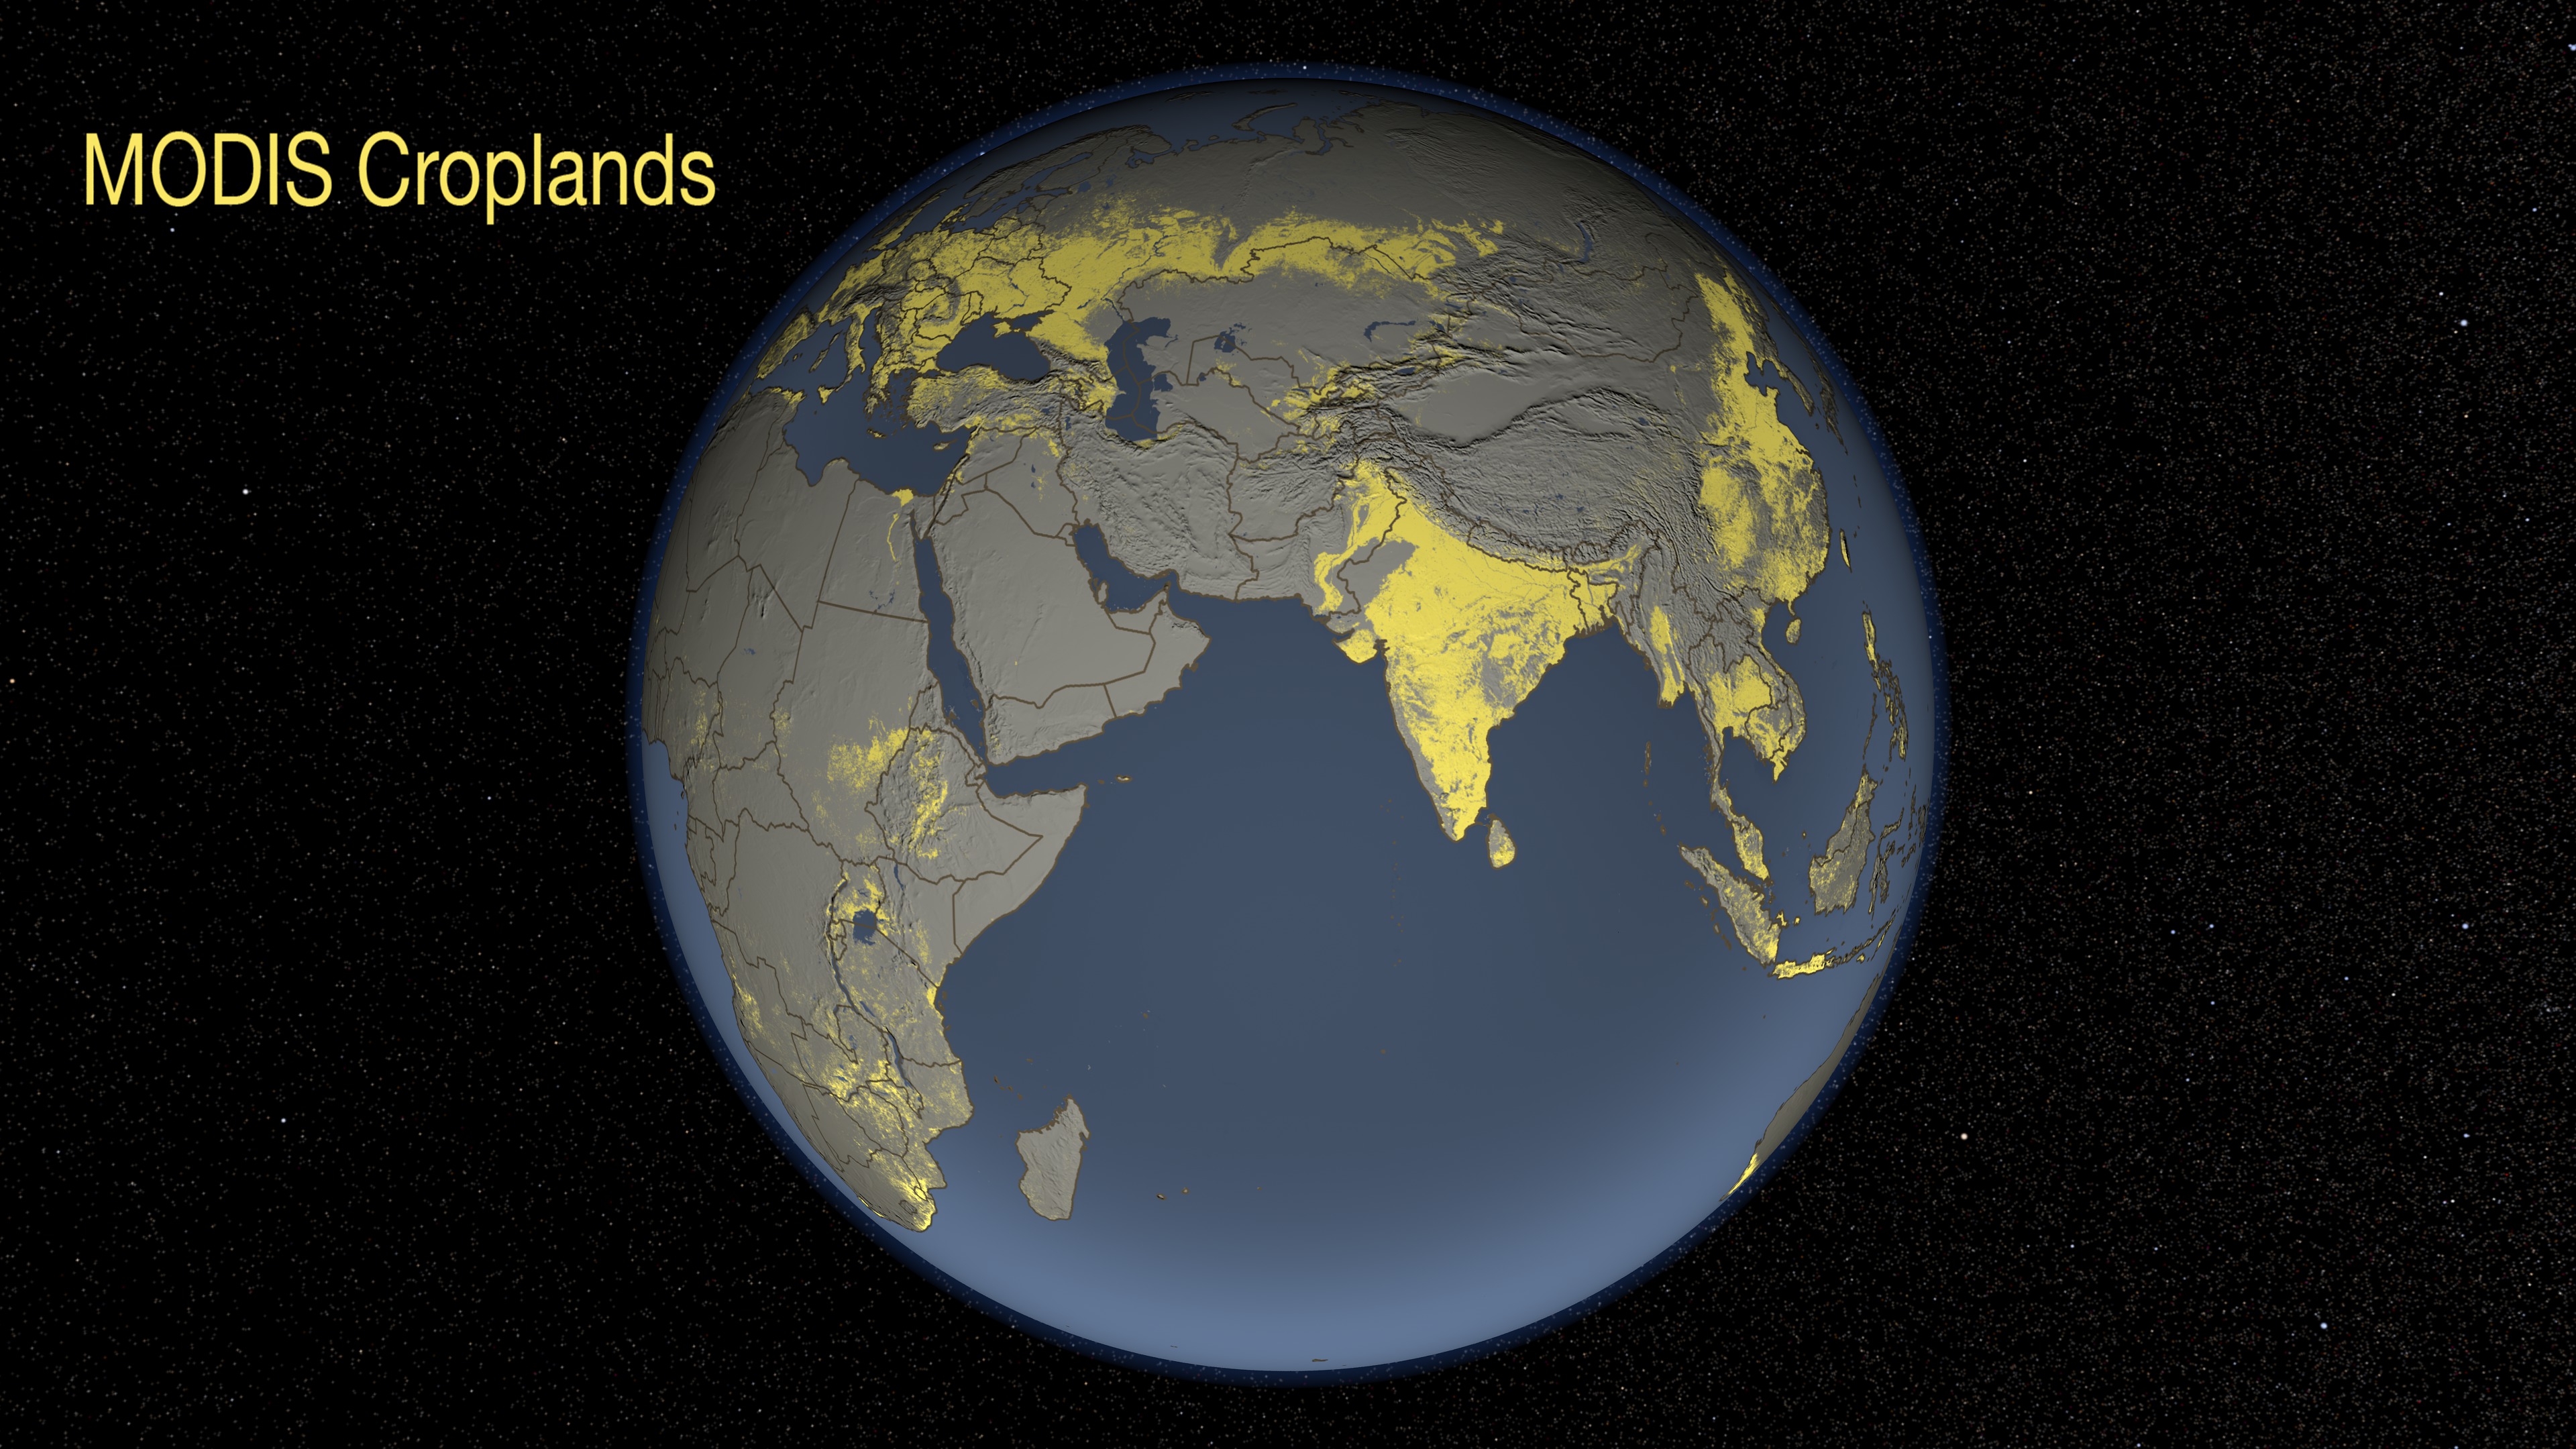
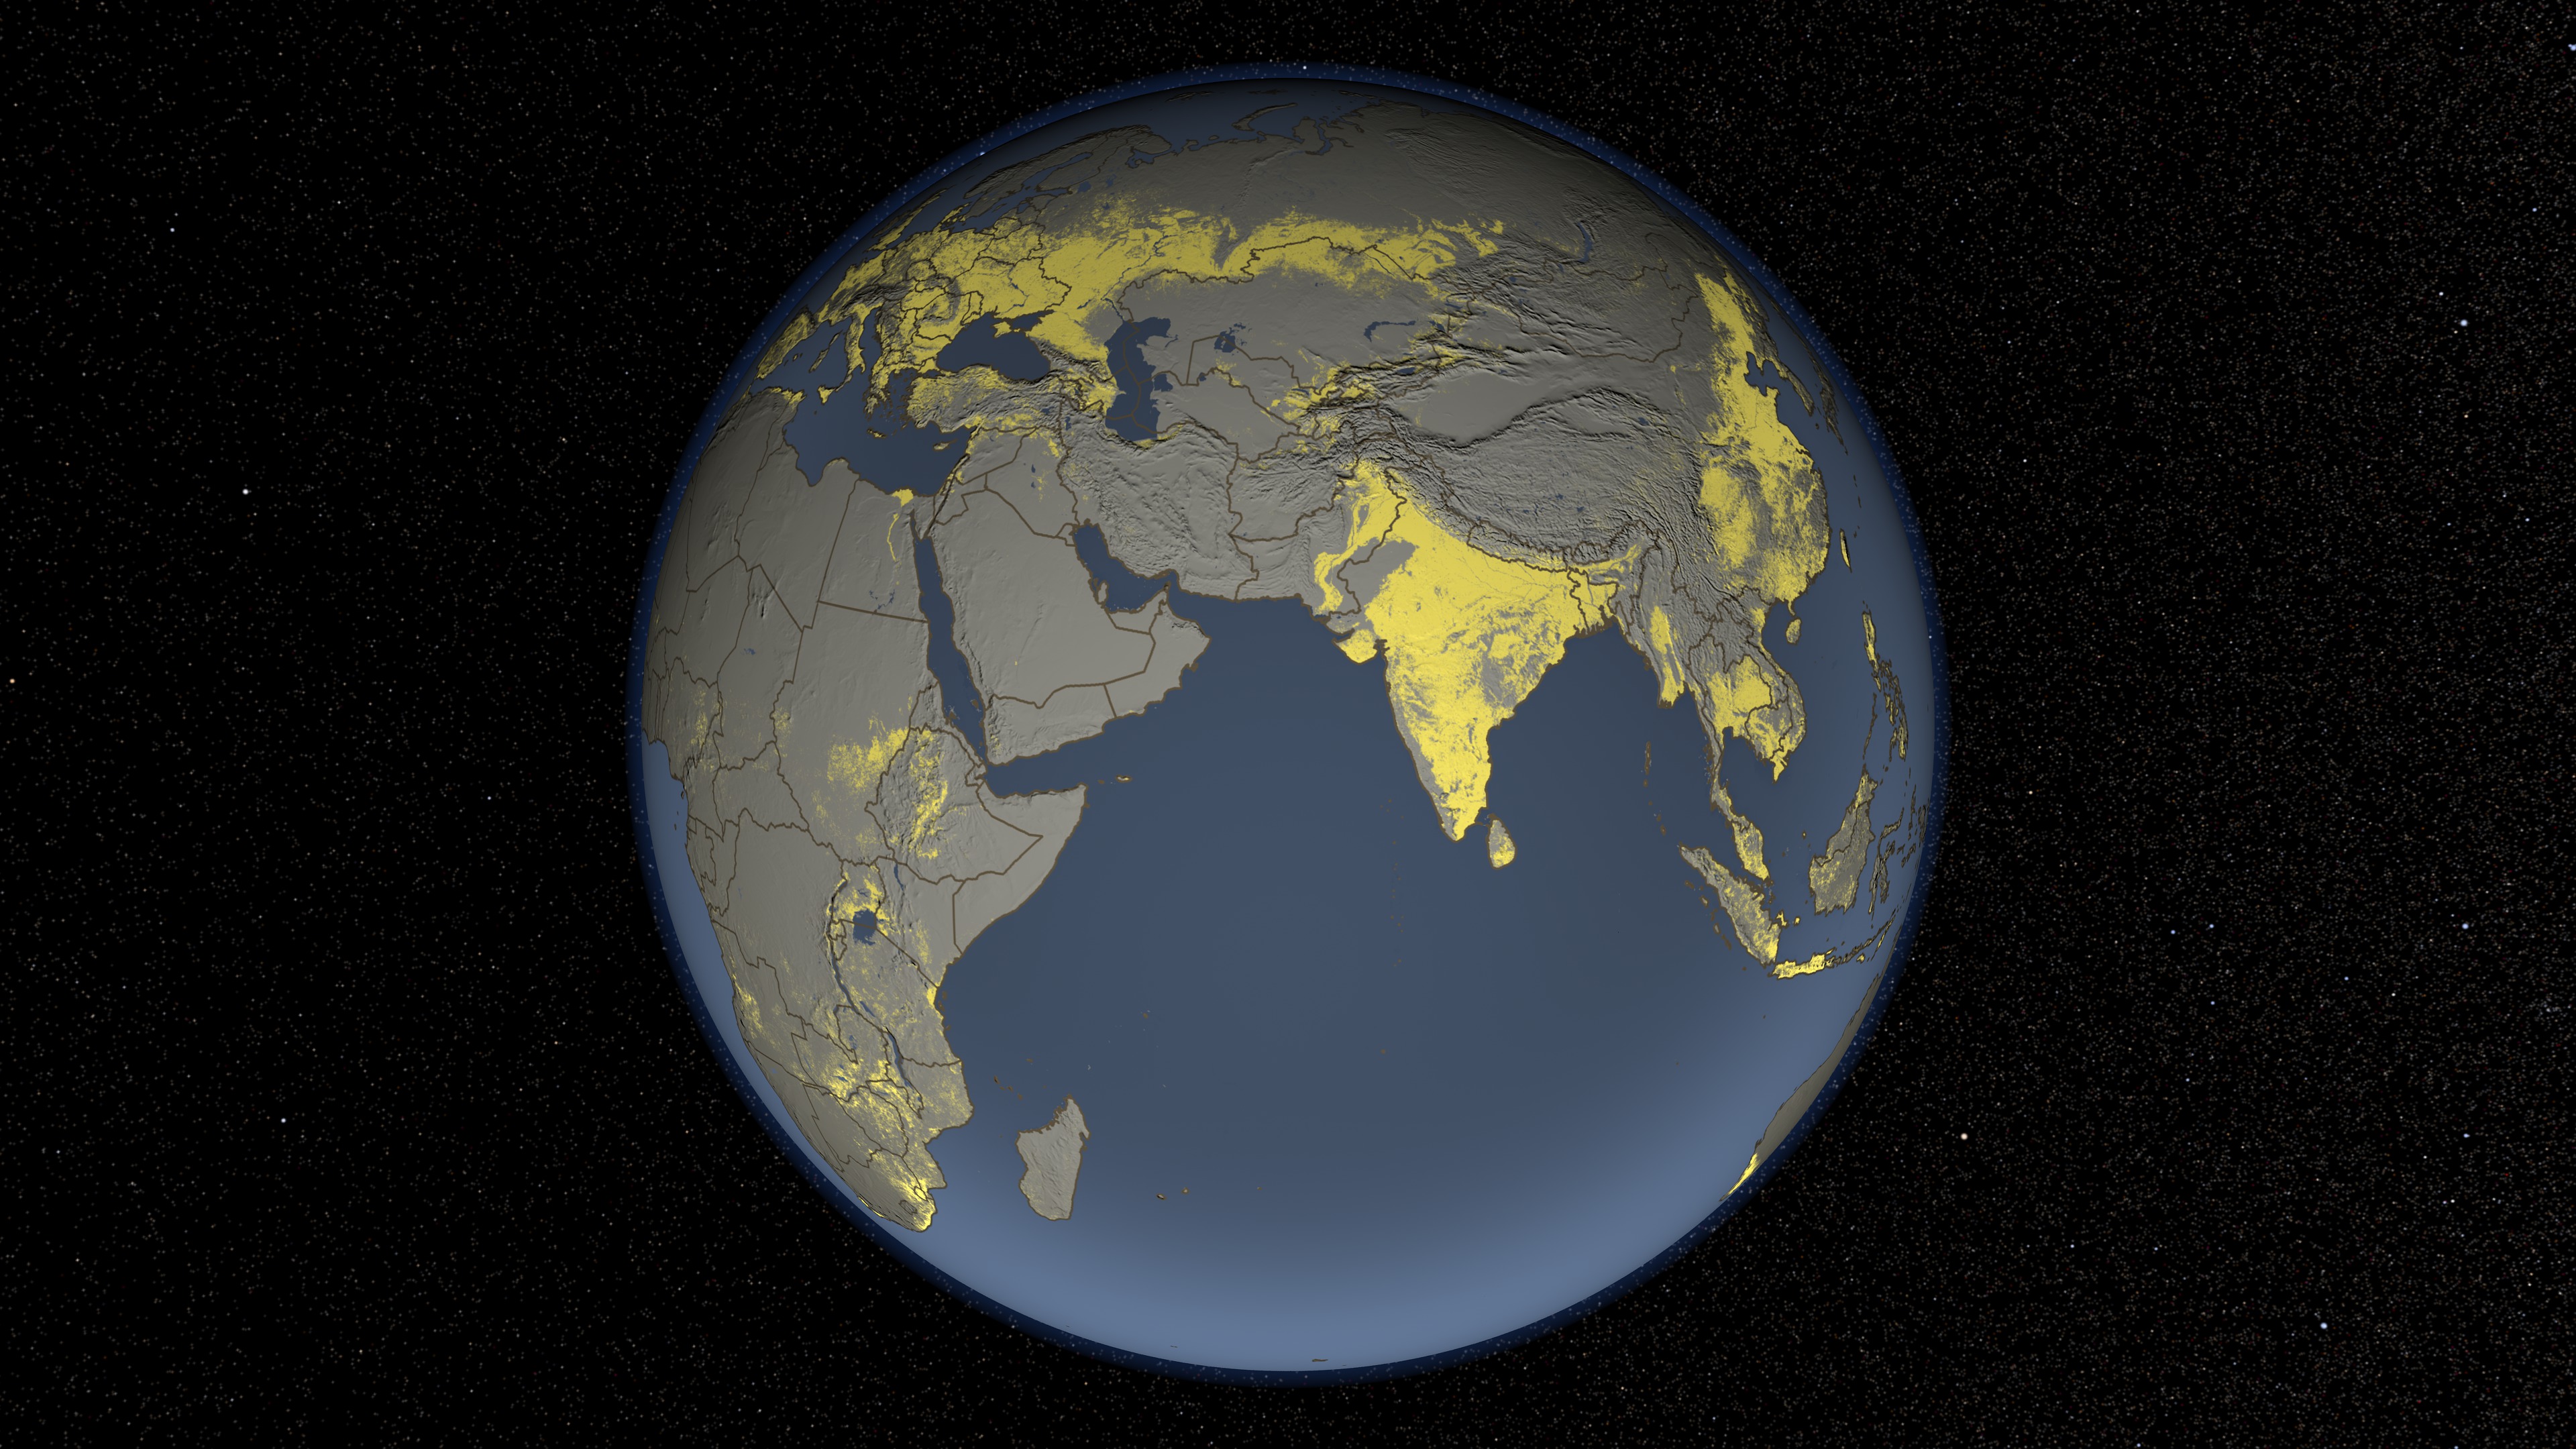
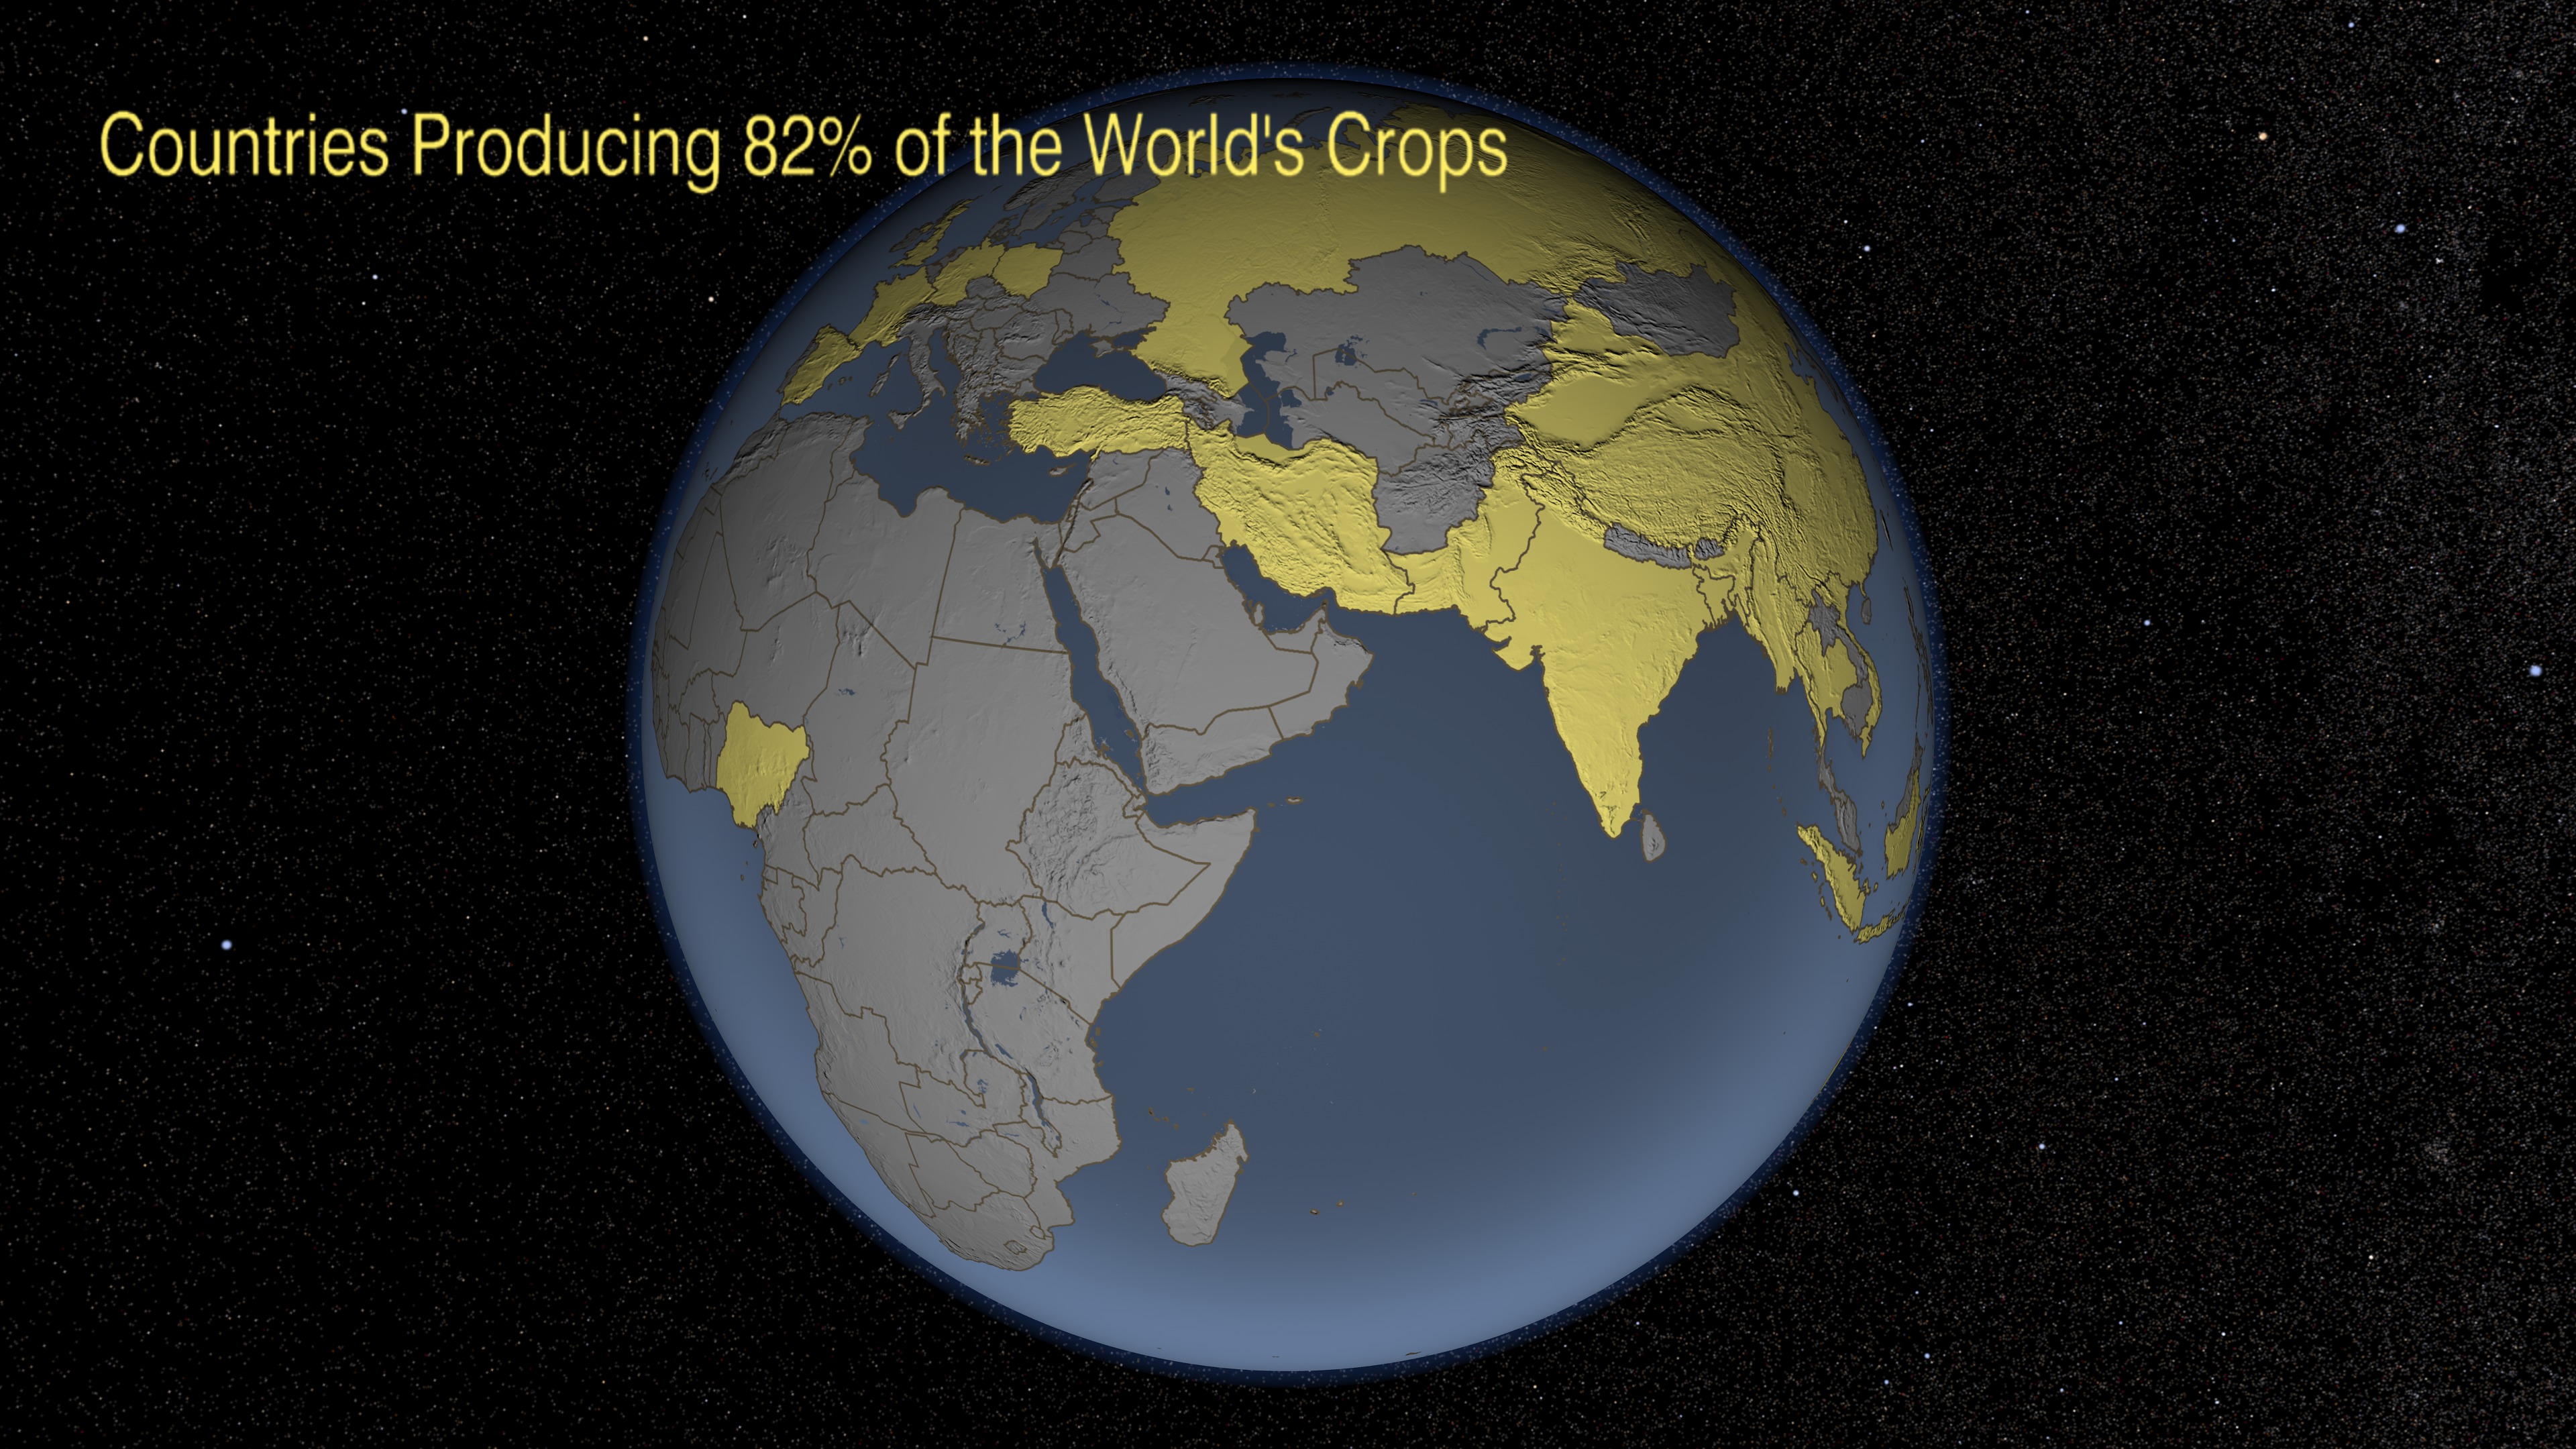
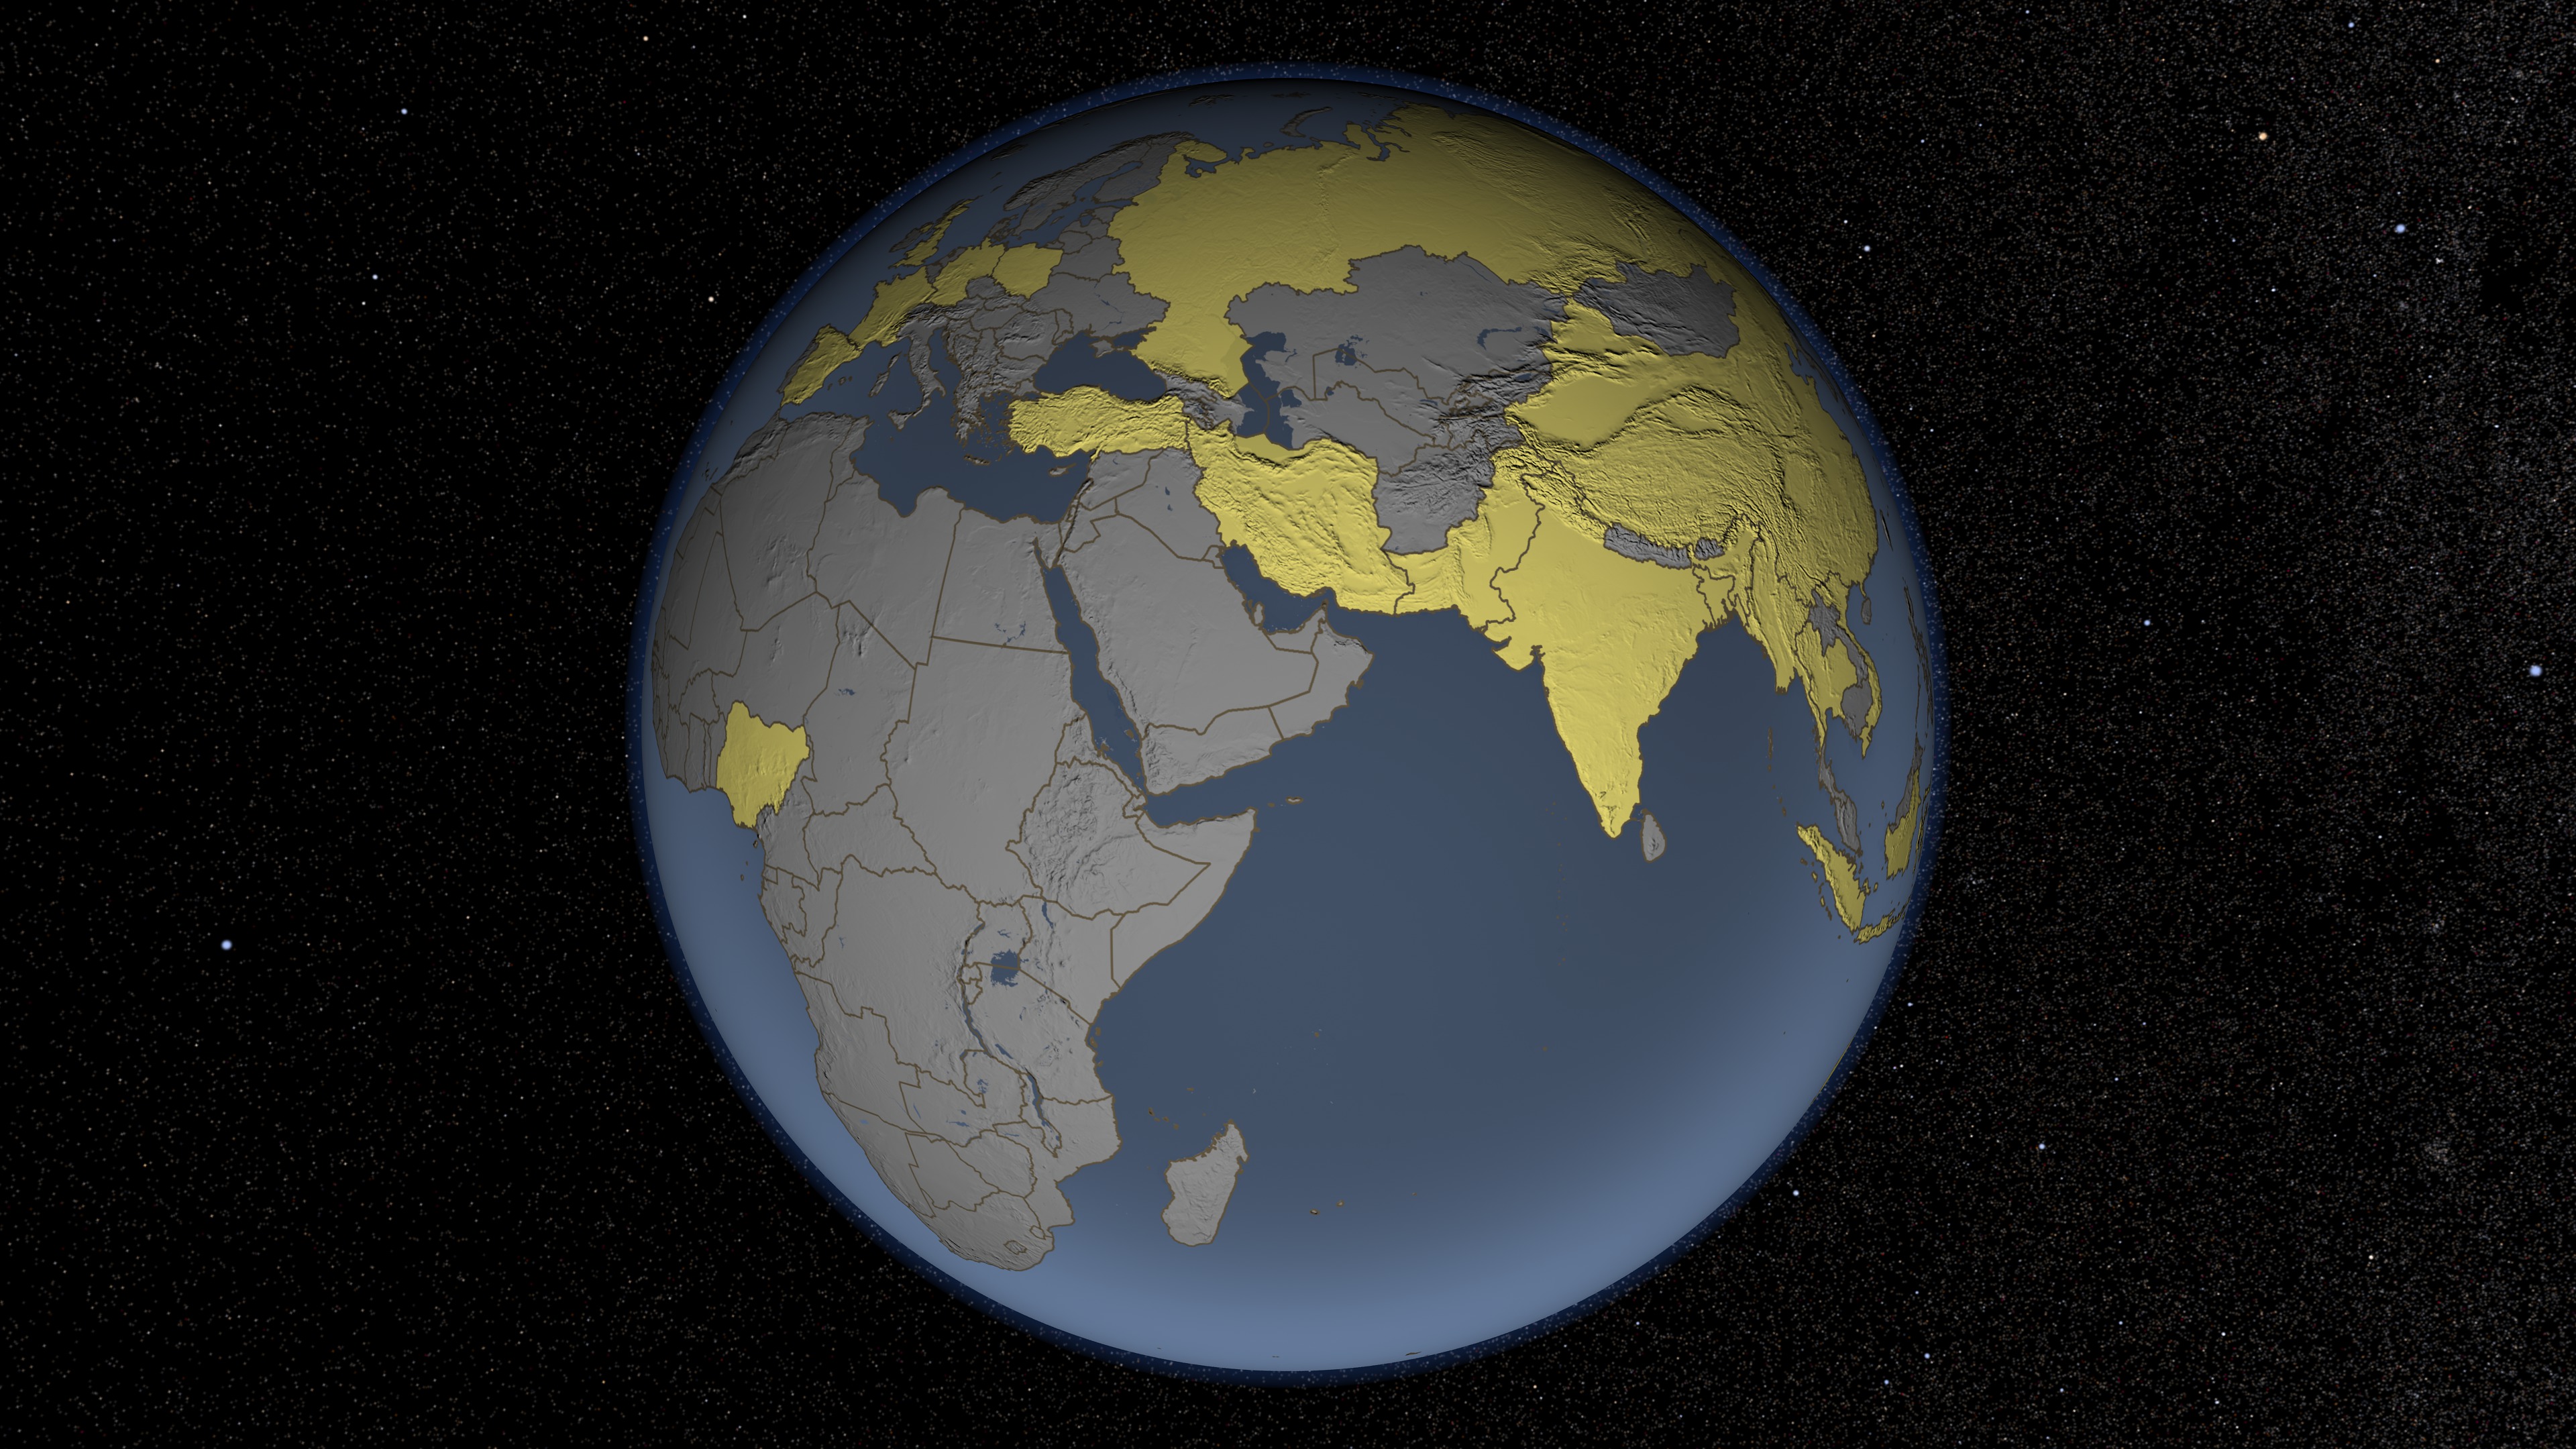
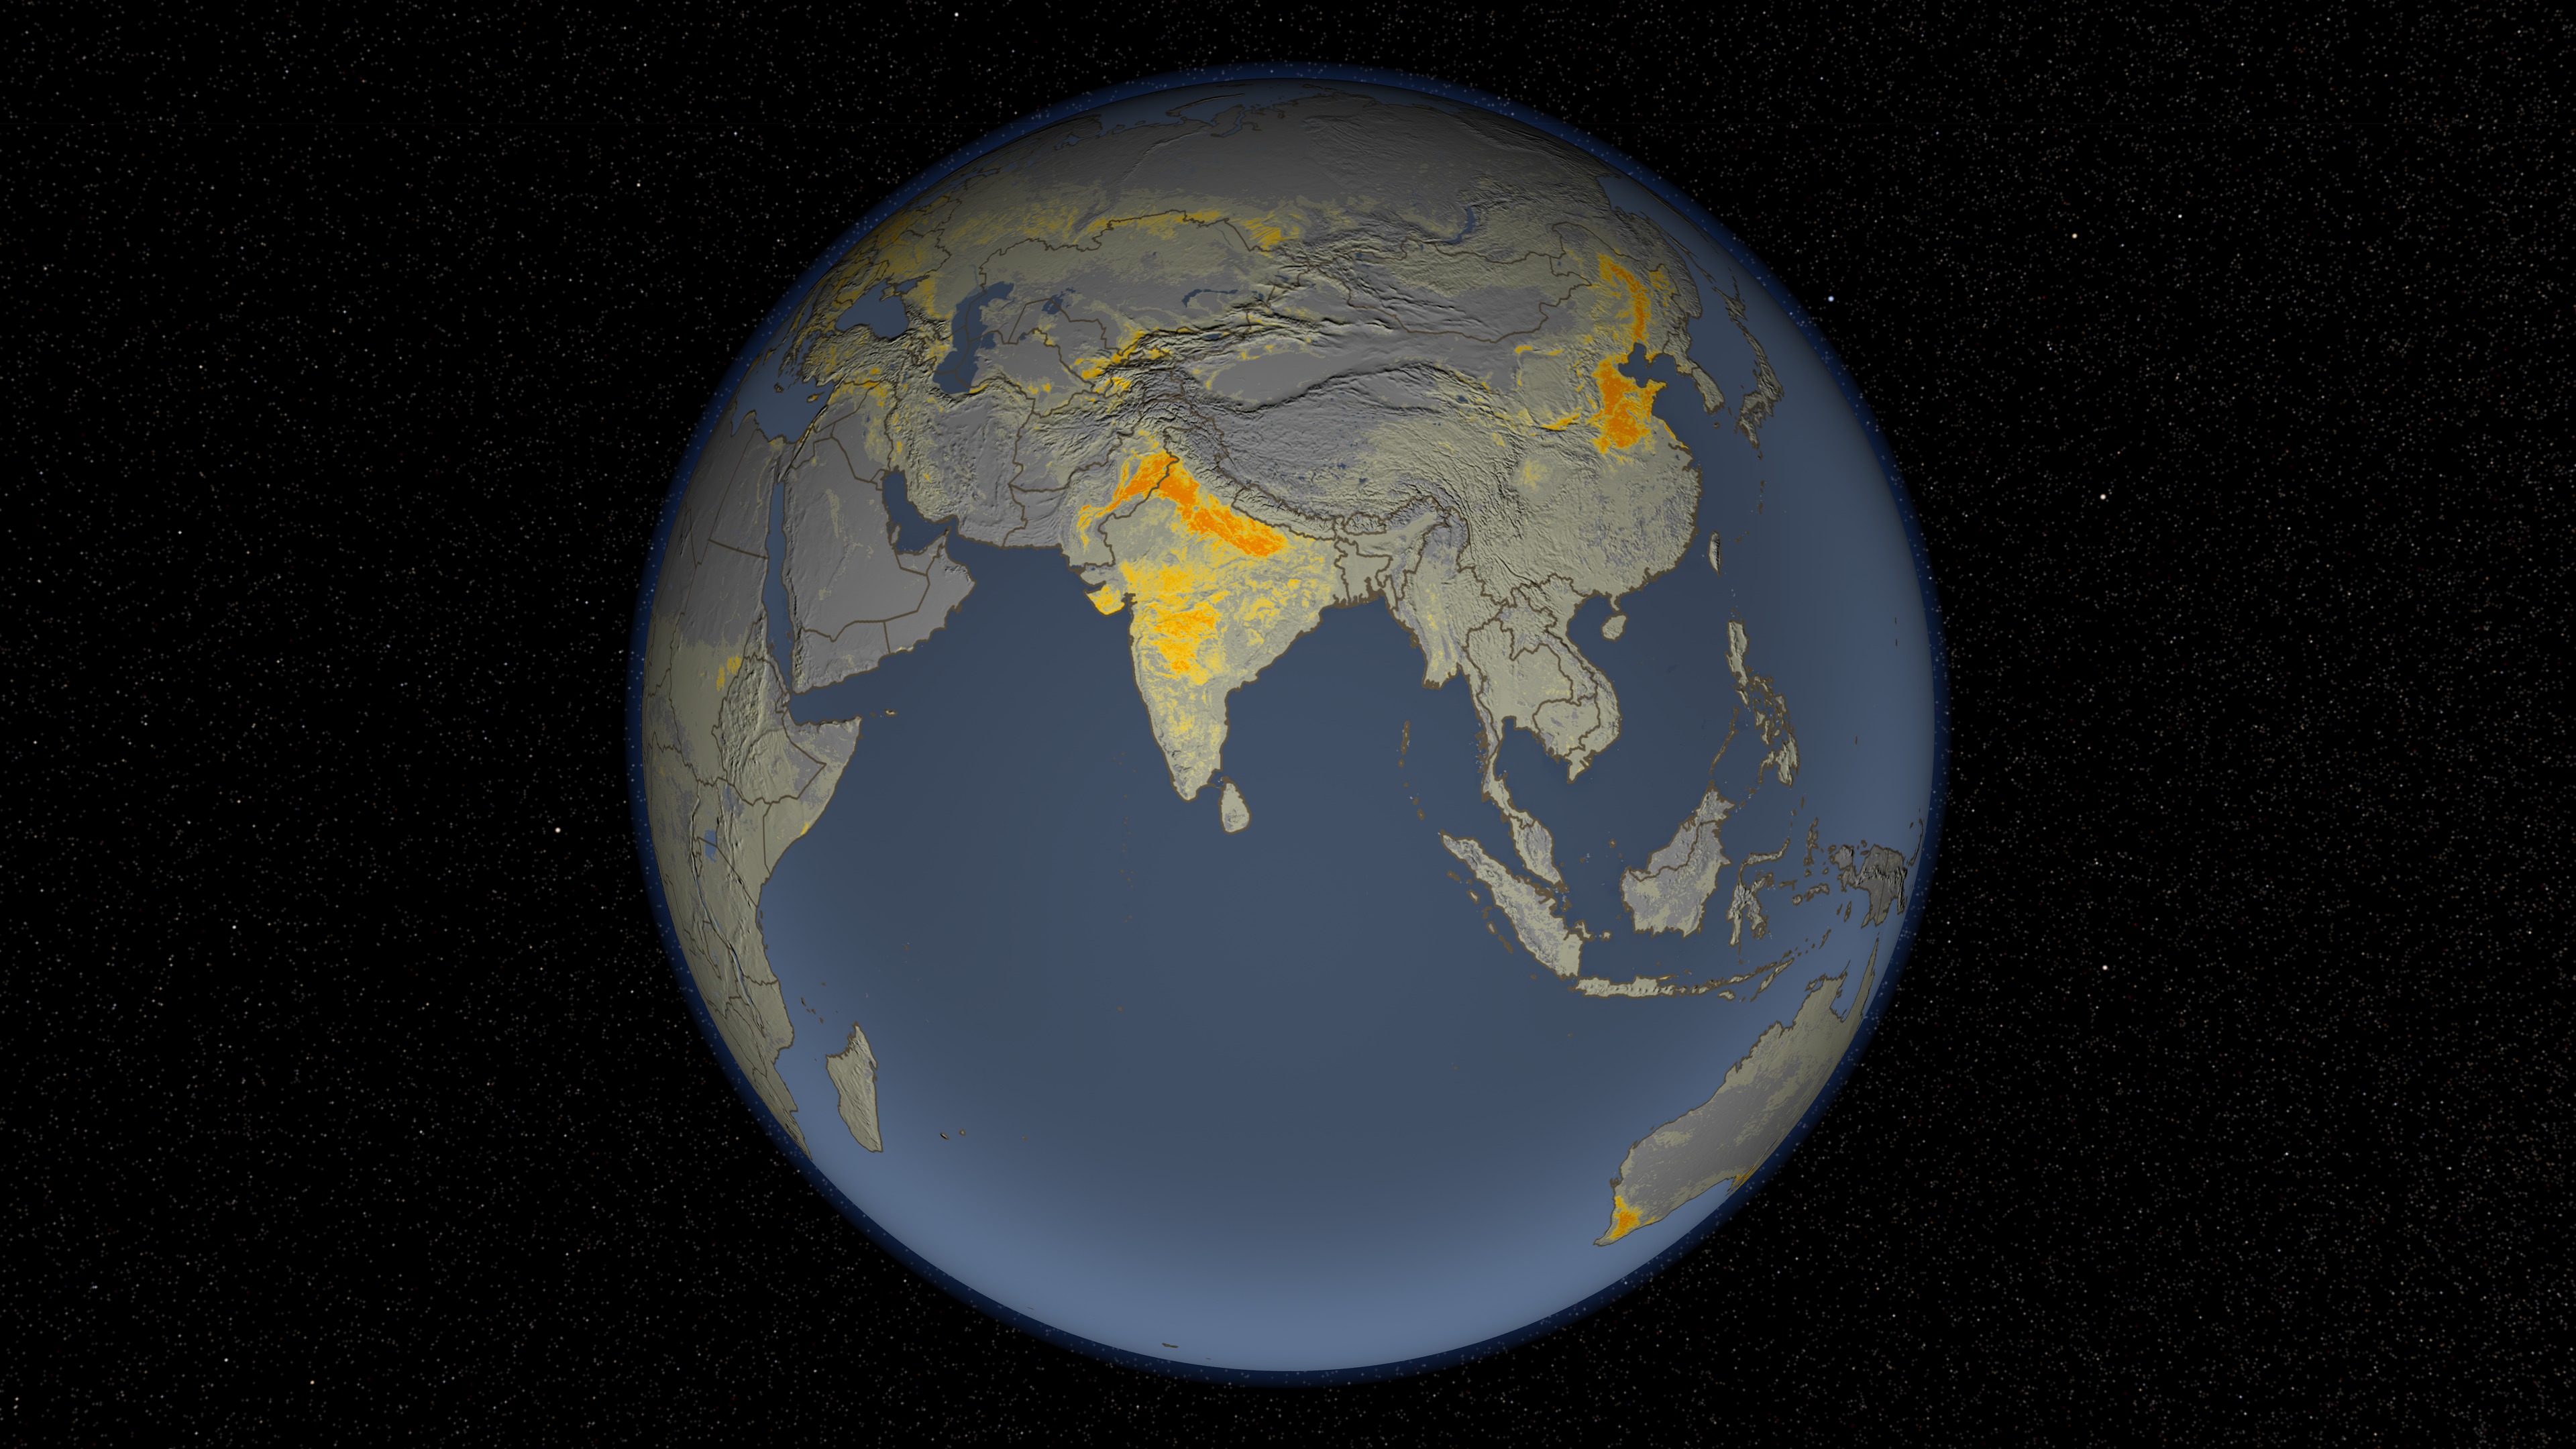
2009 Crop Intensity, 2009 Producers, and 2050 Projected Population
To successfully monitor worldwide agricultural regions and provide accurate agricultural production assessments, it is important to understand the spatial distribution of croplands. To do this a global croplands mask to identify all sites used for crop production. Croplands are highly variable both temporally and spatially. Croplands vary from year to year due to events such as drought and fallow periods, and they vastly differ across the globe in accordance with characteristics such as cropping intensity and field size. A flexible crop likelihood mask is used to help depict these varying characteristics of global crop cover. Regions featuring intensive agro-industrial farming practices such as the Maize Triangle in South Africa will have higher confidence values in the crop mask as compared to less intensively farmed regions in parts of Sub-Saharan Africa where cropland identification is partly confounded with natural background vegetation phenologies. Thus, a customized threshold can be employed to examine areas of varying cropping intensification.


Visualization Credits
Michelle Williams (UMBC): Producer
Chris Justice (University of Maryland): Scientist
Inbal Becker Reshef (University of Maryland): Scientist
NASA/Goddard Space Flight Center
https://svs.gsfc.nasa.gov/3646
Mission:
Terra
Data Used:
Gridded Population of the World (Version 3 Beta)
Data Compilation - SEDACTerra and Aqua/MODIS/Composite Vegetation Index also referred to as: VI
Data Compilation - NASATerra and Aqua/MODIS/Normalized Difference Vegetation Index (NDVI) also referred to as: NDVI
NASAThis item is part of these series:
NASA and Agriculture - Animations
Agriculture Animations - Global Agricultural Monitoring
Keywords:
DLESE >> Atmospheric science
SVS >> Biscuit
DLESE >> Forestry
SVS >> HDTV
DLESE >> Natural hazards
GCMD >> Earth Science >> Agriculture
GCMD >> Earth Science >> Human Dimensions >> Population
GCMD >> Earth Science >> Biosphere >> Ecological Dynamics >> Fire Occurrence
GCMD >> Earth Science >> Human Dimensions >> Environmental Impacts >> Urbanization
SVS >> Hyperwall
SVS >> For Educators
SVS >> Consumer vs. Producer
SVS >> Depletion of Food
SVS >> Farming
SVS >> Economic Geography
NASA Science >> Earth
GCMD >> Earth Science >> Human Dimensions >> Natural Hazards >> Famine
GCMD keywords can be found on the Internet with the following citation: Olsen, L.M., G. Major, K. Shein, J. Scialdone, S. Ritz, T. Stevens, M. Morahan, A. Aleman, R. Vogel, S. Leicester, H. Weir, M. Meaux, S. Grebas, C.Solomon, M. Holland, T. Northcutt, R. A. Restrepo, R. Bilodeau, 2013. NASA/Global Change Master Directory (GCMD) Earth Science Keywords. Version 8.0.0.0.0


