Earth
ID: 3479
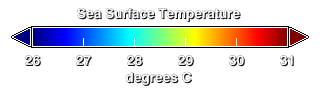
This visualization shows Hurricane Gustav and Tropical Storm Hanna as they appeared on August 31, 2008. The colors on the ocean represent the sea surface temperatures, and satellite images of the storm clouds are laid over the temperatures to clearly show the positions of the storms. Hurricane winds are sustained by the heat energy of the ocean, so the ocean is cooled as the hurricane passes and the energy is extracted to power the winds. This cooling is shown by the blue trail in the Gulf of Mexico on the east side of Gustav. The sea surface temperature data was taken by the AMSR-E instrument on the Aqua satellite, while the cloud images were taken by the Imager on the GOES-12 satellite.
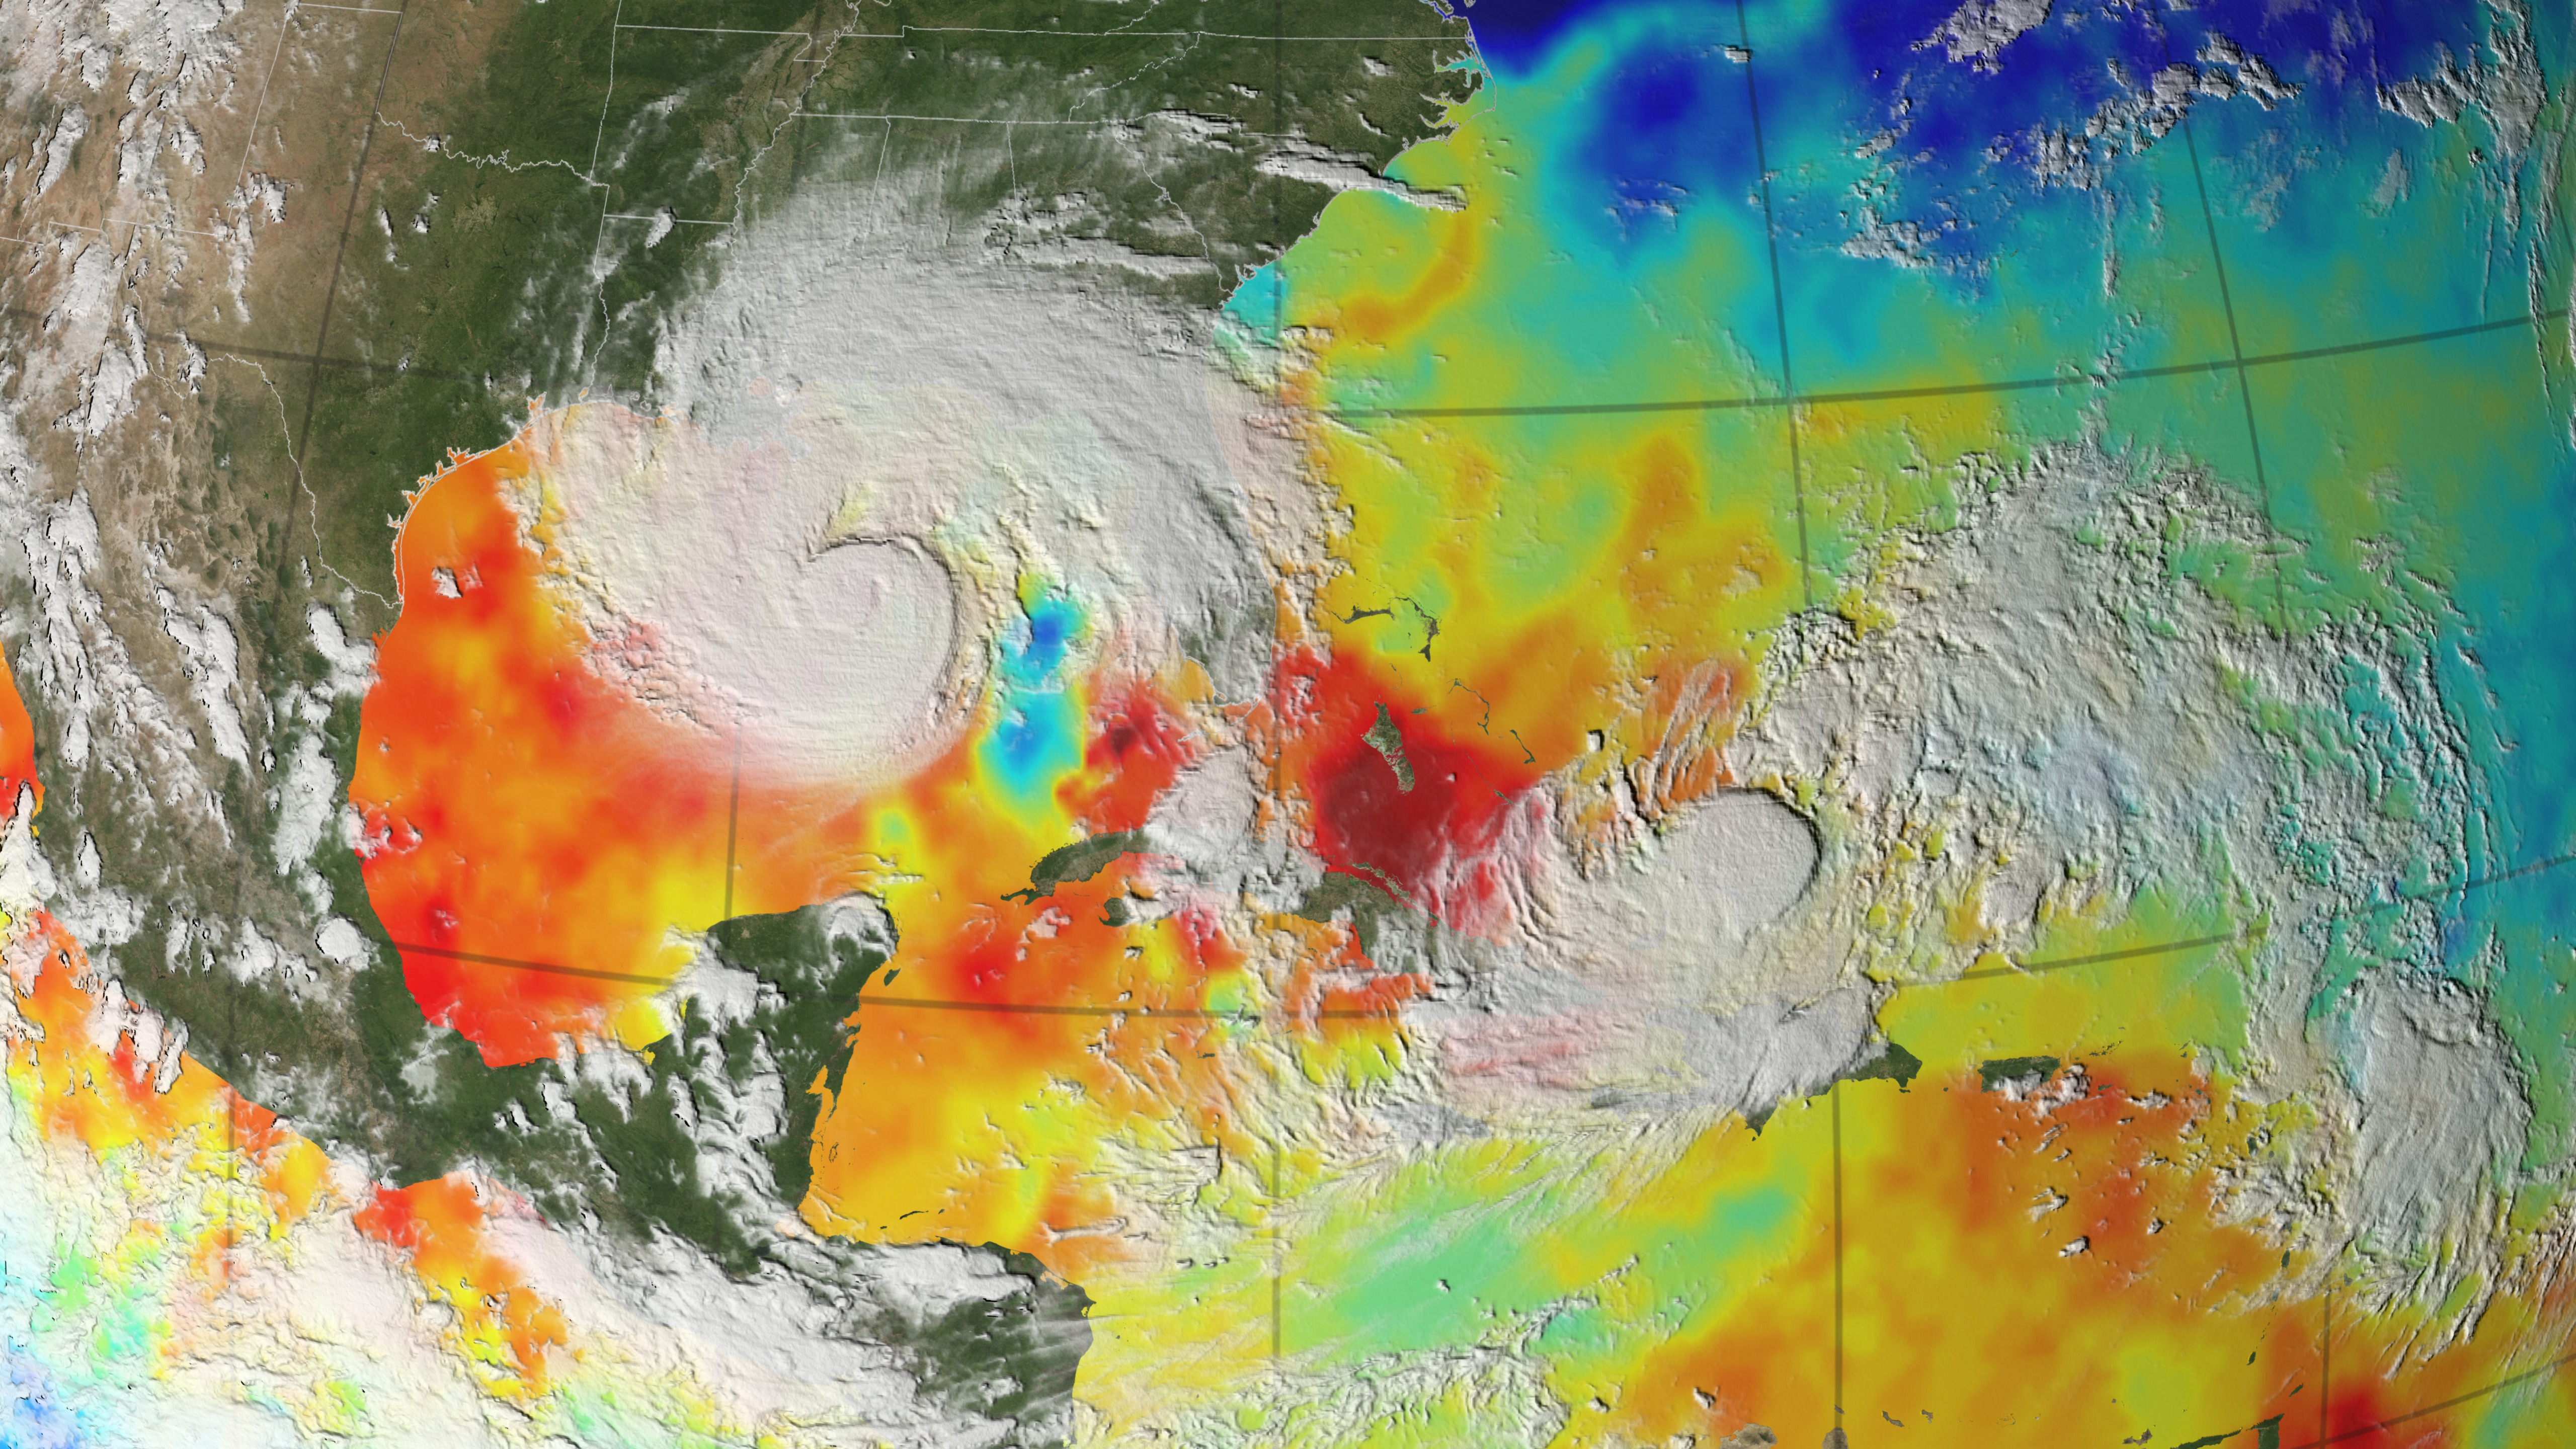
Hurricane Gustav Sea Surface Temperature, 8/31/08
Visualization Credits
Trent L. Schindler (UMBC): Lead Animator
Please give credit for this item to:
NASA/Goddard Space Flight Center Scientific Visualization Studio
NASA/Goddard Space Flight Center Scientific Visualization Studio
Short URL to share this page:
https://svs.gsfc.nasa.gov/3479
Data Used:
Note: While we identify the data sets used in these visualizations, we do not store any further details nor the data sets themselves on our site.
Keywords:
SVS >> GOES
NASA Science >> Earth
https://svs.gsfc.nasa.gov/3479
Data Used:
Aqua/AMSR-E
For more information, please click http://wwwghcc.msfc.nasa.gov/AMSR/
GOES-12/Imager
Keywords:
SVS >> GOES
NASA Science >> Earth


