Earth
ID: 3433
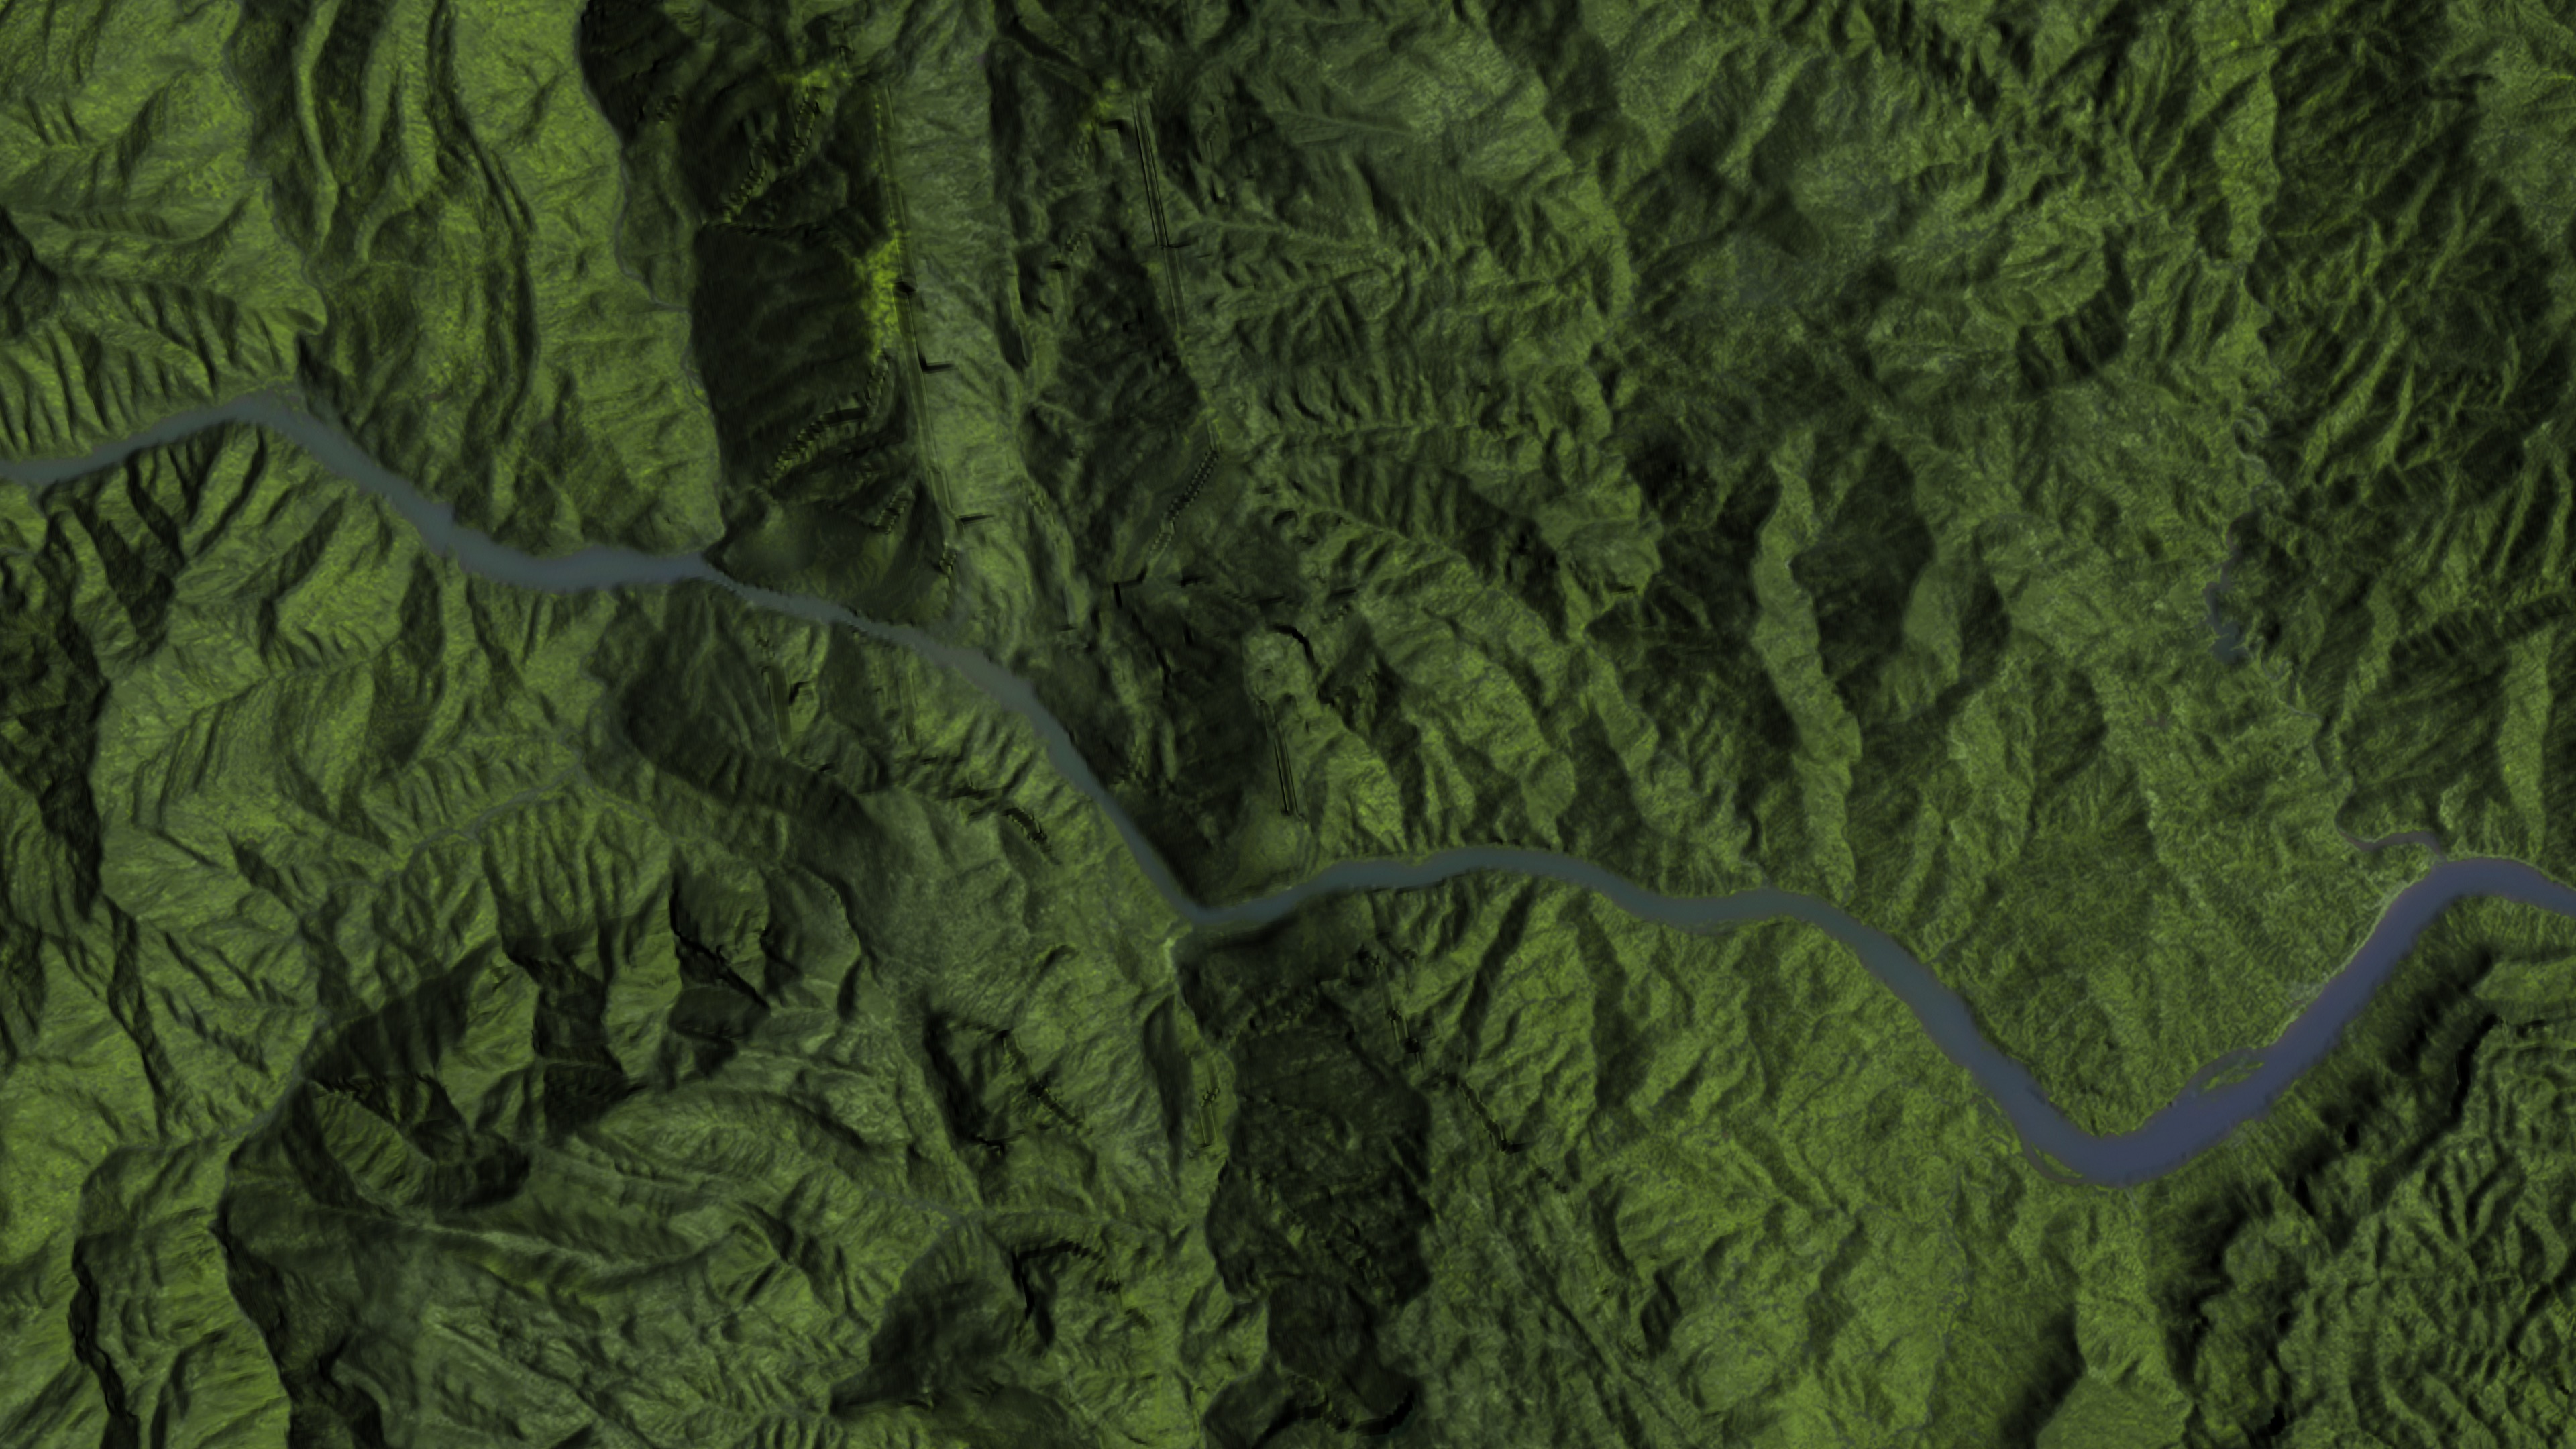
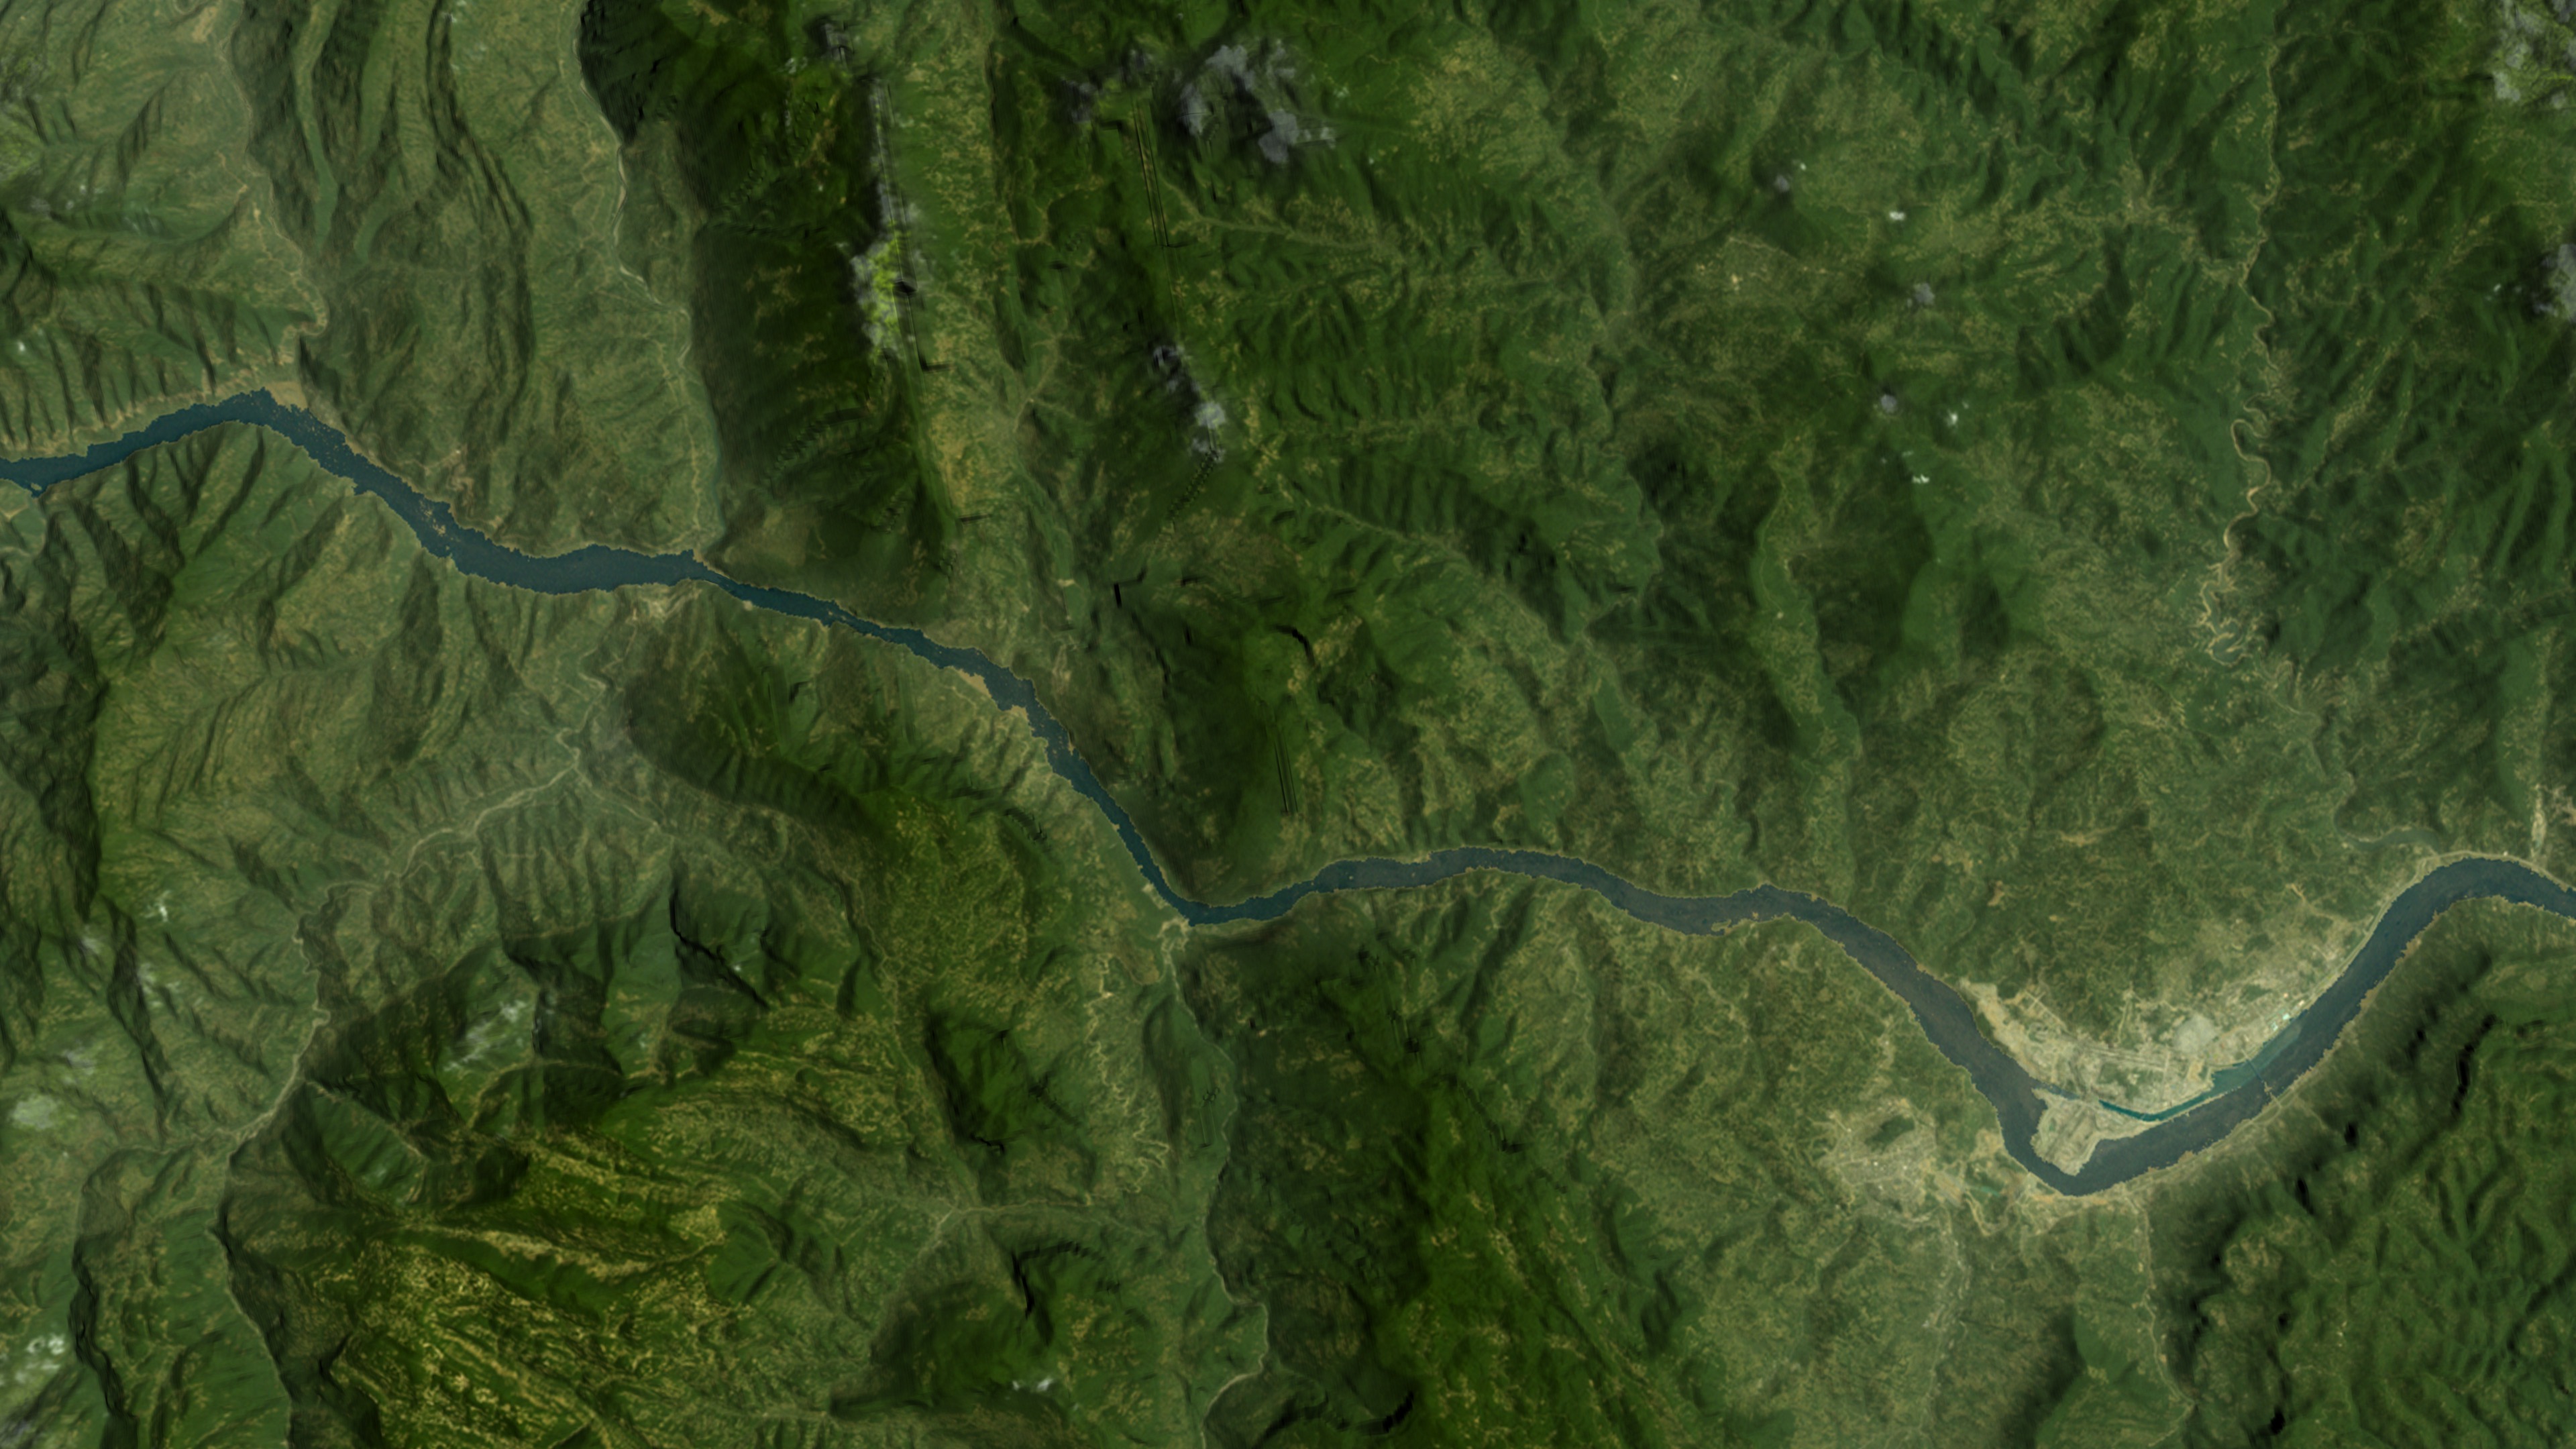
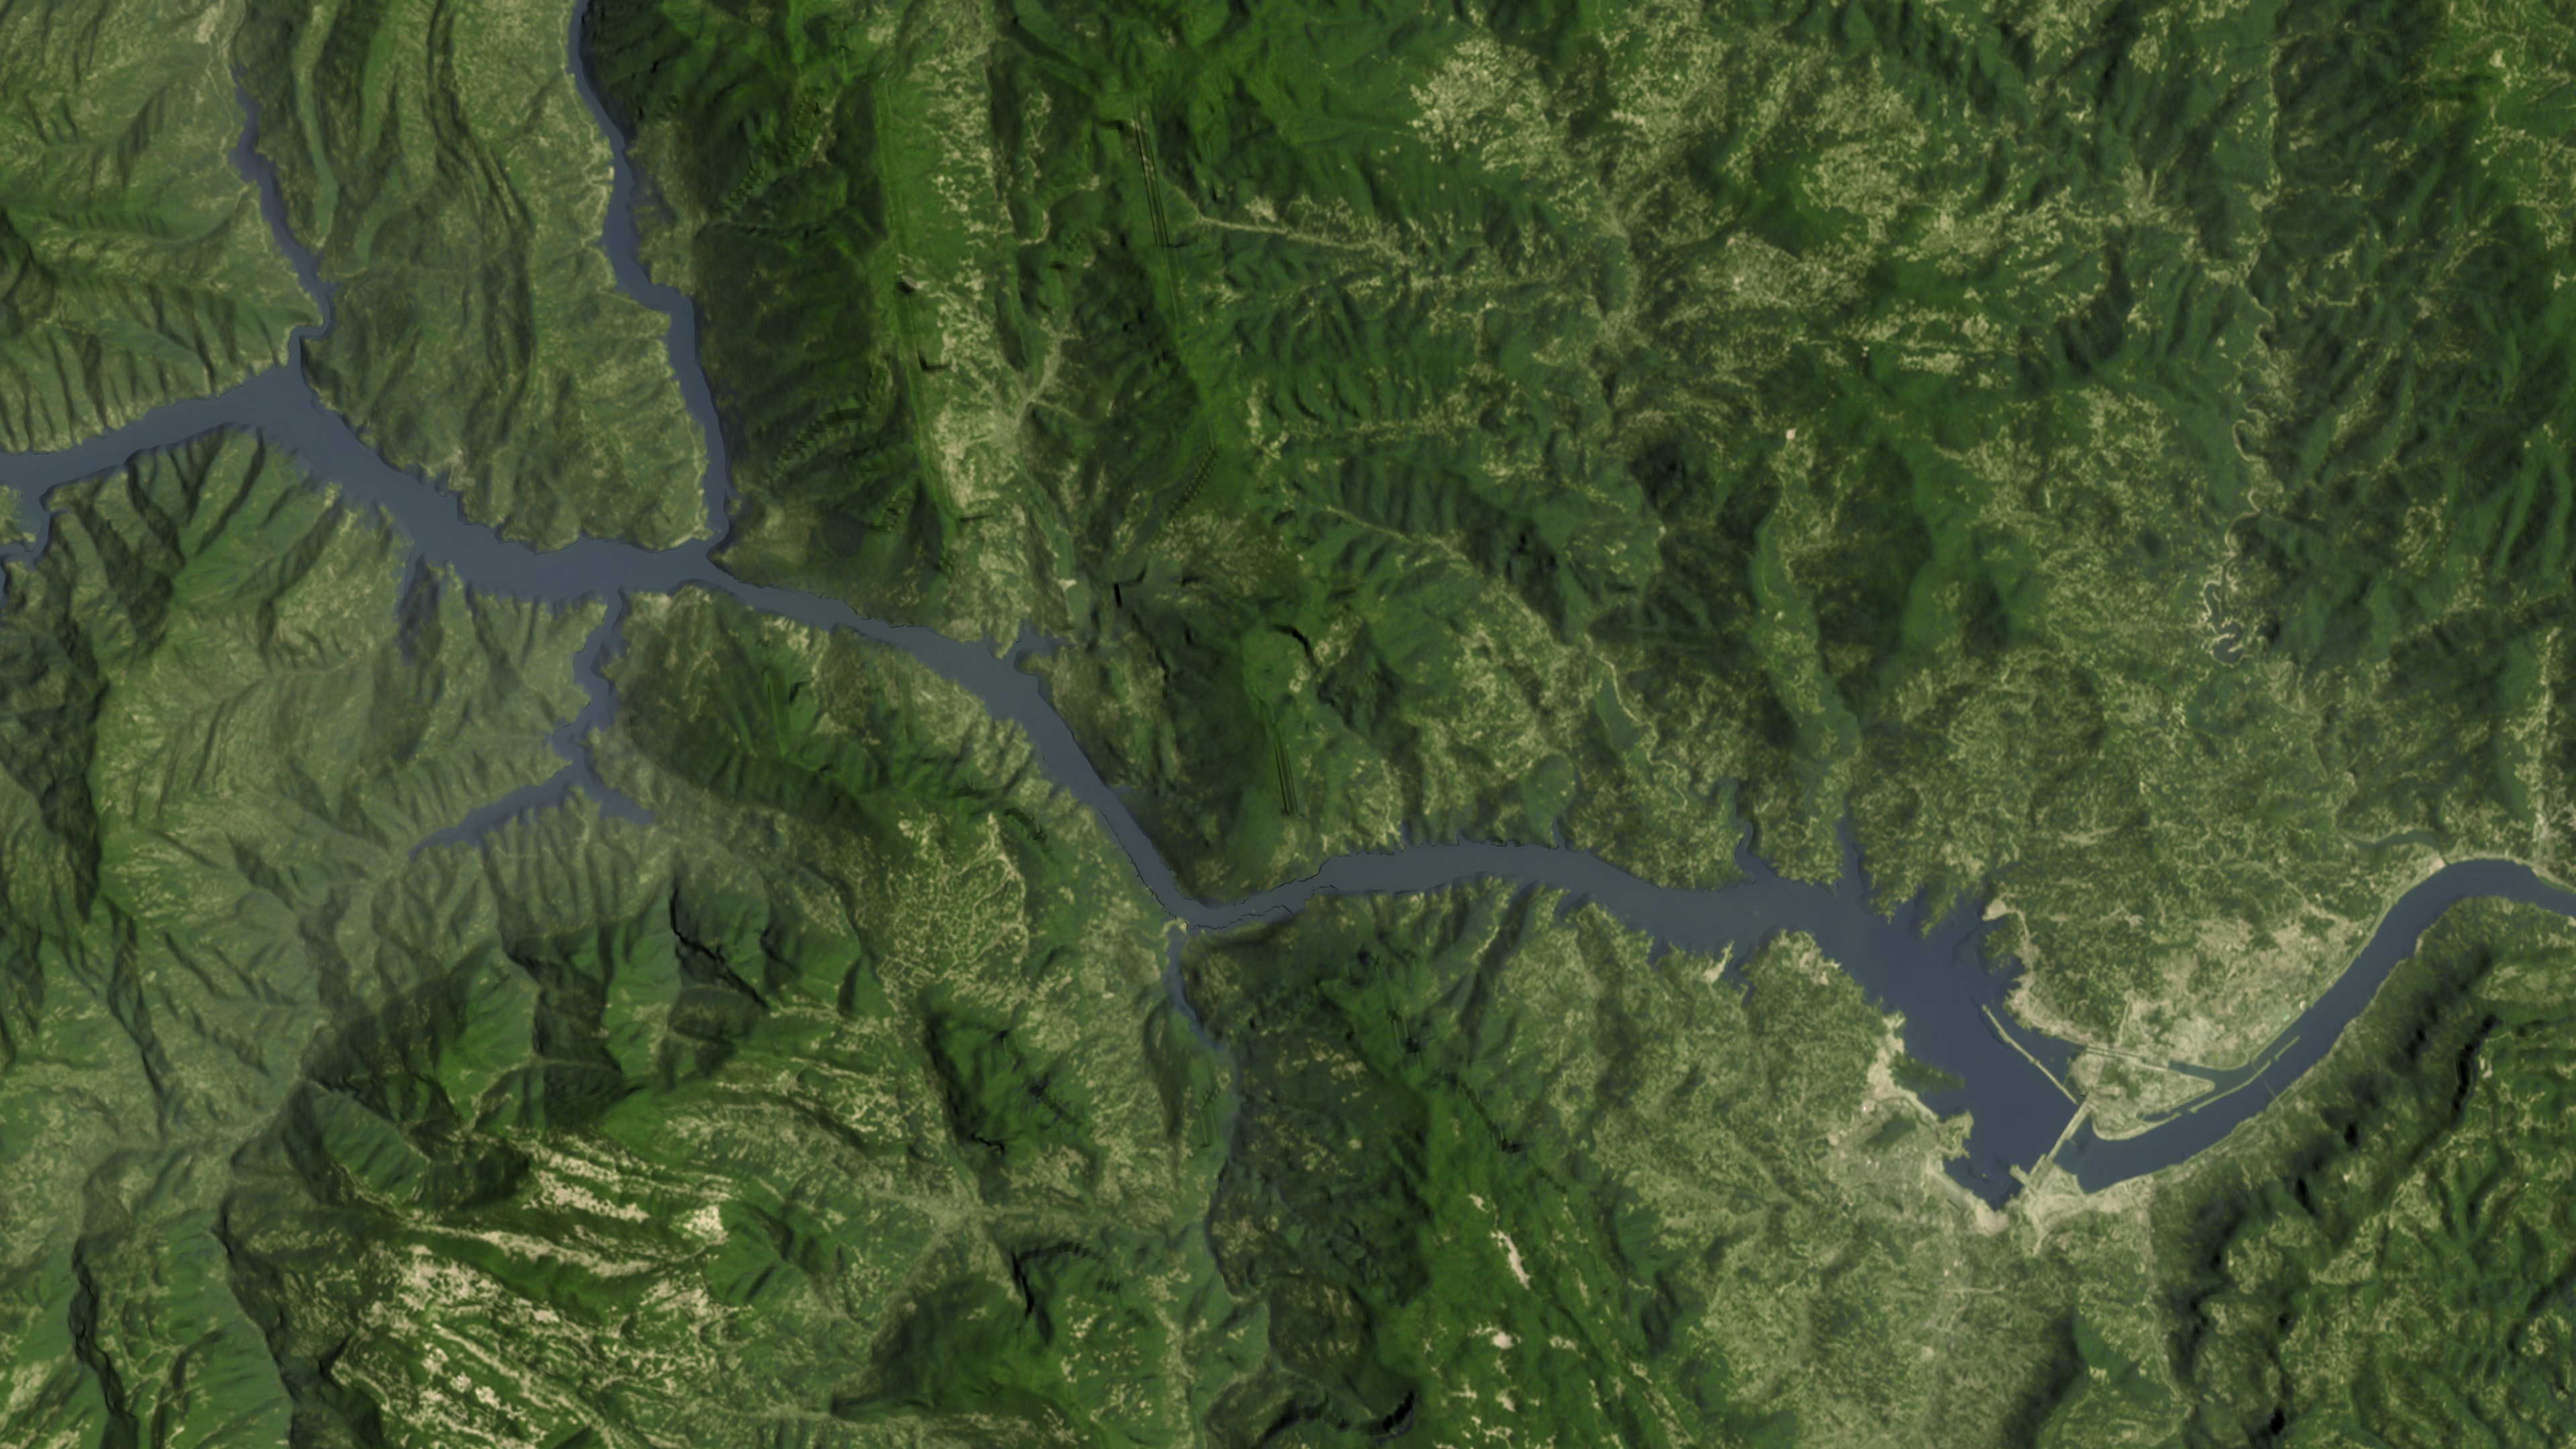
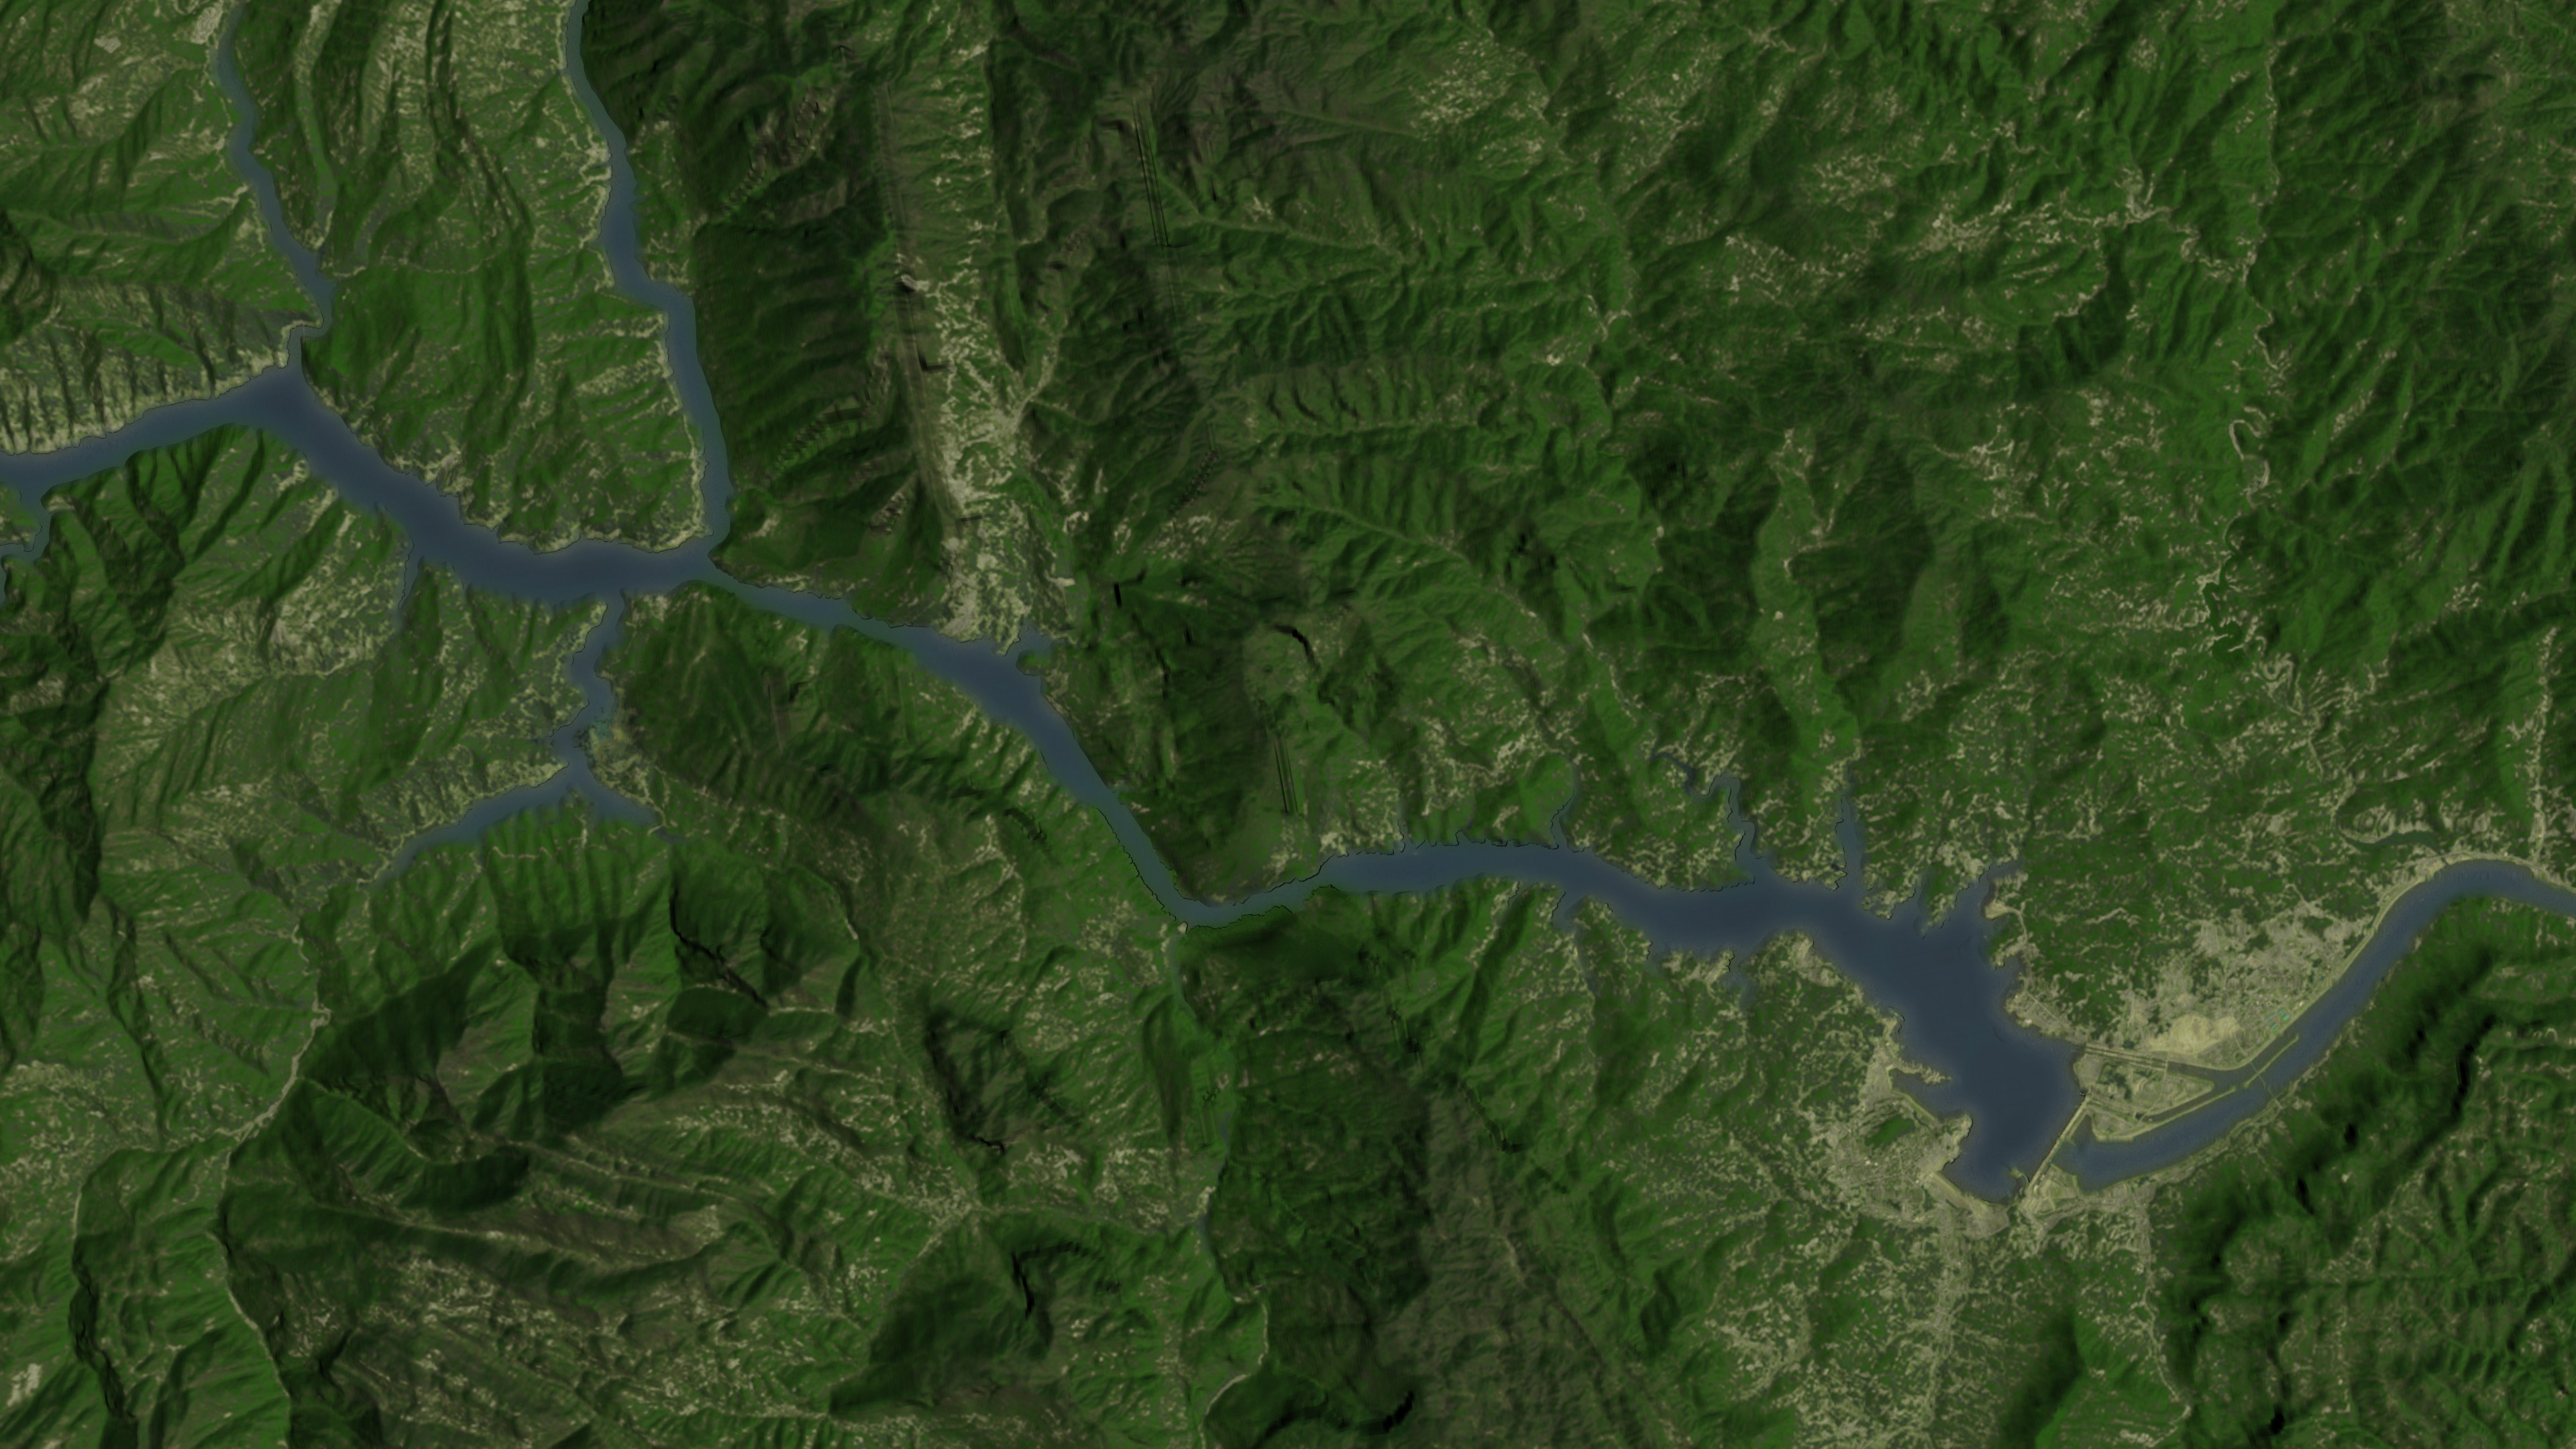
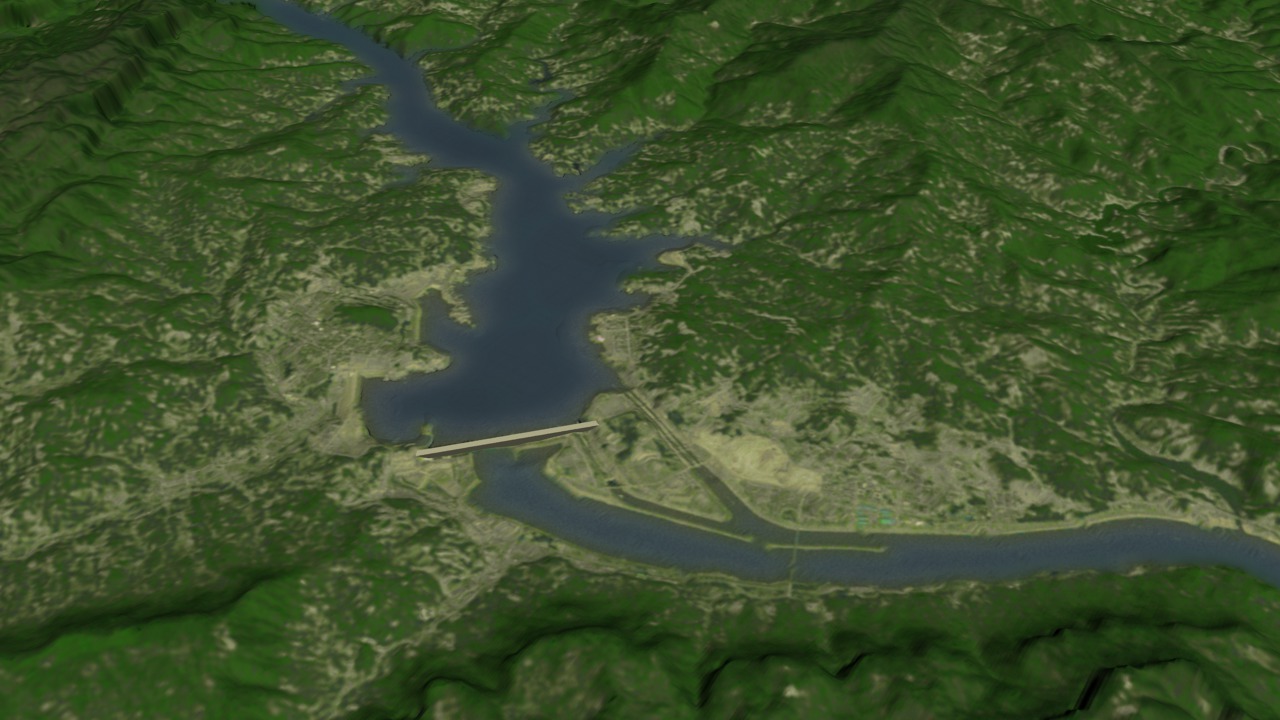
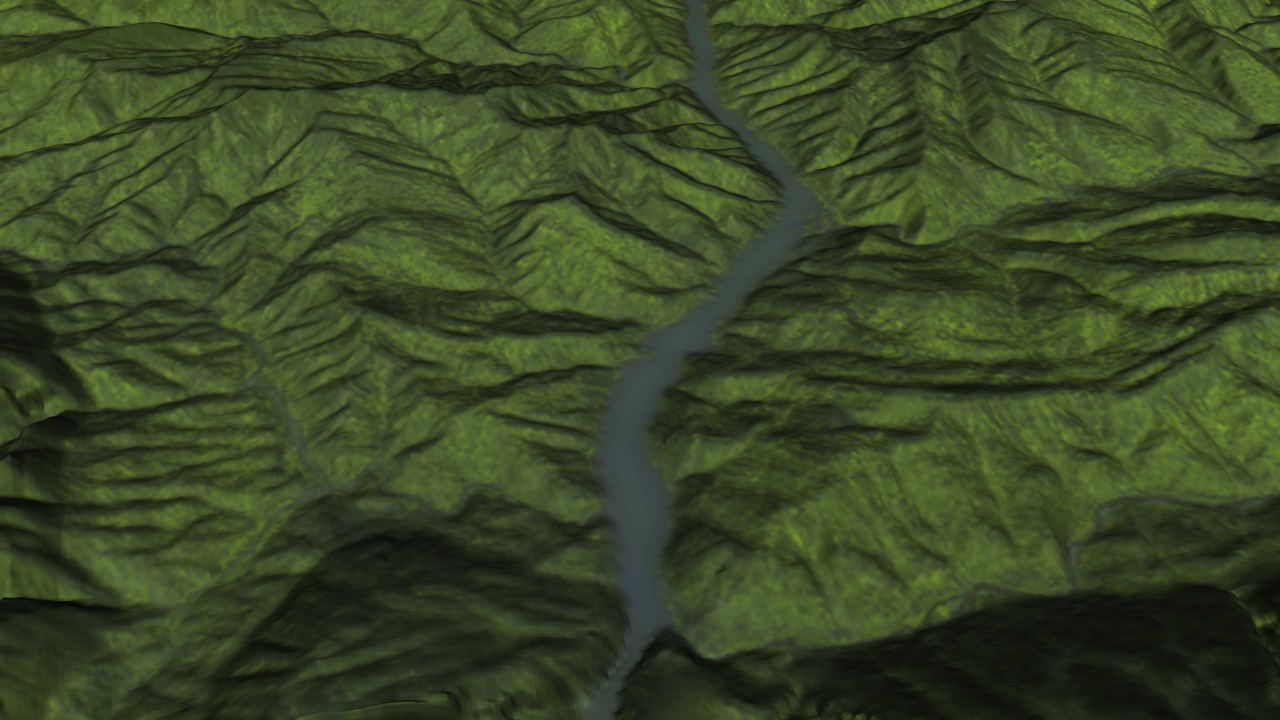
Some call it the eighth wonder of world; others say it's the next Great Wall of China. Upon completion in 2009, the Three Gorges Dam will be the world's largest hydroelectric power generator. One of the few man-made structures so enormous that it's actually visible to the naked eye from space, NASA's Landsat satellite has had a closer look, providing detailed, vivid views of the dam since its inception in 1994. The dam is built along the Yangtze River, the third largest in the world, stretching more than 3,900 miles across China before reaching its mouth near Shanghai. Historically, the river has been prone to massive flooding, overflowing its banks about once every ten years. During the 20th century alone, Chinese authorities estimate that some 300,000 people were killed from Yangtze River floods. The dam is designed to greatly improve flood control on the river and protect the 15 million people and 3.7 million acres of farmland in the lower Yangtze flood plains. Observations from the NASA-built Landsat satellites provide an overview of the dam's construction. The earliest data set, from 1987, shows the region prior to start of construction. By 2000, construction along each riverbank was underway, but sediment-filled water still flowed through a narrow channel near the river's south bank. The 2004 data shows development of the main wall and the partial filling of the reservoir, including numerous side canyons. By mid-2006, construction of the main wall was completed and a reservoir more than 2 miles (3 kilometers) across had filled just upstream of the dam. To read more about the Three Gorges Dam, please click here. This animation was designed in three parts: Part 1: The first part of this animation zooms in to the Three Gorges Dam and travels backward and forward through time emphasizing the dam construction and filling of the reservoir. This animation then continues seemlessly into Part 2. Part 2: Starting where Part 1 leaves off, the camera flies up the 2006 data showing the high water levels that have already filled the multiple gorges upstream. Part 3: Identical to Part 2, except showing the 1987 data prior to the dam construction.
Rise of the Three Gorges Dam
Visualization Credits
Alex Kekesi (Global Science and Technology, Inc.): Lead Animator
Lori Perkins (NASA/GSFC): Animator
Greg Shirah (NASA/GSFC): Animator
Cindy Starr (Global Science and Technology, Inc.): Visualizer
Darrel Williams (NASA/GSFC): Scientist
Mike Bettwy (RSIS): Writer
Lori Perkins (NASA/GSFC): Animator
Greg Shirah (NASA/GSFC): Animator
Cindy Starr (Global Science and Technology, Inc.): Visualizer
Darrel Williams (NASA/GSFC): Scientist
Mike Bettwy (RSIS): Writer
Please give credit for this item to:
NASA/Goddard Space Flight Center Scientific Visualization Studio United States Geological Survey
NASA/Goddard Space Flight Center Scientific Visualization Studio United States Geological Survey
Short URL to share this page:
https://svs.gsfc.nasa.gov/3433
Missions:
Ice, Cloud, and land Elevation Satellite (ICESat)
Landsat
Data Used:
Note: While we identify the data sets used in these visualizations, we do not store any further details nor the data sets themselves on our site.
This item is part of these series:
Geophysical Changes Over Time
Landsat
Goddard TV Tape:
G2008-041HD -- NASAs Landsat in HD 2008 Resource Tape
Keywords:
SVS >> HDTV
DLESE >> Hydrology
SVS >> Landsat
GCMD >> Earth Science >> Hydrosphere >> Surface Water >> Floods
GCMD >> Location >> China
SVS >> Hyperwall
NASA Science >> Earth
GCMD keywords can be found on the Internet with the following citation: Olsen, L.M., G. Major, K. Shein, J. Scialdone, S. Ritz, T. Stevens, M. Morahan, A. Aleman, R. Vogel, S. Leicester, H. Weir, M. Meaux, S. Grebas, C.Solomon, M. Holland, T. Northcutt, R. A. Restrepo, R. Bilodeau, 2013. NASA/Global Change Master Directory (GCMD) Earth Science Keywords. Version 8.0.0.0.0
https://svs.gsfc.nasa.gov/3433
Missions:
Ice, Cloud, and land Elevation Satellite (ICESat)
Landsat
Data Used:
Landsat-5/TM
4/17/1987Landsat-7/ETM+/Infrared
6/15/2000, 5/9/2004, 11/7/2006Landsat-7/ETM+/Band Combination 3, 2, 1
6/15/2000, 5/9/2004, 11/7/2006This item is part of these series:
Geophysical Changes Over Time
Landsat
Goddard TV Tape:
G2008-041HD -- NASAs Landsat in HD 2008 Resource Tape
Keywords:
SVS >> HDTV
DLESE >> Hydrology
SVS >> Landsat
GCMD >> Earth Science >> Hydrosphere >> Surface Water >> Floods
GCMD >> Location >> China
SVS >> Hyperwall
NASA Science >> Earth
GCMD keywords can be found on the Internet with the following citation: Olsen, L.M., G. Major, K. Shein, J. Scialdone, S. Ritz, T. Stevens, M. Morahan, A. Aleman, R. Vogel, S. Leicester, H. Weir, M. Meaux, S. Grebas, C.Solomon, M. Holland, T. Northcutt, R. A. Restrepo, R. Bilodeau, 2013. NASA/Global Change Master Directory (GCMD) Earth Science Keywords. Version 8.0.0.0.0


