Earth
ID: 3225
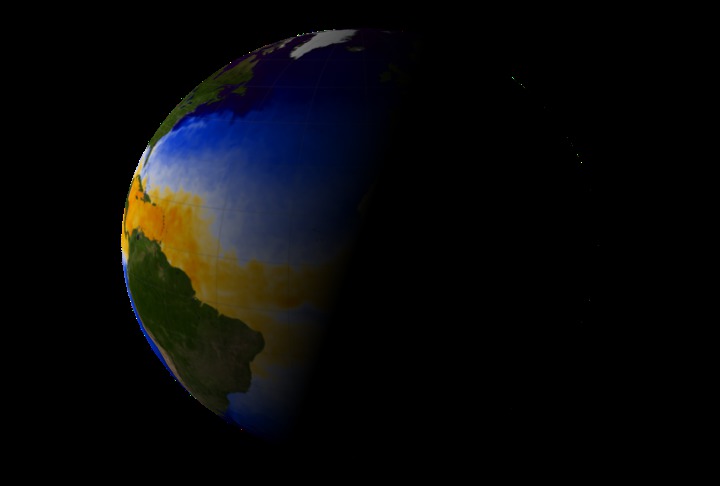
This visualization shows the sea surface temperatures for the 2005 Atlantic hurricane season from June 1, 2005 through August 29, 2005. The ocean colors represent the sea surface temperatures. Orange and red depict regions that are 82 degrees F and higher, where the ocean is warm enough for hurricanes to form. Hurricane winds are sustained by the heat energy of the ocean, so the ocean is cooled as the hurricane passes and the energy is extracted to power the winds. The sea surface temperatures were measured by the AMSR-E instrument on the Aqua satellite. Several hurricane color water trails can be seen through this animation - particulary hurricanes Dennis, Emily, and Katrina.
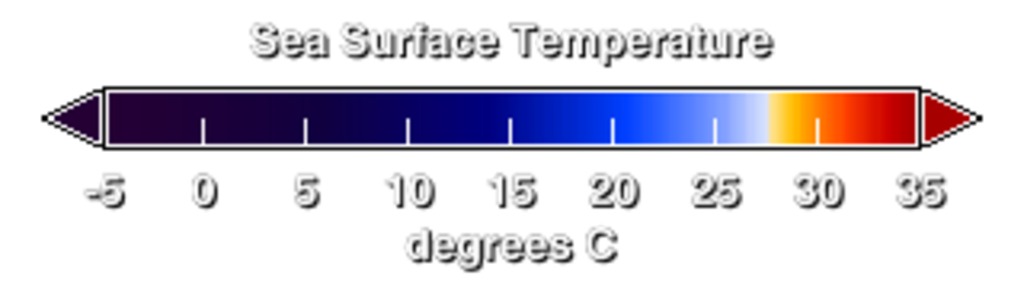
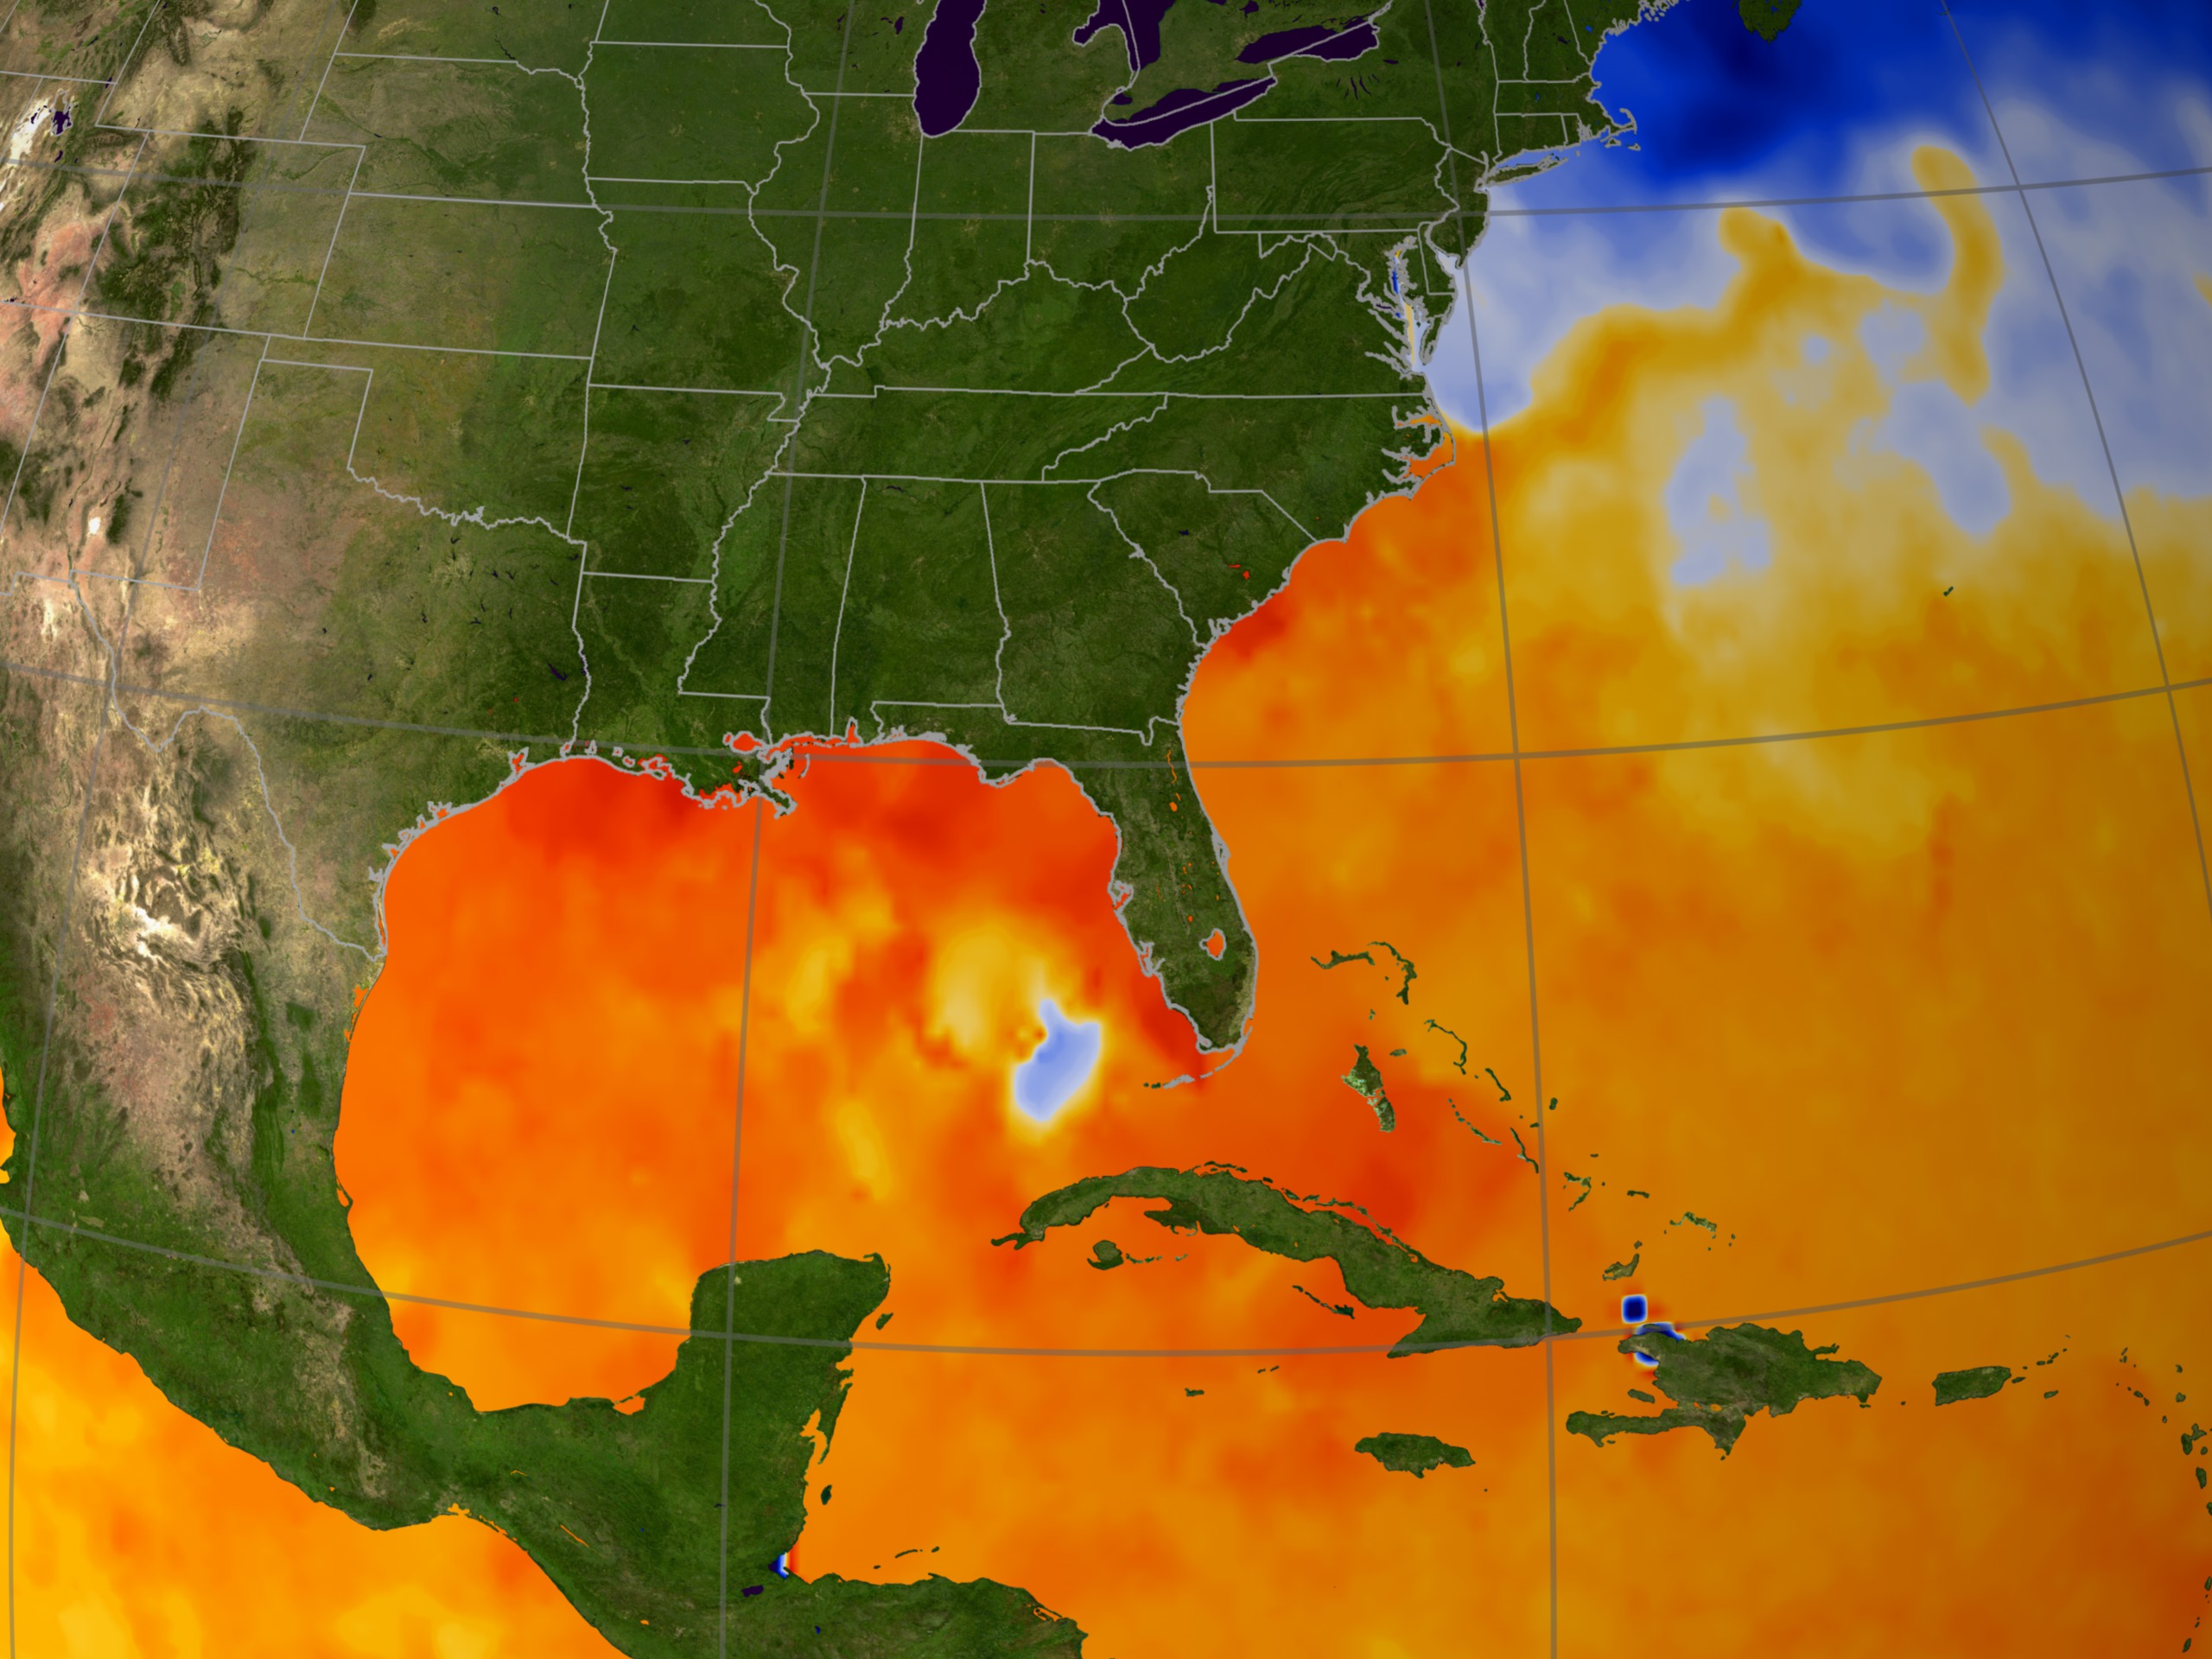
Sea Surface Temperature from June 1, 2005 to August 29, 2005
Visualization Credits
Greg Shirah (NASA/GSFC): Lead Animator
J. Marshall Shepherd (NASA/GSFC): Scientist
Jeff Halverson (JCET UMBC): Scientist
J. Marshall Shepherd (NASA/GSFC): Scientist
Jeff Halverson (JCET UMBC): Scientist
Please give credit for this item to:
NASA/Goddard Space Flight Center Scientific Visualization Studio
NASA/Goddard Space Flight Center Scientific Visualization Studio
Short URL to share this page:
https://svs.gsfc.nasa.gov/3225
Data Used:
Note: While we identify the data sets used in these visualizations, we do not store any further details nor the data sets themselves on our site.
This item is part of this series:
Hurricane Katrina
Keywords:
DLESE >> Atmospheric science
SVS >> HDTV
GCMD >> Earth Science >> Atmosphere >> Atmospheric Phenomena >> Hurricanes
GCMD >> Earth Science >> Oceans >> Ocean Temperature >> Sea Surface Temperature
NASA Science >> Earth
GCMD keywords can be found on the Internet with the following citation: Olsen, L.M., G. Major, K. Shein, J. Scialdone, S. Ritz, T. Stevens, M. Morahan, A. Aleman, R. Vogel, S. Leicester, H. Weir, M. Meaux, S. Grebas, C.Solomon, M. Holland, T. Northcutt, R. A. Restrepo, R. Bilodeau, 2013. NASA/Global Change Master Directory (GCMD) Earth Science Keywords. Version 8.0.0.0.0
https://svs.gsfc.nasa.gov/3225
Data Used:
Aqua/AMSR-E/Sea Surface Temperature
2005/06/01 - 2005/08/29Aqua/AMSR-E/Sea Surface Temperature Anomaly
2005/06/01 - 2005/08/29This item is part of this series:
Hurricane Katrina
Keywords:
DLESE >> Atmospheric science
SVS >> HDTV
GCMD >> Earth Science >> Atmosphere >> Atmospheric Phenomena >> Hurricanes
GCMD >> Earth Science >> Oceans >> Ocean Temperature >> Sea Surface Temperature
NASA Science >> Earth
GCMD keywords can be found on the Internet with the following citation: Olsen, L.M., G. Major, K. Shein, J. Scialdone, S. Ritz, T. Stevens, M. Morahan, A. Aleman, R. Vogel, S. Leicester, H. Weir, M. Meaux, S. Grebas, C.Solomon, M. Holland, T. Northcutt, R. A. Restrepo, R. Bilodeau, 2013. NASA/Global Change Master Directory (GCMD) Earth Science Keywords. Version 8.0.0.0.0


