Earth
ID: 2903
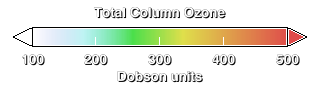
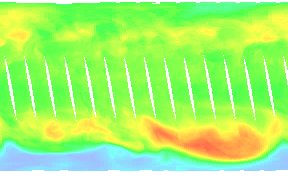
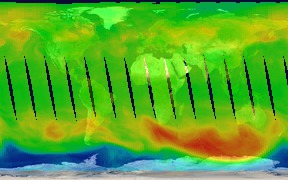
This visualization shows the total ozone concentrations for the Earth from January 1, 2000 through December 31, 2003, as measured by theTOMS instrument on the Earth Probe satellite. Low ozone (less than 200 Dobson units) is depicted as regions of dark blue, with high ozone (greater that 330 Dobson units) depicted as yellow and red. The most visible and dynamic feature of the ozone distribution is the ozone hole that forms over Antarctica during September of each year. The amount of ozone in the stratosphere over Antarctica is reduced during this period due to unique atmospheric conditions which chemically reduce the amount of ozone in the region and prevent that ozone from mixing with the higher ozone concentrations just outside the hole. Ozone blocks harmful ultraviolet 'B' rays, and loss of statospheric ozone has been linked to skin cancer in humans and other adverse biological effects in plants and animals. This visualization explicitly shows the TOM ozone data coverage and does not interpolate data into regions of the Earth that the instrument did not observe. Since TOMS measures ozone by observing the characteristics of sunlight reflected from the Earth's surface, no measurements are available for the poles during the polar winter, i.e., around January for the North Pole and July for the South Pole. Also, there is an unobserved region between successive satellite orbits around the equator. Finally, the instrument has periods where technical issues make measurement impossible for a matter of hours or days. This visualization shows that the dynamics of the ozone layer remain visible despite these measurement issues.
Ozone Measurements from 2000 through 2003 (WMS)
For More Information
Visualization Credits
Eric Sokolowsky (GST): Lead Animator
Greg Shirah (NASA/GSFC): Animator
Horace Mitchell (NASA/GSFC): Animator
Paul Newman (NASA/GSFC): Scientist
Greg Shirah (NASA/GSFC): Animator
Horace Mitchell (NASA/GSFC): Animator
Paul Newman (NASA/GSFC): Scientist
Please give credit for this item to:
NASA/Goddard Space Flight Center Scientific Visualization Studio
NASA/Goddard Space Flight Center Scientific Visualization Studio
Short URL to share this page:
https://svs.gsfc.nasa.gov/2903
Data Used:
Note: While we identify the data sets used in these visualizations, we do not store any further details nor the data sets themselves on our site.
This item is part of this series:
WMS
Keywords:
DLESE >> Atmospheric science
SVS >> Seasons
GCMD >> Earth Science >> Atmosphere >> Atmospheric Chemistry/Oxygen Compounds >> Ozone
SVS >> For Educators
SVS >> Stratospheric Ozone >> Concentration
SVS >> Stratospheric Ozone >> Distribution
SVS >> Seasons >> Vegetation
NASA Science >> Earth
GCMD keywords can be found on the Internet with the following citation: Olsen, L.M., G. Major, K. Shein, J. Scialdone, S. Ritz, T. Stevens, M. Morahan, A. Aleman, R. Vogel, S. Leicester, H. Weir, M. Meaux, S. Grebas, C.Solomon, M. Holland, T. Northcutt, R. A. Restrepo, R. Bilodeau, 2013. NASA/Global Change Master Directory (GCMD) Earth Science Keywords. Version 8.0.0.0.0
https://svs.gsfc.nasa.gov/2903
Data Used:
Earth Probe/TOMS/Ozone
2000/01/01 - 2003/12/31This item is part of this series:
WMS
Keywords:
DLESE >> Atmospheric science
SVS >> Seasons
GCMD >> Earth Science >> Atmosphere >> Atmospheric Chemistry/Oxygen Compounds >> Ozone
SVS >> For Educators
SVS >> Stratospheric Ozone >> Concentration
SVS >> Stratospheric Ozone >> Distribution
SVS >> Seasons >> Vegetation
NASA Science >> Earth
GCMD keywords can be found on the Internet with the following citation: Olsen, L.M., G. Major, K. Shein, J. Scialdone, S. Ritz, T. Stevens, M. Morahan, A. Aleman, R. Vogel, S. Leicester, H. Weir, M. Meaux, S. Grebas, C.Solomon, M. Holland, T. Northcutt, R. A. Restrepo, R. Bilodeau, 2013. NASA/Global Change Master Directory (GCMD) Earth Science Keywords. Version 8.0.0.0.0


