Earth
ID: 2274
TRMM views hurricane Iris as it strikes Honduras, October 9, 2001. Time is about 09:00 UT, Orbit T03. Isosurfaces are: Yellow=0.5 inches/hour, Green=1.0 inches/hour, Red=2.0 inches/hour on rainfall rates.
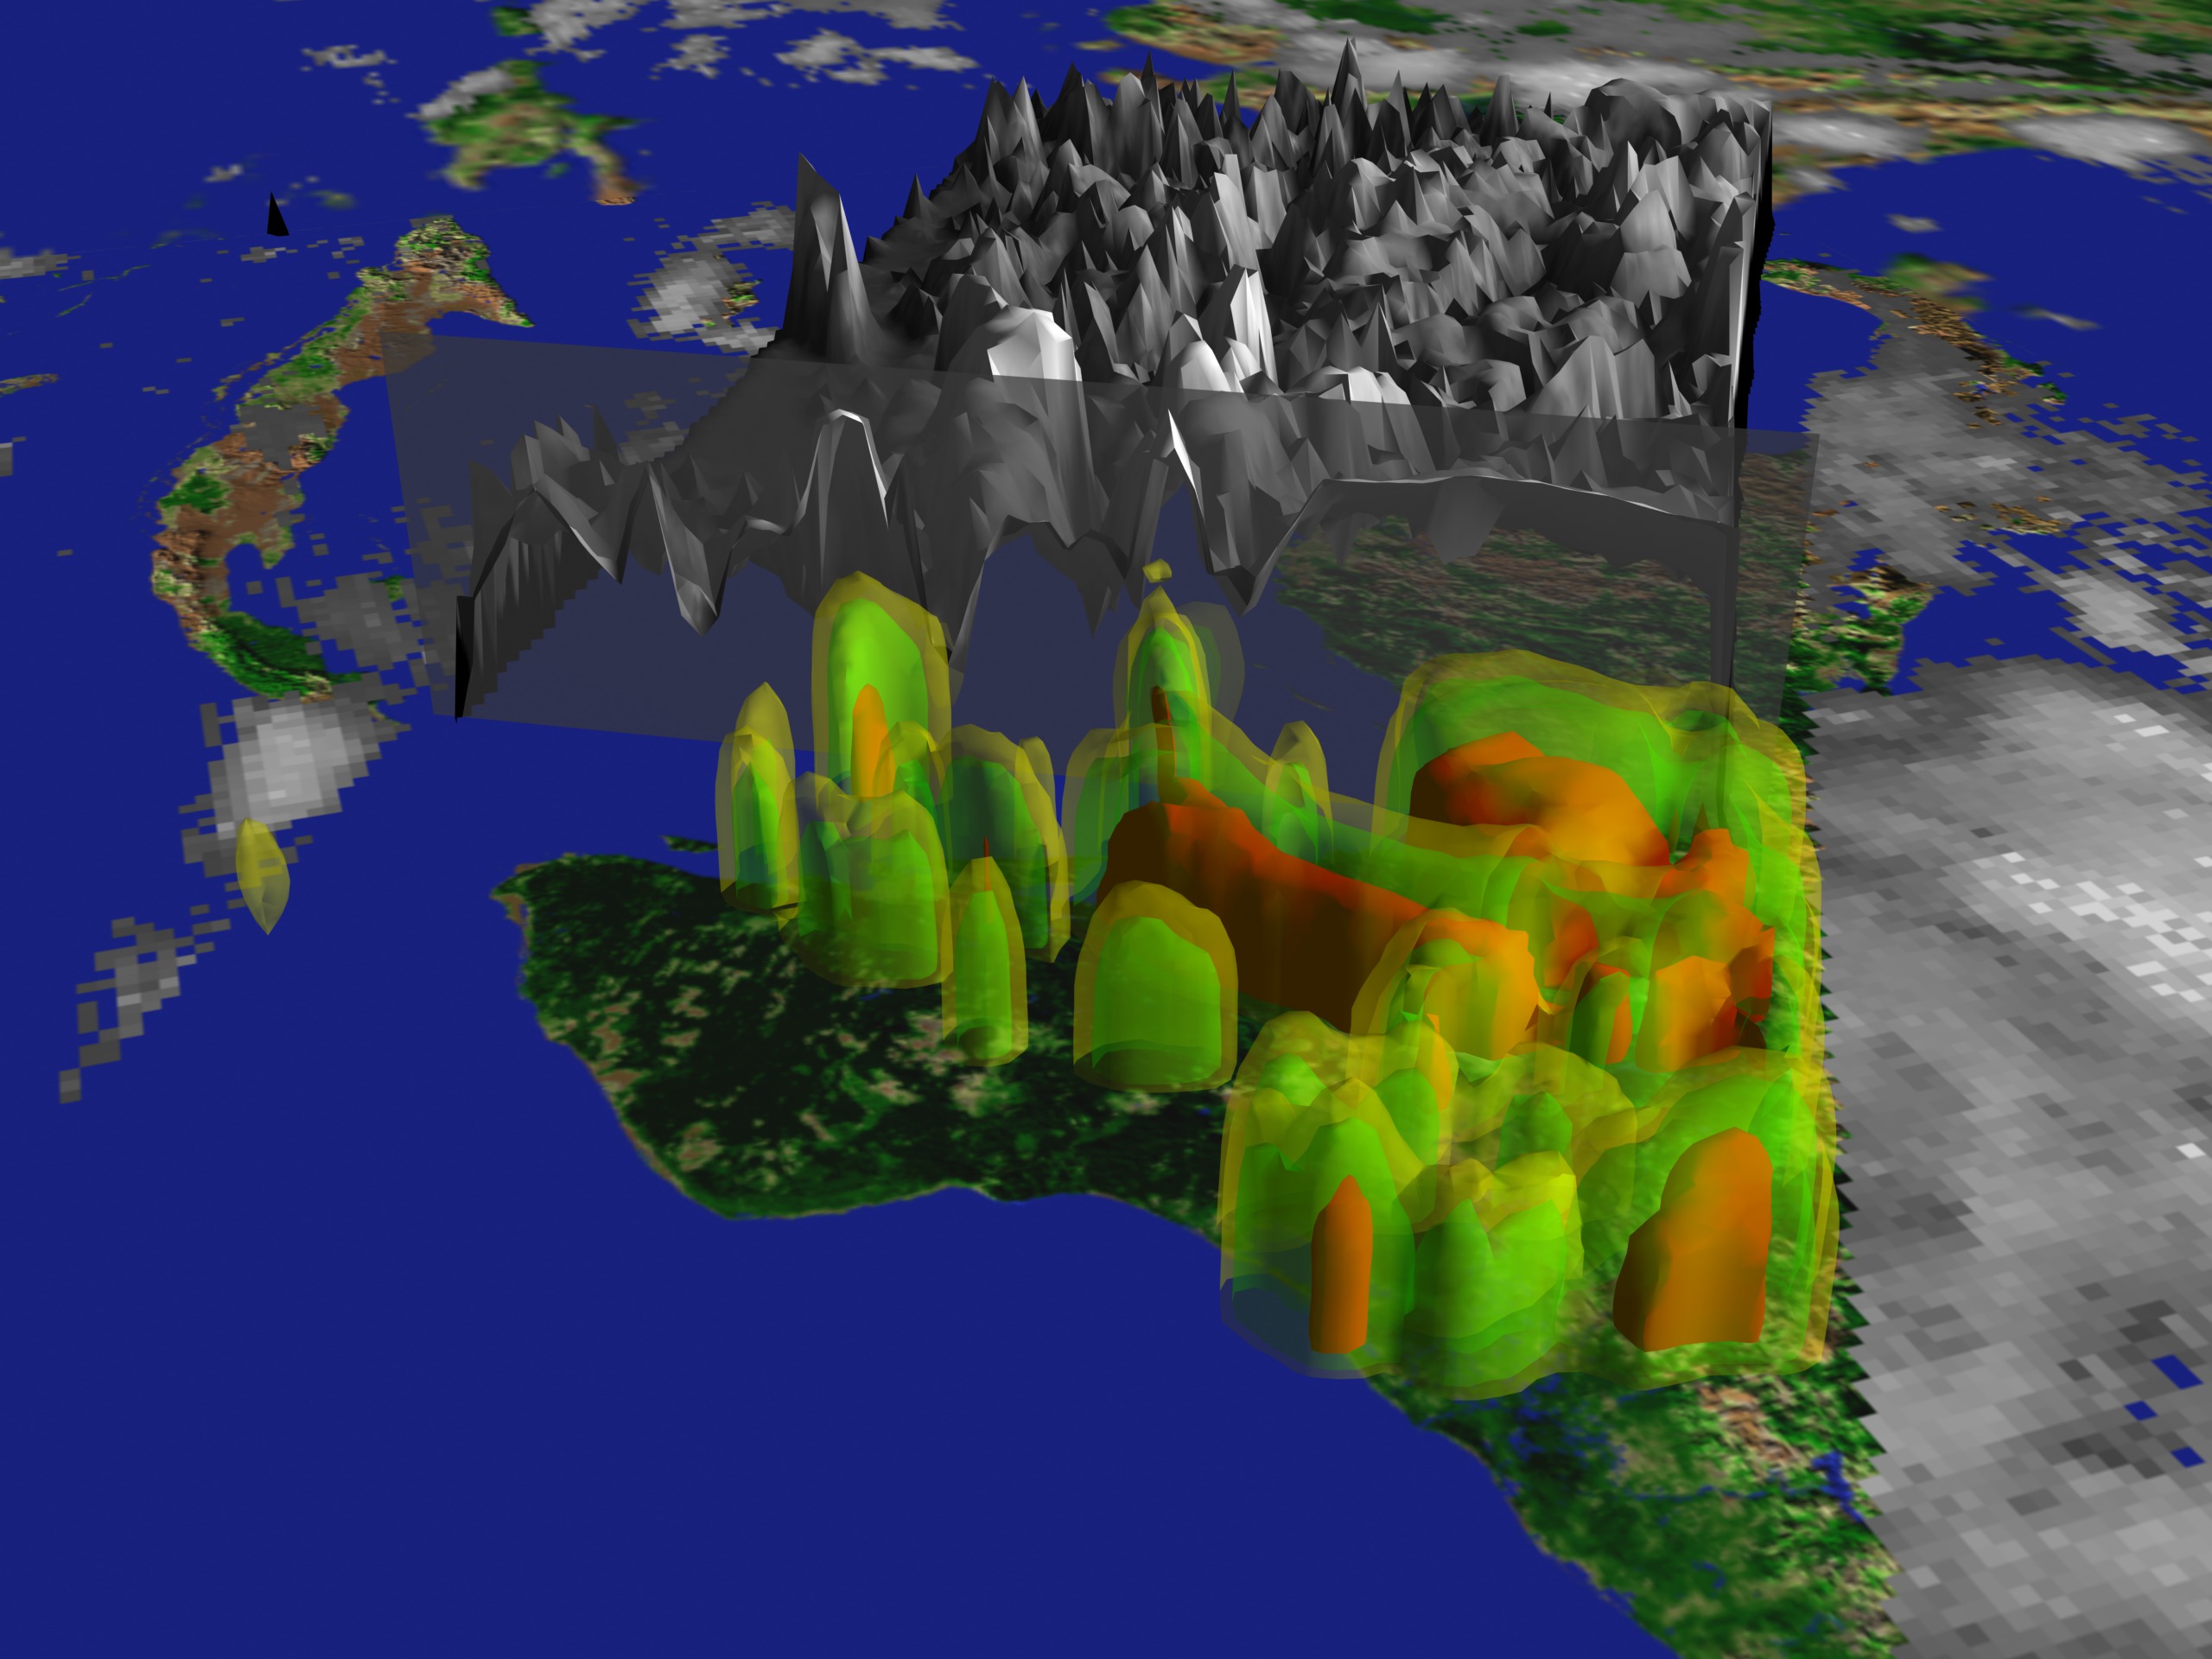
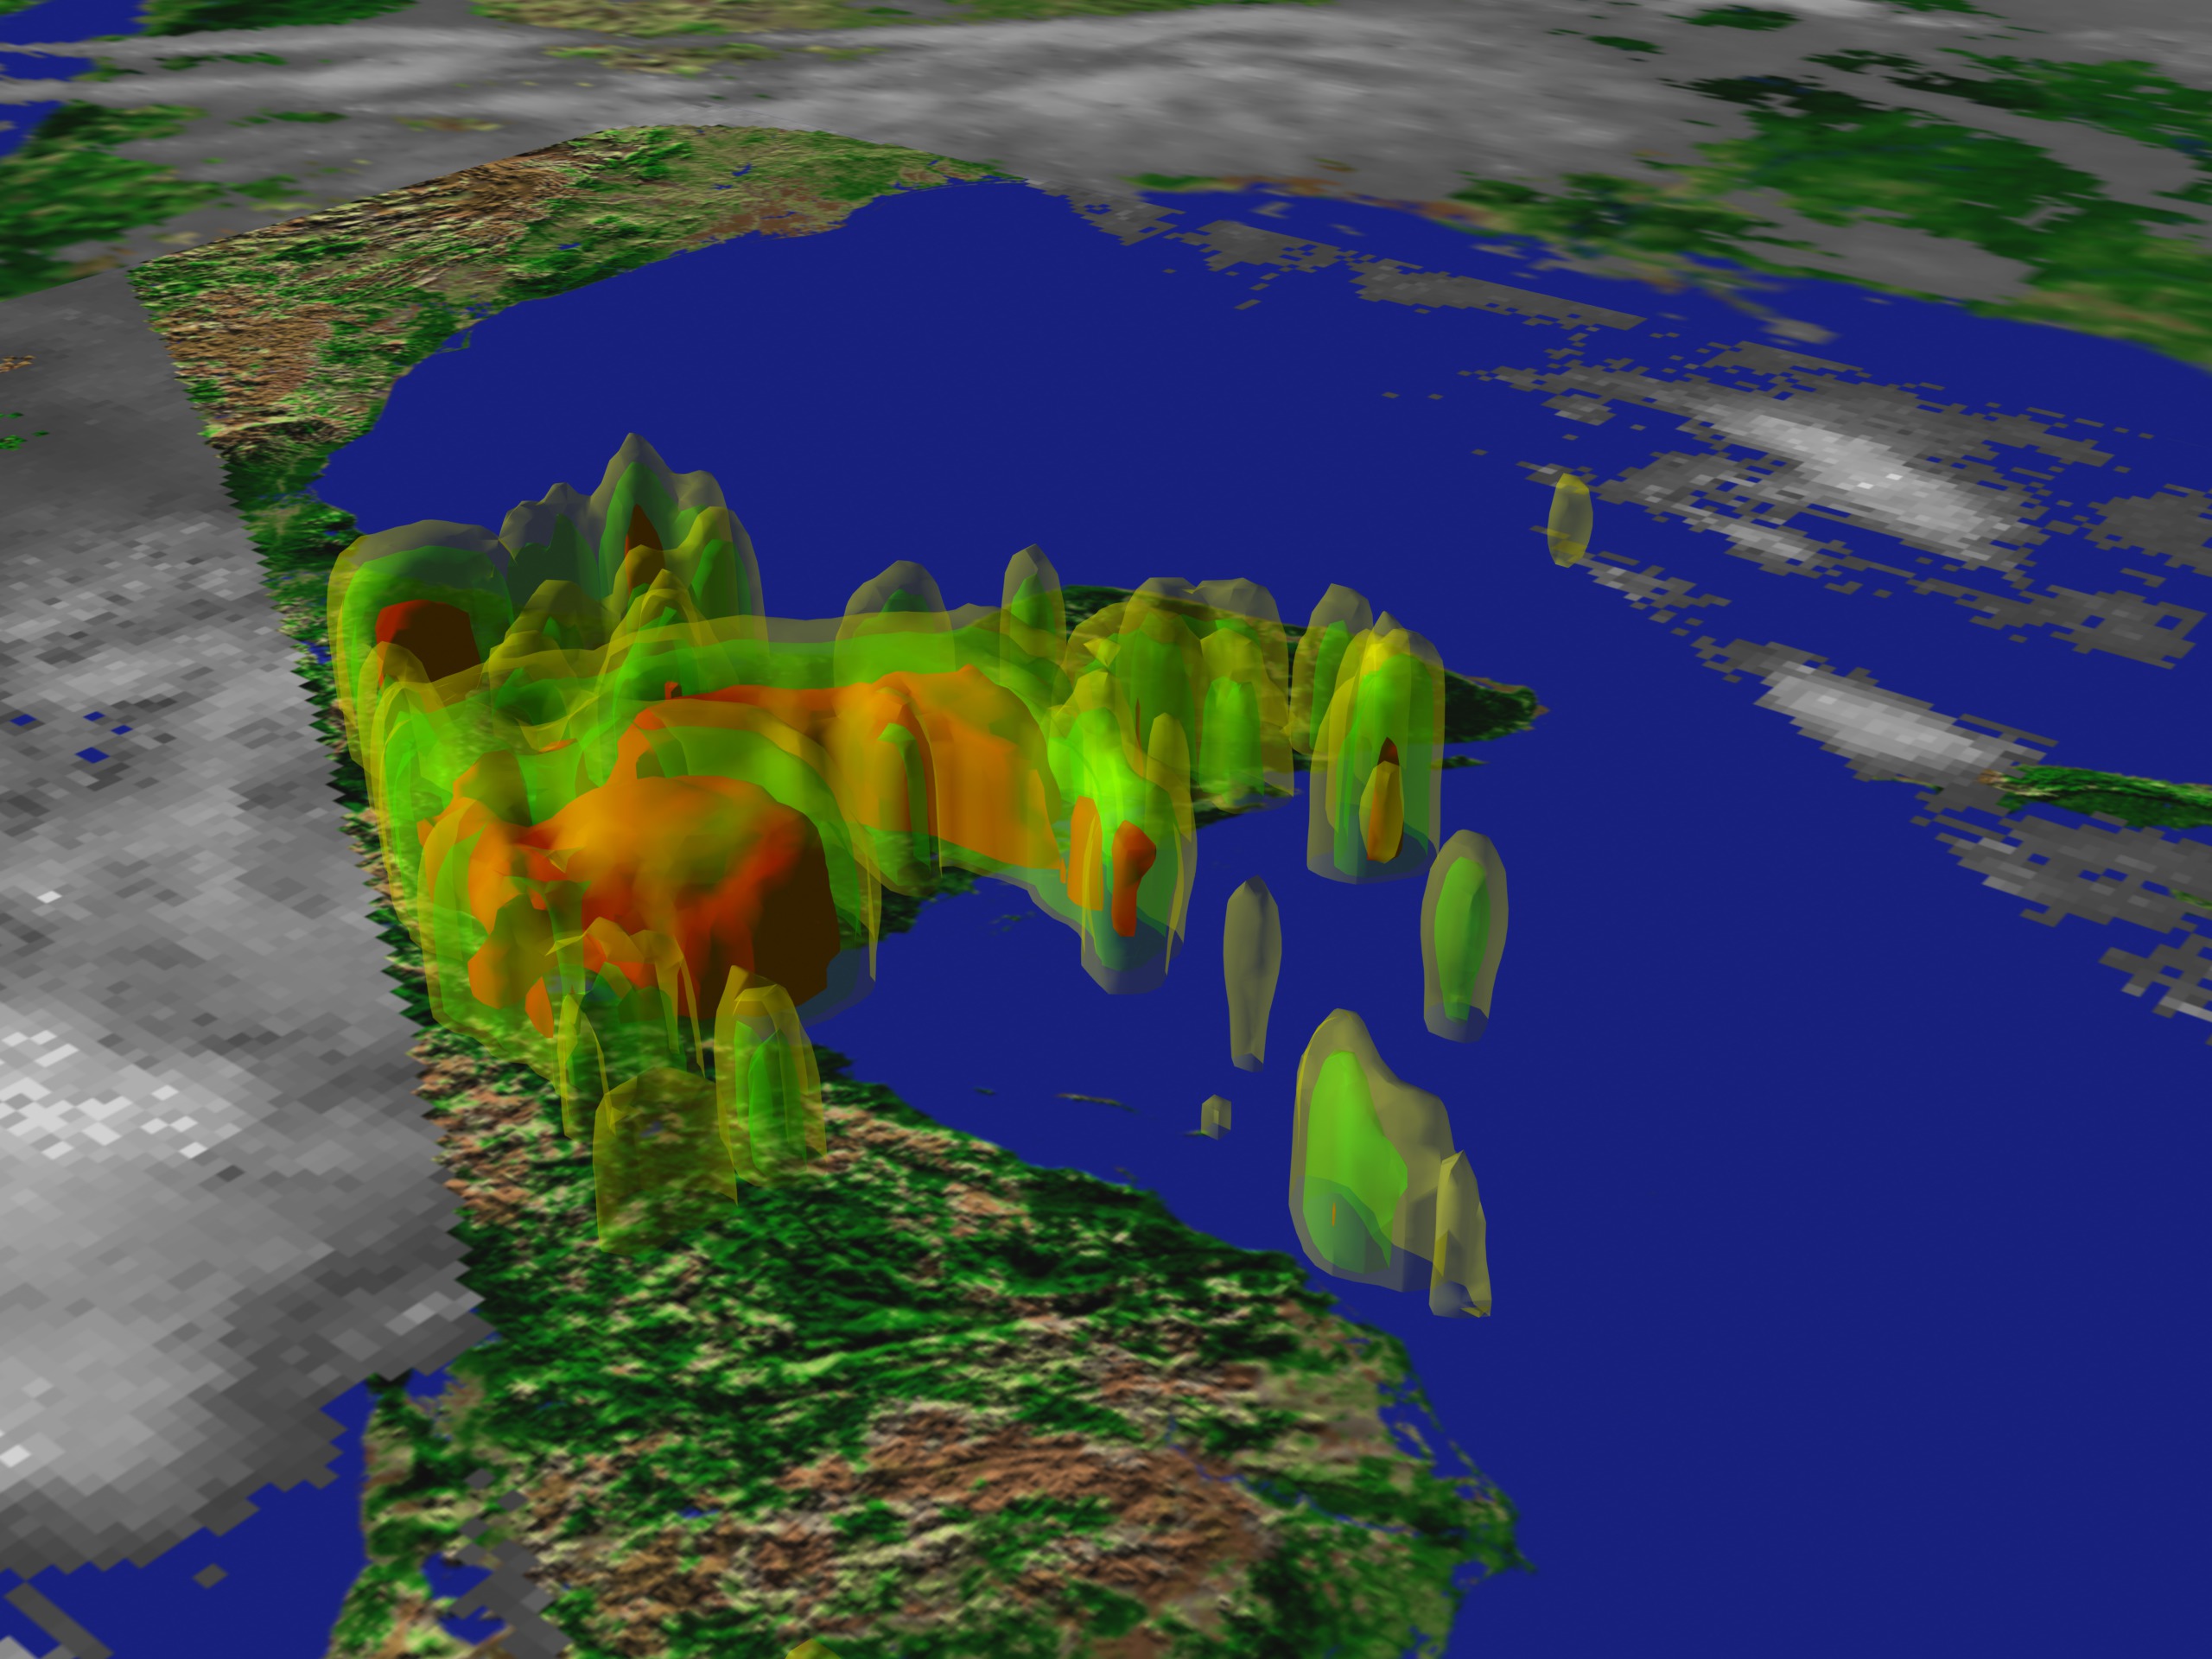

Hurricane Iris from TRMM: October 9, 2001
Visualization Credits
Tom Bridgman (Global Science and Technology, Inc.): Lead Animator
Robert Adler (NASA/GSFC): Scientist
Robert Adler (NASA/GSFC): Scientist
Please give credit for this item to:
NASA/Goddard Space Flight Center Scientific Visualization Studio
NASA/Goddard Space Flight Center Scientific Visualization Studio
Short URL to share this page:
https://svs.gsfc.nasa.gov/2274
Mission:
Tropical Rainfall Measuring Mission - TRMM
Data Used:
Note: While we identify the data sets used in these visualizations, we do not store any further details nor the data sets themselves on our site.
This item is part of this series:
TRMM 3D Hurricanes
Keywords:
DLESE >> Atmospheric science
DLESE >> Natural hazards
GCMD >> Earth Science >> Atmosphere >> Atmospheric Phenomena >> Hurricanes
SVS >> GOES
NASA Science >> Earth
GCMD keywords can be found on the Internet with the following citation: Olsen, L.M., G. Major, K. Shein, J. Scialdone, S. Ritz, T. Stevens, M. Morahan, A. Aleman, R. Vogel, S. Leicester, H. Weir, M. Meaux, S. Grebas, C.Solomon, M. Holland, T. Northcutt, R. A. Restrepo, R. Bilodeau, 2013. NASA/Global Change Master Directory (GCMD) Earth Science Keywords. Version 8.0.0.0.0
https://svs.gsfc.nasa.gov/2274
Mission:
Tropical Rainfall Measuring Mission - TRMM
Data Used:
GOES-8
2001/10/09TRMM/PR
2001/10/09TRMM/TMI
2001/10/09TRMM/VIRS
2001/10/09This item is part of this series:
TRMM 3D Hurricanes
Keywords:
DLESE >> Atmospheric science
DLESE >> Natural hazards
GCMD >> Earth Science >> Atmosphere >> Atmospheric Phenomena >> Hurricanes
SVS >> GOES
NASA Science >> Earth
GCMD keywords can be found on the Internet with the following citation: Olsen, L.M., G. Major, K. Shein, J. Scialdone, S. Ritz, T. Stevens, M. Morahan, A. Aleman, R. Vogel, S. Leicester, H. Weir, M. Meaux, S. Grebas, C.Solomon, M. Holland, T. Northcutt, R. A. Restrepo, R. Bilodeau, 2013. NASA/Global Change Master Directory (GCMD) Earth Science Keywords. Version 8.0.0.0.0


