Spread of the Palisades and Eaton Fires - January 2025
These visualizations highlight the spread of the 2025 Palisades and Eaton fires in California using a fire tracking approach (Chen et al., 2022) and near real-time active fire detections from the VIIRS sensors on the Suomi-NPP and NOAA-20 satellites. Every 12 hours, the fire tracking algorithm uses new active fire detections to update the total fire perimeter and estimate the position of active fire lines—active portions of the perimeter where the fire may continue to spread. Yellow lines indicate the active fire lines associated with VIIRS active fire detections (red points) every 12 hours. Additional fire detections within the fire perimeter indicate flaming and smoldering fire activity behind active fire fronts. This approach provides a detailed perspective on the sub-daily behavior of the Palisades and Eaton fires that occurred in heavily populated regions near Los Angeles, California in January 2025. The Palisades fire started on January 7th and burned 23,448 acres, including many homes and businesses in Pacific Palisades. Concurrently, the Eaton fire started on January 7th (with the first VIIRS fire detections at 01:30 AM on January 8th) and spread rapidly through the city of Altadena, damaging many homes and businesses in neighborhoods adjacent to the NASA Jet Propulsion Laboratory (JPL). The Eaton fire burned a total of 14,021 acres.
The Spread of the Palisades and Eaton Fires
This visualization shows the spread of the Palisades and Eaton fires near Los Angeles, California from January 7 - 13, 2025. The first view of shows the growth of both fires and their locations with respect to the greater Los Angeles area. Following this regional perspective, the time is rewound to show each fire individually. After each individual fire spread is shown, the estimated burned area identified by the VIIRS near real-time fire tracking approach (gray fades to reveal a higher resolution estimate of the burned area (light gray), with damaged homes and other structures shown in yellow. Finally, the progression of active fire lines marking the 12-hour growth of each fire are displayed in a rainbow color scale.
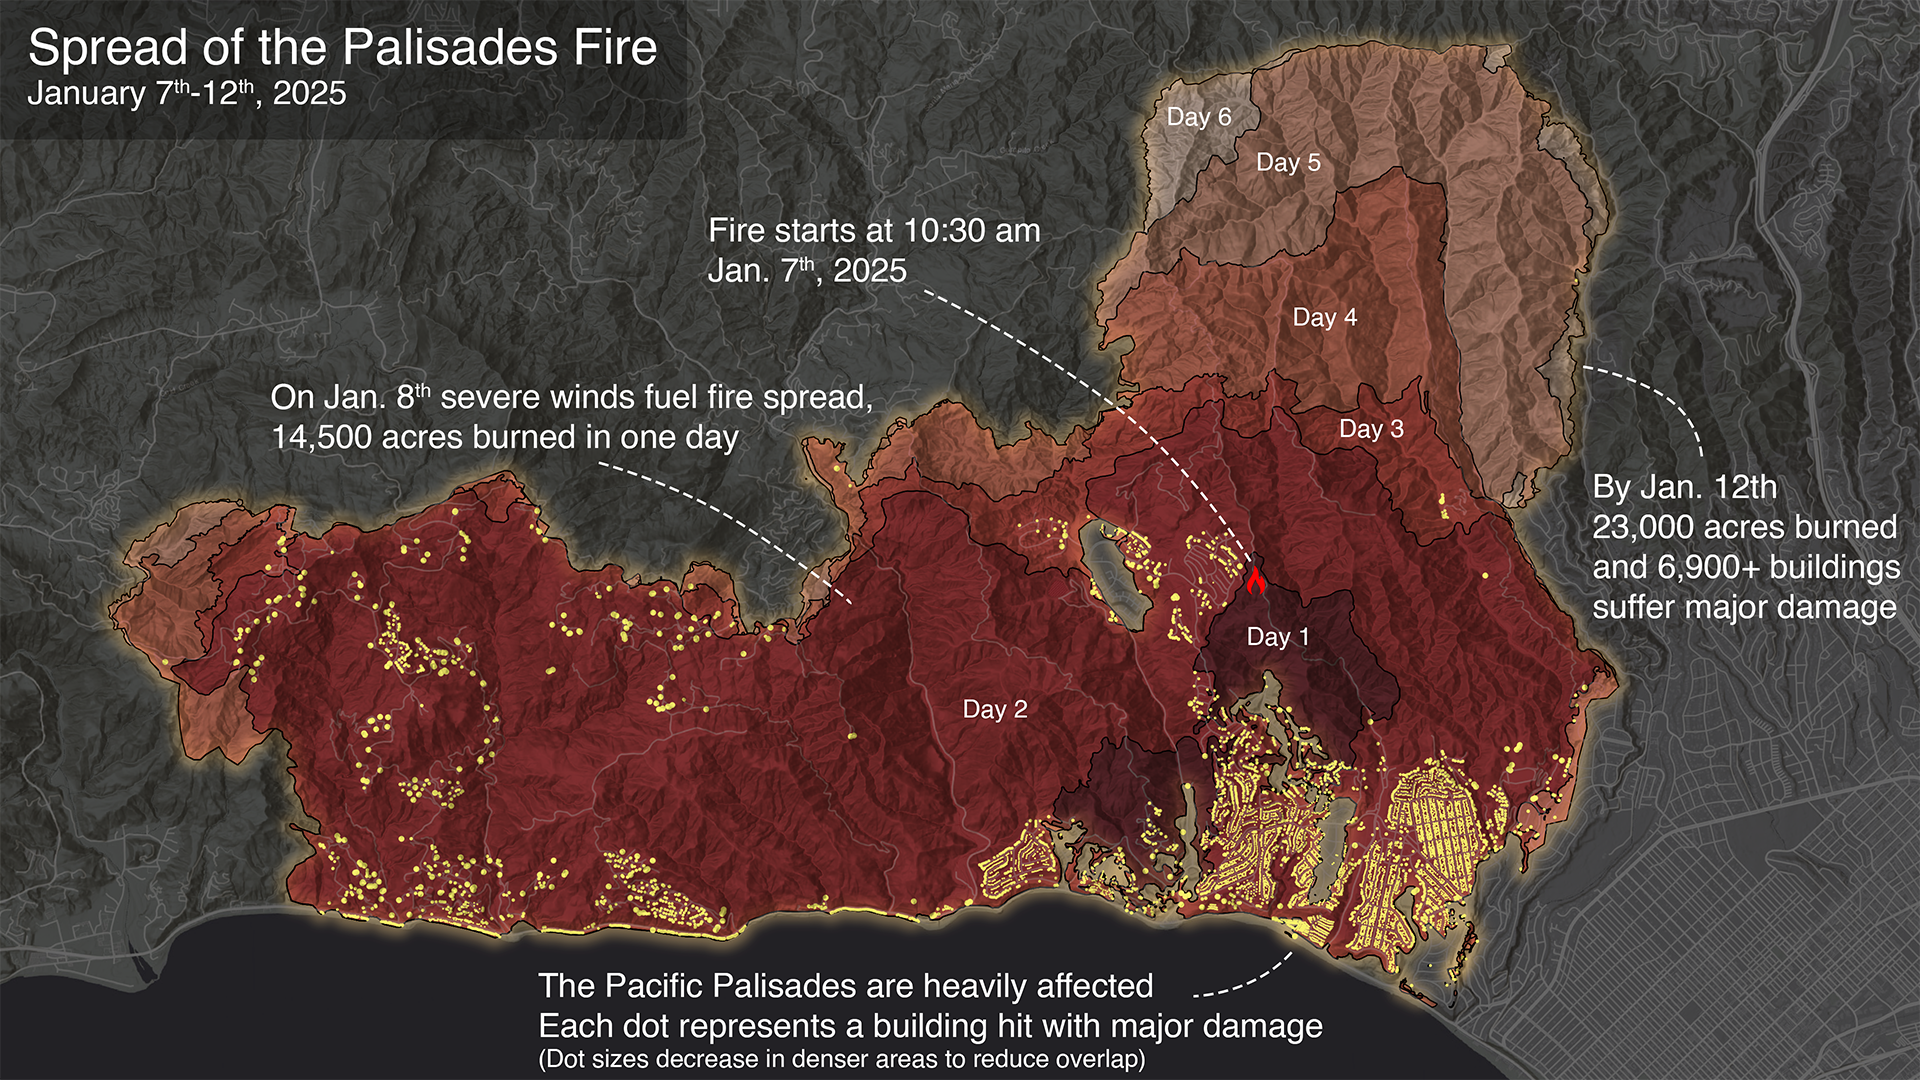
The Spread of the Palisades Fire
This visualization shows the spread of the Palisades fire in Pacific Palisades north of Los Angeles, California from January 7 - 13, 2025. The first view of the shows the greater Los Angeles area followed by a zoom to the Pacific coastline just north of the city. The spread of the Palisades fire is shown with yellow outlines tracking the position of the active fire lines for the last 36 hours along with the active fire detections (red points) and estimated burn area (gray). Following this, time is rewound, the burned area data are faded to reveal a higher resolution estimate of burned area (light gray) and burned structures (yellow) before overlaying the progression of the 12-hourly active fire lines displayed in a rainbow color scale.
The Spread of the Eaton Fire
This visualization shows the spread of the Eaton fire in Altadena, California next to NASA’s Jet Propulsion Laboratory (JPL) from January 7 - 13, 2025. The first view of the shows the greater Los Angeles area followed by a zoom to the Pasadena area just northeast of the city. The spread of the Eaton fire is shown with yellow outlines tracking the position of the active fire lines for the last 36 hours along with the active fire detections (red points) and estimated burned area (gray). Following this, time is rewound, the burn area data are faded to reveal a higher resolution estimate of burned area (light gray) and burned structures (yellow) before overlaying the progression of the 12-ourly active fire lines displayed in a rainbow color scale.
Wide Format Version
This wide format version (7680x2160) was created specifically for the Earth Information Center.
This visualization shows the spread of the Palisades and Eaton fires near Los Angeles, California from January 7 - 13, 2025. The first view of shows the growth of both fires and their locations with respect to the greater Los Angeles area. Following this regional perspective, the time is rewound to show each fire individually. After each individual fire spread is shown, the estimated burned area identified by the VIIRS near real-time fire tracking approach (gray fades to reveal a higher resolution estimate of the burned area (light gray), with damaged homes and other structures shown in yellow. Finally, the progression of active fire lines marking the 12-hour growth of each fire are displayed in a rainbow color scale.
Credits
-
Visualizers
-
Cindy Starr
(Global Science and Technology, Inc.)

-
AJ Christensen
(SSAI)
-
Greg Shirah
(NASA/GSFC)
-
Cindy Starr
(Global Science and Technology, Inc.)
-
Scientist
-
Doug C. Morton
(NASA/GSFC)
-
Doug C. Morton
(NASA/GSFC)
-
Data provider
-
Tempest McCabe
(University of Maryland)
-
Tempest McCabe
(University of Maryland)
-
Producer
- Katie Jepson (eMITS)
Related papers
California wildfire spread derived using VIIRS satellite observations and an object-based tracking system
Chen, Y., Hantson, S., Andela, N. et al. California wildfire spread derived using VIIRS satellite observations and an object-based tracking system. Sci Data 9, 249 (2022). https://doi.org/10.1038/s41597-022-01343-0
DOI: https://doi.org/10.1038/s41597-022-01343-0
This paper can be found at: https://www.nature.com/articles/s41597-022-01343-0
Datasets used
-
Burn severity of vegetation vs. urban surfaces (Burn severity of vegetation vs. urban surfaces derived from combined Sentinel-1 and Sentinel-2 analysis for the Southern California Wildfires) [Sentinel-1 Synthetic Aperture Radar (SAR) and Sentinel-2 MultiSpectral Instrument (MSI)]
ID: 1245Credit: Khuong Tran (ARC), Taejin Park (ARC), Aakash Chhabra (ARC), Weile Wang (ARC), Kyle Kabasares (ARC).
This dataset can be found at: https://maps.disasters.nasa.gov/arcgis/home/item.html?id=ac41ac23863d4c76aeaf80387b1ea2bf
See all pages that use this dataset -
DEM [SRTM: SIR-C]
ID: 481 -
Copernicus Sentinel-2 Imagery (Copernicus Sentinel-2 Imagery for the Southern California Wildfires) [Copernicus Sentinel-2A/2B: MultiSpectral Instrument (MSI)]
ID: 1246Credit: NASA/MSFC, USGS, ESA Copernicus
This dataset can be found at: https://maps.disasters.nasa.gov/arcgis/home/item.html?id=d0fb8628104c4129b5f2976d550d5974
See all pages that use this dataset -
FEDS (Fire Events Data Suite) [NOAA-20 and SUOMI-NPP: VIIRS]
ID: 1247Credit: Tempest McCabe, Douglas Morton, Melanie Follette-Cook, Elijah Orland, Zeb Becker, Yang Chen, Rebecca Scholten, Greg Corradini, Julia Signel, Alexey Shiklomanov, Kateria Sheronin, and Jim Randerson
This dataset can be found at: https://earth-information-system.github.io/fireatlas/docs/nrt.html
See all pages that use this dataset
Note: While we identify the data sets used on this page, we do not store any further details, nor the data sets themselves on our site.
Citing this page
Related
- ID: 5557

- ID: 5568
 Visualization
Release date
This page was originally published on Friday, July 11, 2025.
This page was last updated on Thursday, July 17, 2025 at 1:01 PM EDT.